SDM: a server for predicting effects of mutations on
protein stability
Arun Prasad Pandurangan
1,*, Bernardo Ochoa-Monta ˜
no
1, David B. Ascher
1,2and Tom
L. Blundell
1,*1Department of Biochemistry, University of Cambridge, Cambridge CB2 1GA, UK and2Department of Biochemistry and Molecular Biology, University of Melbourne, Australia
Received February 10, 2017; Revised April 01, 2017; Editorial Decision April 21, 2017; Accepted May 15, 2017
ABSTRACT
Here, we report a webserver for the improved SDM, used for predicting the effects of mutations on pro-tein stability. As a pioneering knowledge-based ap-proach, SDM has been highlighted as the most appro-priate method to use in combination with many other approaches. We have updated the environment-specific amino-acid substitution tables based on the current expanded PDB (a 5-fold increase in informa-tion), and introduced new residue-conformation and interaction parameters, including packing density and residue depth. The updated server has been ex-tensively tested using a benchmark containing 2690 point mutations from 132 different protein structures. The revised method correlates well against the hypo-thetical reverse mutations, better than comparable methods built using machine-learning approaches, highlighting the strength of our knowledge-based ap-proach for identifying stabilising mutations. Given a PDB file (a Protein Data Bank file format containing the 3D coordinates of the protein atoms), and a point mutation, the server calculates the stability differ-ence score between the wildtype and mutant protein. The server is available at http://structure.bioc.cam. ac.uk/sdm2
INTRODUCTION
Recent developments in next-generation sequencing meth-ods have provided a wealth of information on the genetic mutations present in different organisms. In humans,>100 000 genetic variants have been statistically associated with disease conditions (1). The big challenge is to identify and characterize those genetic mutations that have functional consequences. Of particular interest are missense mutations that can disrupt functions of proteins by modulating their stability as well as affecting interactions with other
bio-logical molecules. Hence, predicting the impacts of muta-tions on protein stability and interacmuta-tions is fundamental to the understanding of various biological processes, including disease and drug resistance (2).
While experimental techniques to measure changes in sta-bility between wild-type and mutant proteins are the most accurate, they are time consuming and costly (3). There is a strong need for the development of computational tech-niques to predict the impacts of mutations on protein sta-bility in order to support the rapid and routine analysis of sequencing data necessary for personalized medicine (4).
Methods to predict the impacts of mutations can be broadly classified into sequence- and structure-based ap-proaches. Various sequence-based methods using a broad range of methods have been reported, including support vector machine (INPS) (5), neural networks (6) and deci-sion trees (iPTREE-STAB and MuStab) (7,8). Structure-based methods use either machine learning techniques (9– 16) or potential-energy-based approaches to predict the im-pacts of mutations (17–19). Multi-agent prediction systems, based on statistical scoring functions and machine-learning approaches, have also been reported (20). Various other pre-dictive methods have recently been reviewed elsewhere (21). The development and validation of various computation methods is also supported by databases documenting exper-imental thermodynamic parameters, including the change in free energy between the wild-type and mutant protein (22,23).
Here, we report our updated knowledge-based approach SDM (24,25) and its webserver SDM2 for predicting the ef-fects of mutations on protein stability. SDM pioneered the use of conformationally constrained environment-specific substitution tables (ESSTs) to calculate the change in ther-mal stability between the wildtype and mutant protein (24– 27). SDM has also been successfully used in combination with machine learning techniques to predict better the im-pact of mutations on protein stability (15). Unlike machine learning methods, SDM predictions do not rely on a num-ber of features for training and do not suffer from the issue
*To whom correspondence should be addressed. Email: [email protected] or [email protected]
Correspondence may also be addressed to Tom L. Blundell. Tel: +44 1223 333628; Email: [email protected] C
The Author(s) 2017. Published by Oxford University Press on behalf of Nucleic Acids Research.
This is an Open Access article distributed under the terms of the Creative Commons Attribution License (http://creativecommons.org/licenses/by/4.0/), which permits unrestricted reuse, distribution, and reproduction in any medium, provided the original work is properly cited.
of overfitting. SDM2 uses newly recalculated environment-specific substitution tables (ESSTs) for the purpose of cal-culating the stability difference score between the wild-type and mutant protein structures. New structural param-eters, based on residue packing density, have been intro-duced into the calculation of ESSTs. The newly updated ESSTs were derived from a large set of protein-family se-quence and structure alignments, reflecting the current state of fold-classification databases. Below we describe the up-dated method, webserver and results of the validation pro-cess for three different benchmark datasets.
MATERIALS AND METHODS
Environmental-specific substitution tables
SDM uses a set of conformationally-constrained ESSTs to calculate the difference in stability between the wildtype and mutant protein structure (26,27). In SDM2, the updated ESSTs were derived from 2054 protein family sequence and structure alignments from the TOCCATA database, orig-inally developed to serve as a resource for template iden-tification in homology modelling (28) (Ochoa-Monta ˜no B, and Blundell TL, manuscript in preparation), consisting of 12 038 structures. The TOCCATA database incorporates all domains from SCOP 1.75A and CATH 3.5, forming a con-sensus ‘profile’ whenever the domains of a SCOP family can be reasonably matched to a CATH superfamily, otherwise keeping them in their respective categories.
For the calculation of ESSTs we took representative crys-tal structures (better than 2.5 ˚A resolution) within each family by following the sequence-clustering procedure us-ing Cd-hit (29), as previously described (30). The program ULLA was used for the purpose of calculating ESSTs (31). ESSTs take the form of probability tables giving details about the amino acid residue conservation and substitu-tion to any other residue occurring in a well-defined lo-cal structural environment. They have been shown to cap-ture distinct substitution patterns, specific to a given local structural environment (32). Functional residues, defined as those involved in catalytic site, ligand binding and protein-protein interactions, were identified using CREDO (33) and masked from substitution counts.
Previously, in SDM the ESSTs were derived from HOM-STRAD (34) using 371 protein family sequence alignments consisting of 1357 structures. In SDM2, the ESSTs derived from TOCCATA represent a 6- and 9-fold increase in the number of protein families and structures respectively.
In this paper, we used two further structural parameters based on residue-occluded packing density (OSP) (35,36) and residue depth (37,38) as alternatives to the relative sidechain solvent accessibility (RSA) (39) parameter used in the calculation of ESSTs. The occluded surface for a given residue represents the molecular surface of the surround-ing non-bonded atoms found within 2.8 ˚A (33,34). The OSP of a residue is calculated as a function of occluded surface area and average unit normal distances between the molec-ular surfaces of the atoms in a given residue and the neigh-bouring van der Waals surfaces. The depth of a residue is defined as the average distance of all atom depths found in the residue from the nearest surface water molecule (37,38).
RSA can help identify whether a residue is solvent accessi-ble or inaccessiaccessi-ble. We have previously proposed that OSP and residue depth could be used to classify better the envi-ronment of the interior of the protein (40).
OSP and residue depth have been shown to be important in protein structure and stability analysis (37,41,42). Previ-ous studies have shown that the free energy difference be-tween wild-type and mutant proteins (G) correlates bet-ter with changes in packing paramebet-ters such as occluded surface or residue depth than with the change in accessible surface area upon folding (43). Our analyses of the distri-bution of OSP, depth and RSA based on the TOCCATA dataset suggest that both OSP and depth could be useful structural parameters in defining ESSTs (see Supplemen-tary material, SupplemenSupplemen-tary Figures S1 and S2). Our re-cent analysis of ESSTs using the TOCCATA database in-dicate that the residue conservation progressively increases with residue depth and packing density and could serve as a good indicator for the classification of disease and non-disease mutations (40). These results suggest that account-ing for packaccount-ing interactions is crucial for understandaccount-ing the energetics of protein mutant stability.
We have used various structural parameters to define the local structural environment of amino acid residues for the purpose of calculating ESSTs (See Supplementary text for the description of the individual local structural environ-ments). In SDM2, we used a set of 216 ESSTs defined by the combination of the local structural environment parameters (nine main-chain conformations × three residue occluded surface packings × eight hydrogen bonding) (see Supple-mentary text). The previous version of the SDM webserver (25) used nine main-chain conformations, three RSA classes and only two classes of hydrogen bonding, based on the sat-isfaction of hydrogen bonding potential (44), resulting in a total of 54 ESSTs (denoted 54 RSA, see Supplementary text).
For the purpose of testing SDM2, we have also cal-culated different sets of substitution tables using residue depth (216 depth), a combination of OSP and residue depth (648 RSA OSP depth) as well as a set of ESSTs based on RSA (54 RSA) (see Supplementary text).
Prediction of the impact of mutations on protein stability
The stability difference score in SDM is calculated as fol-lows.
s=sUj k−sFj k−sDi sr uptj k (1) wheresU
j k andsFj k are the differences in stability scores
associated with the substitution of residue typejbykin the unfolded and folded states respectively. They are calculated using ESSTs as described elsewhere (24,25).
In addition to the disruption termsDi sr uptj k described in the original method (24), in SDM2 we have included a new penalty function for the substitution of buried bulky hy-drophobic residues (Phe, Leu and Ile) by Ala or Val that have relatively non-bulky sidechains. All residues with RSA
<17% are considered to be buried. The cutoff of 17% was chosen on the basis of an assessment of relative sidechain solvent accessibility values (45). Residue substitutions
cre-ating void volumes in the buried region of the protein are better quantified using changes in OSP than changes in sidechain surface accessible area. The newly designed cavity penalty function uses a similar form of disruption term. In-stead of accounting for the absolute value of the net change at the mutated position in the sidechain surface accessible area, we modelled it using the absolute value of the net change between the OSP of wild-type and mutated residue relative to the average OSP values (0.33) (36) found at sol-vent exposed regions of the protein. The weighting used in the logarithmic function is adjusted accordingly to improve the stability prediction for buried cavity forming mutants. Our analysis and stability prediction using the large mu-tant dataset showed considerable improvement in the qual-ity of predictions when using the newly introduced cavqual-ity penalty term in addition to the disruption term (see Valida-tion secValida-tion). Therefore, the SDM2 stability difference score in Equation (1) becomes
s=sUj k−sFj k−(sDi sr uptj k +sCavi tyj k ) (2)
Hypothetical reverse mutations
Since the folding free energy (G) is a thermodynamic state function, theGof a mutation from a wild type pro-tein to its mutant (Gwt→mut) equals the –G of a
hy-pothetical reversed mutation from the mutant to the wild type protein,Gmut→wt. In this study, we also considered
the hypothetical reverse mutations in order to test the ro-bustness of the SDM method for predicting protein stability changes upon mutations.
Mutant thermodynamic dataset
For the purpose of testing the method, we have used the following datasets containing only single point mutations. These datasets contain experimental thermodynamic pa-rameters for wildtype and mutant proteins, including the change in Gibbs free energy (G).
S2648. The first data set, S2648 (17), derived from the ProTherm database (22), comprises 2648 single-point mu-tations in 131 different globular proteins.
S350. The second data set, S350 (17), is a randomly se-lected subset of the S2648 dataset comprising 350 mutations in 67 different proteins. We also use this dataset to compare the performance of SDM with other methods.
p53. This dataset contains 42 mutations within the DNA binding domain of the tumour suppressor protein p53 (12). This protein has been extensively studied and the experi-mentalGvalues were obtained from the literature (46– 50).
S140. In order to test the prediction of hypothetical mu-tations we considered using the dataset taken from Liet al.
(51). It contains 140 single point mutations with known 3D structures for both wildtype and mutant proteins and com-prises a total of 128 mutations unique to this dataset.
WEBSERVER Input
The server provides two different input options for the user. The ‘Single Mutation’ option allows the user to predict the effect of a single mutation on the stability of the protein. This option accepts a PDB file or a PDB code and the point mutation specified as a string containing the single letter code of the wildtype residue in the protein, its correspond-ing residue number and the scorrespond-ingle-letter code of the mutant residue. The newly introduced ‘Mutation list’ option allows the user to upload an input file containing a list of up to 20 mutations (input string format similar to the first option), with each mutation listed on a separate line. For both input options the user has to specify the chain id of the protein relevant to the mutation. In addition, the server allows the user to predict the stability score for a reverse mutation by selection of the ‘Predict reverse mutation’ checkbox. Press-ing the ‘Run SDM’ button will start the processPress-ing on the server.
Output
For the ‘Single Mutation’ option, the webserver outputs the predicted stability difference score (pseudoG). The negative (in red) and positive (in blue) values correspond to mutations predicted to be destabilising and stabilising, respectively. A summary of the input is presented, high-lighting the wild-type residue, residue number, chain and the mutant residue. A separate panel lists various struc-tural features used in SDM2 prediction including the class of mainchain conformation, sidechain solvent accessibility, sidechain hydrogen bonding pattern for the wildtype and mutant residues. In the updated server, we have added two new structural annotations including the residue depth and packing density to improve the prediction of stability. The uploaded PDB file with its wildtype residue environment can be visualised directly from the server using the GLmol molecular viewer (Figure1). For the input ‘Mutation list’, the server output (content similar to the ‘Single Mutations’ option) is shown in table format. The user can download prediction results as comma-separated text files and models of the mutated protein for further analysis.
VALIDATION
For 95 stabilizing (G≥0.0) and 255 destabilising (G
<0.0) mutations of the widely used S350 dataset, as well as 42 mutations in the p53 tumor suppressor (11 stabilizing and 31 destabilising), SDM2 achieved Pearson correlations of 0.61 and 0.68 to the experimental observations, a signif-icant improvement of 24% and 134% respectively from the previous version (25) (Table1). For both S350 and p53 the accuracy and Matthews correlation coefficient were found to be above 0.71 and 0.31 respectively (Table 1). For the largest benchmark S2648 (602 stabilising and 2046 desta-bilising mutations), the Pearson correlations, accuracy and Matthews correlation coefficient were 0.48, 0.71 and 0.29 respectively. This represents an improvement in correlation of 7% over the previous version of SDM (Table1). For all
Figure 1. Snapshot of the SDM2 output page, showing the prediction results for the R282W mutation in the tumour suppressor protein p53 (PDB code 2OCJ, chain A). The two left panels display the details of the input mutation, SDM2 stability prediction score for the mutation as stabilising or destabilising and the properties of the structural environment (mainchain conformation class, sidechain solvent accessibility, side chain hydrogen bonding pattern, residue depth and packing density) along with its values for wildtype and mutant residues. The output page also allows the visualisation of the input protein with the wildtype residue (shown in stick representation) and its surrounding protein environment. The user can also download the results as a text file along with the model of the mutant proteins. In p53, the R282W mutation is shown to destabilise the protein resulting in p53 being largely unfolded and inactive (47). SDM2 predicts this mutation to be destabilising and also show considerable improvement over the previous version SDM which predicts this mutation as highly stabilising (25).
cases, the standard error was within 1.56, with S350 achiev-ing the lowest standard error of 1.29 (Table1).
We also tested the method with various sets of ESSTs that included different combinations of structural param-eters (Supplementary Table S1). The results showed that the ESSTs 216 RSA, 216 depth and 648 RSA OSP depth performed equally well in comparison with the 216 OSP that is currently used as default by the method (Supple-mentary Table S1). In most of the cases, the accuracy and Matthews correlation coefficients calculated for S350, P53 and S2648 using ESST 216 OSP are marginally better than 216 RSA, 216 depth and 648 RSA OSP depth (Table 1, Supplementary Table S1). The ESST set previously used by the SDM webserver, 54 RSA (25), was the poorest per-forming among the tested ESSTs. It is worth mentioning that for the commonly found destabilizing mutation in p53 (R282W), SDM2 was able to predict and classify it as a destabilising mutation (pseudoG=–0.08), whereas the previous version of SDM wrongly predicted it as a highly stabilising mutation (pseudoG=3.50).
To demonstrate the impact of the cavity penalty, we per-formed the SDM2 prediction for all the datasets (shown in Table 1) without the cavity penalty contribution. The
re-sults show that the removal of cavity penalty considerably reduced the Pearson correlation of all the datasets (Supple-mentary Table S2), suggesting the importance of its inclu-sion.
We used the dataset S350 for the purpose of comparing SDM2 with other methods. We compared the performance of SDM2 with eight different methods that employ various techniques, including knowledge-based, energy-based and machine-learning approaches. The results show SDM is one of the top performing methods (Table2).
Analysis of residue depth and packing density in mutant sta-bility dataset
We used the largest mutant dataset, S2648, to analyse the distribution of residue depth and packing density found in highly stabilising (G>2.5 kcal/mol) and destabilising mutations (G>–2.5 kcal/mol). The analysis shows that the highly destabilising mutations are mostly found at high residue packing density regions (OSP>0.56) and occur at two distinct depth levels (4 and 8 ˚A) (Supplementary Figure S3A and C). Previously, it has been predicted that the dam-aging mutations have a higher probability of occurring at the protein interior (52). However, highly stabilising
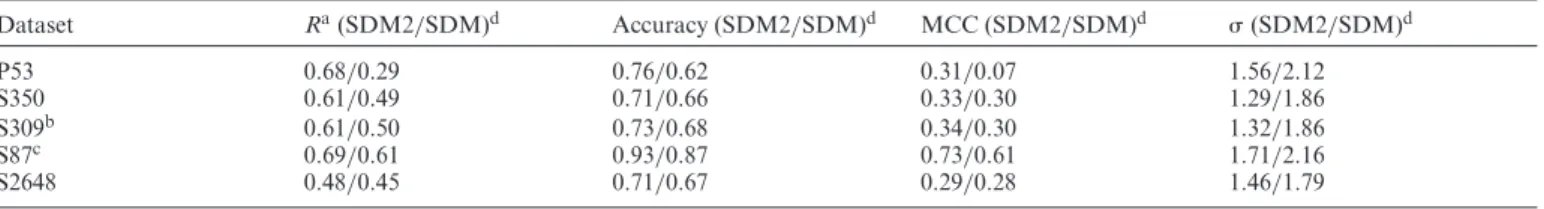
muta-Table 1. Performance of SDM2 on the datasets using new ESSTs based on residue packing density Dataset Ra(SDM2/SDM)d Accuracy (SDM2/SDM)d MCC (SDM2/SDM)d (SDM2/SDM)d P53 0.68/0.29 0.76/0.62 0.31/0.07 1.56/2.12 S350 0.61/0.49 0.71/0.66 0.33/0.30 1.29/1.86 S309b 0.61/0.50 0.73/0.68 0.34/0.30 1.32/1.86 S87c 0.69/0.61 0.93/0.87 0.73/0.61 1.71/2.16 S2648 0.48/0.45 0.71/0.67 0.29/0.28 1.46/1.79
aPearson product-moment correlation coefficient.
bS309 is a subset of S350 containing 309 mutants withGprediction available for all predictors.
cS87 is a subset of S350 containing 87 mutants with the experimentalGvalues causes>2 kcal/mol change and for which aGprediction is available
from all predictors.
dValues are shown for the updated SDM2 in comparison with the previous version of SDM separated by slash.
is the standard error; MCC is the Matthews Correlation Coefficient.
Please see Supplementary text for details about the calculation of Pearson product-moment correlation coefficient, Accuracy, MCC and. Table 2. Comparison of the performance of different prediction methods
S350/S309/S87b
Method No. of predictionsa Rc (kcal/mol) SDM2 350 0.61/0.61/0.69 1.29/1.32/1.71 AUTOMUTE 315 0.46/0.45/0.45 1.43/1.46/1.99 CUPSAT 346 0.37/0.35/0.50 1.91/1.96/2.14 Dmutant 350 0.48/0.47/0.57 1.81/1.87/2.31 Eris 334 0.35/0.34/0.49 4.21/4.28/3.91 I-Mutant-2.0 346 0.29/0.27/0.27 1.65/1.69/2.39 PopMuSic-2.0 350 0.67/0.67/0.71 1.61/1.19/1.67 mCSM 350 0.73/0.74/0.82 1.08/1.10/1.48 MAESTRO 350 0.70/0.69/0.76 1.13/1.17/1.67
a350 mutations were tested with each method. However, some servers failed to compute theGprediction for all mutants, resulting in predictions for
less than the full number.
bThree values are shown separated by slash. The first value corresponds to the whole validation set of 350 mutants. The second value corresponds to the
309 mutants withGprediction available for all predictors. The third value corresponds to 87 mutants with the experimentalGvalues causes>2 kcal/mol change and for which aGprediction is available from all predictors.
cPearson product-moment correlation coefficient.
tions were observed to occur mostly at high packing density regions and at residue depth∼4 ˚A (Supplementary Figure S3B and D).
We also used the dataset S2648 to study the impact of the cavity creating hydrophobic mutations on protein stability as well as the structural signatures (accessibility, depth and packing density) associated with such mutations. About 9% of the mutations in S2648 (226/2648) are found to be cavity-forming hydrophobic mutations. The minimum, maximum and the average of the experimental G val-ues for those mutations are –5.0, 2.1 and –2.1 kcal/mol respectively, showing that most of the cavity forming mu-tations are highly destabilising in nature with a standard deviation of 1.40. For those mutations, the average cavity penalty contribution is 1.65 which is in scale with the aver-age experimentalGvalues. From the structural environ-ment point of view, the average values of relative sidechain solvent accessibility, packing density and depth of the wild-type residues involved in cavity forming mutation are 3%, 0.50 and 7.12 ˚A respectively. For cavity forming hydropho-bic mutations, the residue depth shows the most variation ( =1.68) compared to the residue-packing density (= 0.07).
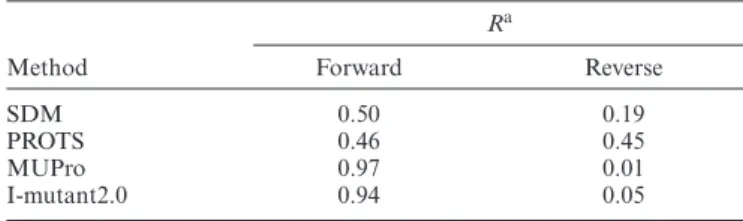
Prediction using hypothetical reverse mutations
As discussed earlier, theGof a mutation from a wild-type protein to its mutant (Gwt→mut) is equivalent to
the –Gof a hypothetical reverse mutation from the mu-tant to the wild type protein,Gmut→wt(51). To test this,
we used the dataset S140 to conduct an evaluation of the performance for reverse mutations (assuming no confor-mational changes involved in the generation of the mutant models). The dataset contains experimentalG’s for 140 mutations with known 3D structures for both wildtype and mutants. SDM2 prediction shows positive correlation for both forward (0.50) and reverse mutations (0.19) (Table3, Supplementary Table S3). The performance of SDM2 to predict forward and reverse mutations was compared with the previously reported comparison study using three dif-ferent methods (51). The method PROTS (51) shows com-paratively strong correlation for both forward and reverse mutations (Table3). However, the prediction performance of the machine-learning approaches like MUpro (11) and I-Mutant2.0 (10), diminishes for the hypothetical reversed mutations (Table3). The sequence based method INPS (5) that uses a Support Vector Machine algorithm has been shown to predict reverse mutations better than SDM2 for the largest dataset S2648. The Pearson’s correlation coeffi-cients of the former and latter are 0.53 and 0.24 respectively. We observed that for dataset S140, the removal of the
dis-Table 3. Performance of SDM2 for the forward and reverse mutations and the comparison with other methods
Ra
Method Forward Reverse SDM 0.50 0.19 PROTS 0.46 0.45 MUPro 0.97 0.01 I-mutant2.0 0.94 0.05
aPearson product–moment correlation coefficient.
ruption penalty from SDM2 further improved the overall prediction of the hypothetical reverse mutation with the cor-relation for forward and reverse mutations equal to 0.42 and 0.39 respectively (Supplementary Table S3). Similar trends were observed when tested on several other benchmark sets including p53, S350 and S2648 that require the genera-tion of mutant models (Supplementary Table S3). It is also worth noting that the removal of the disruption penalty also reduces the performance of SDM2 in predicting forward mutations and hence further work is required to improve the functional form of the disruption penalty term, possi-bly by accounting for the compensatory changes upon mu-tation occurring both in the interior and on surface regions of the proteins.
SUMMARY
SDM2 has been tested on a wide range of datasets routinely used in the literature. The newly updated ESSTs, based on residue packing density, improved the overall performance of the method. Analysis of the use of residue packing den-sity has shown an improved ability to classify disease and non-disease mutations (40) and hence SDM2 with the newly updated ESST based on packing density is likely to be a use-ful tool for understanding disease mutations (53–59) and to guide protein engineering. In addition to the prediction of single mutations, the webserver also provides the additional option to run predictions of a list of user submitted muta-tions. The updated method has been shown to perform bet-ter with the hypothetical reverse mutation in comparison to other well-known machine-learning methods. The SDM2 predictions reported are available for download from the webserver by following the link to the ‘Data sets’ page. The web interface and the usability of the server have been considerably improved and designed to be compatible with most commonly used modern web browsers. In the future, the SDM2 method will be expanded to predict the impact of mutations on protein–protein and protein–ligand inter-actions.
SUPPLEMENTARY DATA
Supplementary Data are available at NAR Online.
FUNDING
Gates HIT-TB and the EU MM4TB [Project ID: 260872 to A.P.P. and T.L.B.]; Bill & Melinda Gates Founda-tion [RG60453 to B.O.M.]; Jack Brockhoff FoundaFounda-tion
[JBF 4186, 2016 to D.B.A.]; C.J. Martin Research Fel-lowship from the National Health and Medical Research Council of Australia [APP1072476]; Wellcome Trust Pro-gramme Grant [093167/Z/10/Z to D.B.A., T.L.B.]; New-ton Fund RCUK-CONFAP Grant awarded by The Med-ical Research Council (MRC) [MR/M026302/1]. Fund-ing for open access charge: Bill & Melinda Gates Founda-tion [RG60453] Gates HIT-TB; Wellcome Trust Programme Grant [093167/Z/10/Z]; Newton Fund RCUK-CONFAP Grant awarded by the Medical Research Council (MRC) [MR/M026302/1].
Conflict of interest statement.None declared.
REFERENCES
1. Burgess,D.J. (2015) Disease genetics: Network effects of disease mutations.Nat. Rev. Genet.,16, 317.
2. Pires,D.E., Chen,J., Blundell,T.L. and Ascher,D.B. (2016) In silico functional dissection of saturation mutagenesis: interpreting the relationship between phenotypes and changes in protein stability, interactions and activity.Sci. Rep.,6, 19848.
3. Magliery,T.J., Lavinder,J.J. and Sullivan,B.J. (2011) Protein stability by number: high-throughput and statistical approaches to one of protein science’s most difficult problems.Curr. Opin. Chem. Biol.,15, 443–451.
4. Rabbani,B., Nakaoka,H., Akhondzadeh,S., Tekin,M. and Mahdieh,N. (2016) Next generation sequencing: implications in personalized medicine and pharmacogenomics.Mol. Biosyst.,12, 1818–1830.
5. Fariselli,P., Martelli,P.L., Savojardo,C. and Casadio,R. (2015) INPS: predicting the impact of non-synonymous variations on protein stability from sequence.Bioinformatics,31, 2816–2821. 6. Capriotti,E., Fariselli,P. and Casadio,R. (2004) A
neural-network-based method for predicting protein stability changes upon single point mutations.Bioinformatics,20(Suppl 1), i63–i68. 7. Huang,L.T., Gromiha,M.M. and Ho,S.Y. (2007) iPTREE-STAB:
interpretable decision tree based method for predicting protein stability changes upon mutations.Bioinformatics,23, 1292–1293. 8. Teng,S., Srivastava,A.K. and Wang,L. (2010) Sequence feature-based
prediction of protein stability changes upon amino acid substitutions.
BMC Genomics,11(Suppl 2), S5.
9. Masso,M. and Vaisman,II. (2008) Accurate prediction of stability changes in protein mutants by combining machine learning with structure based computational mutagenesis.Bioinformatics,24, 2002–2009.
10. Capriotti,E., Fariselli,P. and Casadio,R. (2005) I-Mutant2.0: predicting stability changes upon mutation from the protein sequence or structure.Nucleic Acids Res.,33, W306–W310.
11. Cheng,J., Randall,A. and Baldi,P. (2006) Prediction of protein stability changes for single-site mutations using support vector machines.Proteins,62, 1125–1132.
12. Pires,D.E., Ascher,D.B. and Blundell,T.L. (2014) mCSM: predicting the effects of mutations in proteins using graph-based signatures.
Bioinformatics,30, 335–342.
13. Pires,D.E., Blundell,T.L. and Ascher,D.B. (2016) mCSM-lig: quantifying the effects of mutations on protein-small molecule affinity in genetic disease and emergence of drug resistance.Sci. Rep.,
6, 29575.
14. Pires,D.E. and Ascher,D.B. (2016) mCSM-AB: a web server for predicting antibody-antigen affinity changes upon mutation with graph-based signatures.Nucleic Acids Res.,44, W469–W473. 15. Pires,D.E., Ascher,D.B. and Blundell,T.L. (2014) DUET: a server for
predicting effects of mutations on protein stability using an integrated computational approach.Nucleic Acids Res.,42, W314–W319. 16. Pires,D.E. and Ascher,D.B. (2017) mCSM-NA: Predicting the effects
of mutations on protein-nucleic acids interactions.Nucleic Acids Res., doi:10.1093/nar/gkx236.
17. Dehouck,Y., Grosfils,A., Folch,B., Gilis,D., Bogaerts,P. and Rooman,M. (2009) Fast and accurate predictions of protein stability changes upon mutations using statistical potentials and neural networks: PoPMuSiC-2.0.Bioinformatics,25, 2537–2543.
18. Bordner,A.J. and Abagyan,R.A. (2004) Large-scale prediction of protein geometry and stability changes for arbitrary single point mutations.Proteins,57, 400–413.
19. Kellogg,E.H., Leaver-Fay,A. and Baker,D. (2011) Role of
conformational sampling in computing mutation-induced changes in protein structure and stability.Proteins,79, 830–838.
20. Laimer,J., Hofer,H., Fritz,M., Wegenkittl,S. and Lackner,P. (2015) MAESTRO–multi agent stability prediction upon point mutations.
BMC Bioinformatics,16, 116.
21. Kulshreshtha,S., Chaudhary,V., Goswami,G.K. and Mathur,N. (2016) Computational approaches for predicting mutant protein stability.J. Comput. Aided Mol. Des.,30, 401–412.
22. Kumar,M.D., Bava,K.A., Gromiha,M.M., Prabakaran,P.,
Kitajima,K., Uedaira,H. and Sarai,A. (2006) ProTherm and ProNIT: thermodynamic databases for proteins and protein-nucleic acid interactions.Nucleic Acids Res.,34, D204–D206.
23. Pires,D.E., Blundell,T.L. and Ascher,D.B. (2015) Platinum: a database of experimentally measured effects of mutations on structurally defined protein-ligand complexes.Nucleic Acids Res.,43, D387–D391.
24. Topham,C.M., Srinivasan,N. and Blundell,T.L. (1997) Prediction of the stability of protein mutants based on structural
environment-dependent amino acid substitution and propensity tables.Protein Eng.,10, 7–21.
25. Worth,C.L., Preissner,R. and Blundell,T.L. (2011) SDM–a server for predicting effects of mutations on protein stability and malfunction.
Nucleic Acids Res.,39, W215–W222.
26. Overington,J., Donnelly,D., Johnson,M.S., Sali,A. and Blundell,T.L. (1992) Environment-specific amino acid substitution tables: tertiary templates and prediction of protein folds.Protein Sci.,1, 216–226. 27. Topham,C.M., McLeod,A., Eisenmenger,F., Overington,J.P.,
Johnson,M.S. and Blundell,T.L. (1993) Fragment ranking in modelling of protein structure. Conformationally constrained environmental amino acid substitution tables.J. Mol. Biol.,229, 194–220.
28. Ochoa-Montano,B., Mohan,N. and Blundell,T.L. (2015) CHOPIN: a web resource for the structural and functional proteome of
Mycobacterium tuberculosis.Database (Oxford),2015, bav026. 29. Li,W. and Godzik,A. (2006) Cd-hit: a fast program for clustering and
comparing large sets of protein or nucleotide sequences.
Bioinformatics,22, 1658–1659.
30. Gong,S. and Blundell,T.L. (2010) Structural and functional restraints on the occurrence of single amino acid variations in human proteins.
PLoS One,5, e9186.
31. Lee,S. and Blundell,T.L. (2009) Ulla: a program for calculating environment-specific amino acid substitution tables.Bioinformatics,
25, 1976–1977.
32. Overington,J., Johnson,M.S., Sali,A. and Blundell,T.L. (1990) Tertiary structural constraints on protein evolutionary diversity: templates, key residues and structure prediction.Proc. Biol. Sci.,241, 132–145.
33. Schreyer,A. and Blundell,T. (2009) CREDO: a protein-ligand interaction database for drug discovery.Chem. Biol. Drug Des.,73, 157–167.
34. Mizuguchi,K., Deane,C.M., Blundell,T.L. and Overington,J.P. (1998) HOMSTRAD: a database of protein structure alignments for homologous families.Protein Sci.,7, 2469–2471.
35. Pattabiraman,N., Ward,K.B. and Fleming,P.J. (1995) Occluded molecular surface: analysis of protein packing.J. Mol. Recognit.,8, 334–344.
36. Fleming,P.J. and Richards,F.M. (2000) Protein packing: dependence on protein size, secondary structure and amino acid composition.J. Mol. Biol.,299, 487–498.
37. Chakravarty,S. and Varadarajan,R. (1999) Residue depth: a novel parameter for the analysis of protein structure and stability.
Structure,7, 723–732.
38. Tan,K.P., Nguyen,T.B., Patel,S., Varadarajan,R. and
Madhusudhan,M.S. (2013) Depth: a web server to compute depth, cavity sizes, detect potential small-molecule ligand-binding cavities and predict the pKa of ionizable residues in proteins.Nucleic Acids Res.,41, W314–W321.
39. Mizuguchi,K., Deane,C.M., Blundell,T.L., Johnson,M.S. and Overington,J.P. (1998) JOY: protein sequence-structure representation and analysis.Bioinformatics,14, 617–623.
40. Pandurangan,A.P., Ascher,D.B., Thomas,S.E. and Blundell,T.L. (2017) Genomes, structural biology and drug discovery: combating the impacts of mutations in genetic disease and antibiotic resistance.
Biochem. Soc. Trans.,45, 303–311.
41. DeDecker,B.S., O’Brien,R., Fleming,P.J., Geiger,J.H., Jackson,S.P. and Sigler,P.B. (1996) The crystal structure of a hyperthermophilic archaeal TATA-box binding protein.J. Mol. Biol.,264, 1072–1084. 42. Richards,F.M. and Lim,W.A. (1993) An analysis of packing in the
protein folding problem.Q. Rev. Biophys.,26, 423–498.
43. Ratnaparkhi,G.S. and Varadarajan,R. (2000) Thermodynamic and structural studies of cavity formation in proteins suggest that loss of packing interactions rather than the hydrophobic effect dominates the observed energetics.Biochemistry,39, 12365–12374.
44. Worth,C.L. and Blundell,T.L. (2009) Satisfaction of
hydrogen-bonding potential influences the conservation of polar sidechains.Proteins,75, 413–429.
45. Worth,C.L. (2008) The role of amino acid sidechains in protein stability. Ph.D. Thesis. University of Cambridge.
46. Ang,H.C., Joerger,A.C., Mayer,S. and Fersht,A.R. (2006) Effects of common cancer mutations on stability and DNA binding of full-length p53 compared with isolated core domains.J. Biol. Chem.,
281, 21934–21941.
47. Bullock,A.N., Henckel,J. and Fersht,A.R. (2000) Quantitative analysis of residual folding and DNA binding in mutant p53 core domain: definition of mutant states for rescue in cancer therapy.
Oncogene,19, 1245–1256.
48. Joerger,A.C., Ang,H.C. and Fersht,A.R. (2006) Structural basis for understanding oncogenic p53 mutations and designing rescue drugs.
Proc. Natl. Acad. Sci. U.S.A.,103, 15056–15061.
49. Nikolova,P.V., Henckel,J., Lane,D.P. and Fersht,A.R. (1998) Semirational design of active tumor suppressor p53 DNA binding domain with enhanced stability.Proc. Natl. Acad. Sci. U.S.A.,95, 14675–14680.
50. Nikolova,P.V., Wong,K.B., DeDecker,B., Henckel,J. and Fersht,A.R. (2000) Mechanism of rescue of common p53 cancer mutations by second-site suppressor mutations.EMBO J.,19, 370–378.
51. Li,Y., Zhang,J., Tai,D., Middaugh,C.R., Zhang,Y. and Fang,J. (2012) PROTS: a fragment based protein thermo-stability potential.
Proteins,80, 81–92.
52. Vitkup,D., Sander,C. and Church,G.M. (2003) The amino-acid mutational spectrum of human genetic disease.Genome Biol.,4, R72. 53. Casey,R., Ascher,D.B., Rattenberry,E., Izatt,L., Andrews,K.,
Simpson,H., Challis,B., Bulusu,R.V., Laloo,F., Pires,D.E.et al.
(2017) SDHA related tumorigenesis: a new case series and literature review for variant interpretation and pathogenicity.Mol. Genet. Genomic Med., doi:10.1002/mgg3.279.
54. Jafri,M., Wake,N.C., Ascher,D.B., Pires,D.E., Gentle,D., Morris,M.R., Rattenberry,E., Simpson,M.A., Trembath,R.C., Weber,A.et al.(2015) Germline mutations in the CDKN2B tumor suppressor gene predispose to renal cell carcinoma.Cancer Discov.,5, 723–729.
55. Nemethova,M., Radvanszky,J., Kadasi,L., Ascher,D.B., Pires,D.E., Blundell,T.L., Porfirio,B., Mannoni,A., Santucci,A., Milucci,L.et al.
(2016) Twelve novel HGD gene variants identified in 99 alkaptonuria patients: focus on ‘black bone disease’ in Italy.Eur. J. Hum. Genet.,
24, 66–72.
56. Silvino,A.C., Costa,G.L., Araujo,F.C., Ascher,D.B., Pires,D.E., Fontes,C.J., Carvalho,L.H., Brito,C.F. and Sousa,T.N. (2016) Variation in human cytochrome P-450 drug-metabolism genes: a gateway to the understanding of Plasmodium vivax relapses.PLoS One,11, e0160172.
57. Usher,J.L., Ascher,D.B., Pires,D.E., Milan,A.M., Blundell,T.L. and Ranganath,L.R. (2015) Analysis of HGD gene mutations in patients with alkaptonuria from the United Kingdom: identification of novel mutations.JIMD Rep.,24, 3–11.
58. White,R.R., Ponsford,A.H., Weekes,M.P., Rodrigues,R.B., Ascher,D.B., Mol,M., Selkirk,M.E., Gygi,S.P., Sanderson,C.M. and Artavanis-Tsakonas,K. (2016) Ubiquitin-dependent modification of skeletal muscle by the parasitic nematode, Trichinella spiralis.PLoS Pathog.,12, e1005977.
59. Soardi,F.C., Machado-Silva,A., Linhares,N.D., Zheng,G., Qu,Q., Pena,H.B., Martins,T.M.M., Vieira,H.G.S., Pereira,N.B.,
Melo-Minardi,R.C.et al.(2017) Familial STAG2 germline mutation defines a new human cohesinopathy.npj Genomic Med.,2, 1.