Utilizing Ubiquitous WiFi Signals
Xuan Du
School of Computer Science and Electronic Engineering
University of Essex
This thesis is submitted for the degree of
Doctor of Philosophy
I hereby declare that except where specific reference is made to the work of others, the contents of this dissertation are original and have not been submitted in whole or in part for consideration for any other degree or qualification in this, or any other University. This dissertation is the result of my work and includes nothing which is the outcome of work done in collaboration, except where explicitly indicated in the text. This dissertation contains less than 80,000 words including appendices, bibliography, footnotes, tables and equations and has less than 150 figures.
Xuan Du February 2018
First and foremost, enormous gratitude is due to Prof. Kun Yang who has been there as my supervisor for four years and has been unstinting in his support and constructive critique. I also want to thank everyone in the Network Convergence Laboratory for their help and open-minded discussion which inspired me to produce this work. I would like to extend my thanks to those who directly and indirectly offered me support throughout my PhD study. Finally, I am grateful to my parents for their consistent and numerous amounts of support and encouragement throughout my seven-years studies abroad in the United Kingdom.
The demand of indoor positioning solution is on the increase dramatically, and WiFi-based indoor positioning is known as a very promising approach because of the ubiquitous WiFi signals and WiFi-compatible mobile devices. Improving the positioning accuracy is the primary target of most recent works, while the excessive deployment overhead is also a challenging problem behind.
In this thesis, the author is investigating the indoor positioning problem from the aspects of indoor map information and the ubiquity of WiFi signals. This thesis proposes a set of novel WiFi positioning schemes to improve the accuracy and efficiency. Firstly, considering the access point (AP) placement is the first step to deploy indoor positioning system using WiFi, an AP placement algorithm is provided to generate the placement of APs in a given indoor environment. The AP placement algorithm utilises the floor plan information from the indoor map, in which the placement of APs is optimised to benefit the fingerprinting-based positioning. Secondly, the patterns of WiFi signals are observed and deeply analysed from sibling and spatial aspects in conjunction with pathway map from indoor map to address the problem of inconsistent WiFi signal observations. The sibling and spatial signal patterns are used to improve both positioning accuracy and efficiency. Thirdly, an AP-centred architecture is proposed by moving the positioning modules from mobile handheld to APs to facilitate the applications where mobile handheld doesn’t directly participate positioning. Meanwhile, the fingerprint technique is adopted into the AP-centred architecture to maintain comparable positioning accuracy. All the proposed works in this thesis are adequately designed, implemented and evaluated in the real-world environment and show improved performance.
Key words: indoor positioning, WiFi signal, indoor map, fingerprinting, access point, AP placement, enterprise WiFi, received signal strength, signal pattern, location-based service, deployment efficiency, energy efficiency
List of Figures xi
List of Tables xv
Symbols and Abbreviations xix
1 Introduction 1
1.1 Background . . . 1
1.2 Motivation and Objectives . . . 4
1.3 Problems and Challenges . . . 6
1.4 Contributions . . . 8
1.4.1 Map-assisted Access Point Placement for Positioning . . . 8
1.4.2 Positioning using Signal Patterns and Pathway Map . . . 8
1.4.3 AP-centred Positioning with Fingerprint Technique . . . 9
1.5 Structure of the Thesis . . . 9
2 Literature Review 12 2.1 Comparison of RF Technologies for Positioning . . . 12
2.1.1 WiFi . . . 13
2.1.2 Radio Frequency Identification . . . 13
2.1.3 Ultra-Wideband . . . 14
2.1.4 Bluetooth . . . 15
2.2 Location Estimation Approaches . . . 16
2.2.1 Range Measurement . . . 16
2.2.2 Fingerprinting . . . 19
2.2.3 Device-free Passive Positioning . . . 22
2.2.4 Channel State Information . . . 23
2.3 Improving Positioning Accuracy . . . 24
2.3.1 Optimisation of AP Placement . . . 24
2.3.2 Use of Signal Patterns . . . 26
2.3.3 Fusing with other Data Source . . . 31
2.4 Improving Deployment Efficiency . . . 33
2.4.1 Explicit Crowdsourcing . . . 33
2.4.2 Implicit Survey . . . 34
2.5 Indoor Location and Map . . . 34
2.5.1 Presentation of Indoor Location . . . 35
2.5.2 Solutions for Indoor Map . . . 37
2.6 Chapter Summary . . . 38
3 Map-assisted Access Point Placement for Positioning 40 3.1 Introduction of Indoor Map . . . 41
3.2 Data Structure of Fingerprinting Technique . . . 44
3.3 Formulation of AP Placement Problem . . . 46
3.3.1 AP Placement Optimisation Model . . . 47
3.3.2 Determining the Number of APs . . . 49
3.3.3 AP Placement Schemes . . . 50
3.4 Map-assisted AP Placement Optimisation . . . 51
3.4.1 Wall Detection Algorithm . . . 51
3.4.2 Signal Attenuation Caused by Walls . . . 55
3.4.3 AP Placement Optimisation Using PSO . . . 56
3.5 Experiments and Results . . . 57
3.5.2 Map-assisted Prediction of RSS . . . 58
3.5.3 PSO Configuration and Evaluation . . . 61
3.5.4 Results of Optimised AP Placement . . . 65
3.5.5 Effectiveness of AP Placement for Positioning . . . 66
3.6 Chapter Summary . . . 67
4 Positioning using Signal Patterns and Pathway Map 69 4.1 Analysis of WiFi Signal Observations . . . 70
4.2 Pathway Map . . . 71
4.2.1 Data Structure of Pathway Map . . . 73
4.2.2 WiFi Signals Collected on Pathway Map . . . 74
4.2.3 Instructed Site Survey . . . 76
4.3 Beacon APs Generation . . . 78
4.3.1 Beacon AP Generation Algorithm . . . 78
4.3.2 Construction of Beacon AP RSS Map . . . 82
4.4 Signal Coverage Constraint . . . 84
4.5 Positioning Schemes using Signal Patterns . . . 85
4.5.1 System Architecture . . . 85
4.5.2 Positioning Schemes . . . 87
4.6 Evaluation . . . 89
4.6.1 Experimental Setup . . . 89
4.6.2 Effectiveness of Beacon APs . . . 91
4.6.3 Effectiveness of Signal Coverage Constraint . . . 93
4.6.4 Efficiency Comparison . . . 97
4.7 Chapter Summary . . . 99
5 Access Point-centred Positioning with Fingerprint Technique 101 5.1 System Architecture and Protocols . . . 102
5.1.1 Preliminary Architecture . . . 102
5.2 Online Joint Positioning . . . 107
5.3 Evaluation . . . 109
5.3.1 Experimental Setup . . . 109
5.3.2 Effectiveness of AP-centred Architecture . . . 112
5.3.3 Efficiency of AP-centred Architecture . . . 113
5.4 Chapter Summary . . . 115
6 Conclusion and Future Work 116 6.1 Conclusion . . . 116
6.2 Future Work . . . 118
References 120
1.1 Wireless technologies for indoor positioning . . . 4
1.2 The structure of this thesis . . . 10
2.1 Illustration of triangulation, a typical geometric positioning technique based on range measurement. . . 17
2.2 Plot of Log-distance Path Loss Model. . . 18
2.3 Illustration of reference points and access points over indoor map. . . 20
2.4 Principle of fingerprinting-based positioning . . . 21
2.5 Illustration moving trajectory. . . 28
2.6 Illustration of temporal signal pattern when moving along a trajectory with different device setup. . . 29
2.7 Illustration of trajectory options at a junction and the corresponding temporal signal trend. . . 30
2.8 Illustration of presenting indoor location using grid. . . 36
2.9 Illustration of presenting indoor location using topological floor plan. . . . 37
3.1 Illustration of the indoor map generation process . . . 42
3.2 Illustration of the indoor map construction from individual rooms to com-pleted map . . . 43
3.3 Illustration of the source code of SVG file for a sample map containing 3 individual rooms . . . 43
3.4 Illustration of fingerprints ofRPiandRPj . . . 47
3.6 Illustration of the cases where two line segments that do not intersect can be determined by bounding box. . . 55 3.7 Illustration of the cases where bounding box check fails (case 5) and two
line segments intersect (case 6). . . 56 3.8 Heat map of the RSS observed in the experimental site. . . 60 3.9 Heat map of the RSS predicted by the FSPL model. . . 60 3.10 Heat map of the RSS predicted by the log-distance path loss model with wall
attenuation using different attenuation factor per wall thickness. . . 62 3.11 CDF of the difference between predicted and observed RSS (dBm) using
different attenuation factor per wall thickness. . . 63 3.12 Plots of the number of iteration in PSO to achieve convergence between
random (top) and heuristic (bottom) placement strategy. . . 64 3.13 Plots of the placement results computed by different placement schemes:
ran-dom and heuristic placement, shown in red triangles and blue dots respectively. 65 3.14 Plots of CDF of location error distance by heuristic and random scheme
using map-aided placement. . . 67 3.15 Plots of CDF of location error distance in heuristic placement using
map-aided and no map-map-aided optimisation model. . . 68
4.1 Analysis of WiFi signal observations: occupancy of 195 observed APs with different number of observations (left) and frequency band (right). . . 70 4.2 The RSS observations of VAPs operating in 2.4 GHz (top) and 5 GHz
(bottom) frequency band from the same physical AP when moving along a corridor for 25 seconds. . . 72 4.3 Illustration of pathway map. . . 73 4.4 Illustration of pathway’s nodes and its adjacency matrix representing the
connectivity between nodes. . . 74 4.5 Illustration of a path segment where the WiFi signals are collected. . . 75 4.6 Illustration of signal patterns processing from raw RSS samples observed
4.7 Illustration of Beacon APs Map at RPs on Path Segments. . . 83
4.8 RSS of different Beacon AP at RPs along path segments. . . 83
4.9 Illustration of mapping Beacon APs to reference points based on the signals collected at our experimental site. . . 85
4.10 Illustration of mapping Beacon APs to pathway map based on the signals collected at our experimental site. . . 86
4.11 System architecture of positioning using temporal signal patterns . . . 87
4.12 Illustration of implementation on Android app. . . 90
4.13 CDF of location error distance using different device setups. . . 92
4.14 CDF of location error distance in different usage scenarios. . . 92
4.15 Relationship between location error distance and number of Beacon APs generated in robust searching scheme. . . 93
4.16 Relationship between location error distance and number of APs observed in robust searching scheme. . . 94
4.17 CDF of location error distance using different SCC ratio in selective search-ing scheme. . . 95
4.18 CDF of number of candidate RPs using different SCC ratio in selective searching scheme. . . 95
4.19 CDF of number of APs used for similarity calculation of positioning using different SCC ratio in selective searching scheme. . . 96
4.20 CDF of number of APs used for similarity calculation of positioning using different SCC ratio in selective searching scheme excluding the cases when no location can be found. . . 96
4.21 Relationship between location error distance and number of APs used for positioning in selective searching scheme when SCC ratio is 60%. . . 97
4.22 Plot of bar chart showing the number of APs of raw APs detected and Beacon APs generated at some of path segments in the experimental site in offline site survey. . . 98
5.1 Architecture of proposed system . . . 103
5.2 Sequence diagram of proposed system . . . 104
5.3 Format of the data from AP to JPS . . . 105
5.4 Enhanced architecture of proposed system . . . 108
5.5 The Fingerprint Collector app running on the survey MH (left) and the location of reference points selected in the experiment (right) . . . 111
5.6 The Web UI displaying the location of multiple MHs (left) and console to check the RSS of each individual MH (right) . . . 112
5.7 Comparision of CDF between AP-centred and MH-based system . . . 113
5.8 Location error distance at each evaluation point by AP-centred and MH-based system . . . 114 5.9 Overall energy consumption on MH in MH-based and AP-centred systems . 115
2.1 Comparison of RF technologies used for indoor positioning . . . 16
3.1 Database structure of table that stores the information on indoor map . . . . 44 3.2 Constant parameters of the experiment . . . 59
4.1 Part Of The Notations. . . 75 4.2 Device Setups . . . 91
Roman Symbols
Si RSS values observed fromei
Ti Observation timestamps fromei
d0 Reference distance in log-distance path loss model
e A path segment
G Pathway map
L0 RSS at reference distance in log-distance path loss model
M Number of APs selected as beacons for positioning
N Number of RPs in the interesting area
n Path-loss exponent in log-distance path loss model
Greek Symbols
β Signal’s angle of arrival relative to wall
λ Inertia weight of existing velocity in PSO
µ Scaling factor in heuristic placement scheme
φ0 Real-time vector of RSS at unknown location
φi Vector of RSS of pre-selected APs atRPi
Ψ Radio map consisting of RSS of all APs at all RPs
ψk,i RSS ofAPkatRPi
ρ Coverage overlap ratio
ϕ Signal strength attenuation caused by walls
Acronyms / Abbreviations
AOA Angle Of Arrival
AP Access Point
API Application Programming Interface
AR Acoustic Ranging
BSSID Basic Service Set Identifier
CDF Cumulative Distribution Function
CSI Channel State Information
FP Fingerprint
GPS Global Positioning System
IMU Inertial Measurement Unit
IoT Internet of Things
JPS Joint Positioning Server
LBS Location-based Services
LoS Line-of-Sight
MAC Media Access Control
MH Mobile Handheld
NIC Network Interface Card
OFDM Orthogonal Frequency-Division Multiplexing
PoI Point of Interest
PSO Particle Swarm Optimisation
PST Path Segments Traversal
QoE Quality of Experience
RF Radio Frequency
RFID Radio Frequency Identification
RP Reference Point
RSS Received Signal Strength
RTOF Round-trip Time Of Flight
SCC Signal Coverage Constraint
SNR Signal-to-Noise Ratio
SSID Service Set Identifier
SSP Sibling Signal Patterns
TDOA Time Difference Of Arrival
TSP Temporal Signal Pattern
UI User Interface
UWB Ultra-Wideband
VAP Virtual Access Point
Introduction
In a wide range of systems with context-aware computing, including the Internet of Things (IoT), wireless sensor networks, mobile social networks and mobile peer-to-peer computing, the indoor location is one of the essential contexts. The enabling technology for them is an accurate and reliable indoor positioning solution. Indoor positioning attracted many research efforts from both academia and industry in the past decade, and it has been well studied from various aspects.
In this chapter, the background knowledge of indoor positioning is briefly introduced, including the use cases (i.e., application scenarios), technologies which can be used for indoor positioning and the positioning techniques based on different technologies. Then the ubiquity of WiFi signals and importance of indoor map are highlighted, which motivated this research work. Next, the problems and challenges of indoor positioning are discussed from the aspects of insufficient positioning accuracy and inefficient system deployment. Finally, the contributions of this thesis towards map-assisted indoor positioning utilising ubiquitous WiFi signals are identified.
1.1
Background
The services based on the context of location information are called location-based services (LBS) and the key enabling technology of LBS is location sensing or positioning (i.e., the
solution to estimate the location of an object or person in a room, building or in the world) [1]. Based on the fact that human beings spend 90% of their time indoors, with the advance of mobile devices and great impact of mobile applications (apps) over mobile phones, the LBS for indoor environments is highly desired. However, the very mature satellite-based positioning technology such as Global Positioning System (GPS) cannot work indoors since the signals from the satellite cannot penetrate well in the indoor environment (i.e., GPS need direct visibility to satellite) and the positioning accuracy of GPS is not refined enough for indoor scenarios [2]. As a result, an accurate and reliable indoor positioning solution is so desired to fill the shortage of GPS and is expected to provide the same functionality as the GPS (i.e., provide the location of an object device in real time) [3].
Nowadays with the surge of the IoT systems and its broad applications in real life, the indoor location is an important context to achieve various services. The primary function of positioning is to find a steady location of a stationary or moving device, which is used in the applications requiring one-off location information, such as mobile social networking or location-targeted advertisement. Meanwhile tracking a mobile device instead of obtaining a device’s steady location is also on demand [4]. Tracking is a continuous process of computing a sequence of locations, rather than repeatedly locating the single steady location. Indoor location tracking is a sub-category of indoor positioning and requires typically higher positioning accuracy [4, 5].
The application scenarios of indoor positioning can be summarised as follows.
• Indoor Navigation for visitors in the large-scale indoor environment, e.g. shopping mall, exhibition centre and even car park [6, 7].
• Smart Home and Ambient Assisted Living, e.g. location-based automated heating or lighting control [8].
• Context Awareness Services, e.g. location-based social networking.
• Retail Industry, e.g. mobility analysis of customers and targeted retail advertisement in shopping malls.
In the last decade, indoor LBS has attracted much research efforts from both academia and industry [10]. Recent years have seen the emergence of various solutions for indoor positioning using different technologies and techniques. The technologies range from Radio Frequency (RF) signals such as WiFi [11], Bluetooth [12], UWB (Ultra-Wide Band) [13] and RFID (Radio-Frequency Identification) [14–16] to IMU (Inertial Measurement Unit) [17][18], sound [19, 20], visible light [21][22] and magnetic field [23][24], as shown in Fig. 1.1. Meanwhile, many hybrid solutions using multiple technologies are proposed [25]. The inertial sensors are commonly used with other technologies to provide prediction or correction.
There are various positioning techniques used for indoor location estimation. The widely used approaches can be classified into two categories: range measurement and
fingerprinting [26]. Range measurement techniques obtain the distance between object
device and reference beacons (i.e., devices deployed as the infrastructure of positioning system) based on the propagation model, such as distance to time of flight model or distance to signal strength loss model. The location of object device can be worked out using the measured distance to multiple reference beacons whose locations are known. Fingerprinting technique consists of two stages: offline site survey and online positioning, as illustrated in Fig. 2.4. Fingerprinting is a common positioning technique used by most received signal strength (RSS)-based positioning systems. RSS is the measurement of the power observed in a radio signal received. The fingerprint is defined as an RSS vector from multiple signal transmitters and collected at a location in site survey phase. Successively, the fingerprints at multiple pre-selected locations are collected to construct the fingerprint database. In the positioning phase, given an RSS vector observed at an unknown location, which is compared with the fingerprints in the fingerprint database, the associated location of the best-matched fingerprint is estimated as the location of the observed RSS vector [27–29]. The more detailed description of WiFi-based positioning and approaches to estimating indoor location are provided in Chapter 2.
1.2
Motivation and Objectives
Among existing technologies, the use of WiFi is a popular approach to bring indoor posi-tioning into practice, because WiFi access points (AP) are already deployed extensively in most public places like hospital and shopping mall and most off-the-shelf mobile devices are already equipped with WiFi communication modules [30, 31]. In the WiFi-based positioning, the APs act as the natural beacons for positioning and the off-the-shelf mobile devices are the targeted positioning object. The wide deployment of WiFi infrastructure and the ubiquity of WiFi-integrated mobile devices have provided a massive opportunity for indoor LBS.
Fig. 1.1 Wireless technologies for indoor positioning
The positioning systems and LBS need to clarify the following questions: how to express locations, how to obtain a location and then how to display a location in the user interface (UI). For the outdoor environment, location can be expressed by latitude and longitude of the geographic coordinate system and map platforms such as Google Map and Open Street Map can provide mature graphical presentation interface and sufficient geographic data to indicate the required outdoor locations [32–34]. While for the multiple-storey indoor space, neither the geographic coordinate system nor graphical map platform exists. Thus, an appropriate setup of indoor coordinate system and presentation of the indoor environment, e.g. indoor location and indoor map, are essential for indoor positioning systems.
We believe the indoor map will become pervasive and will be a crucial component to bring indoor positioning into practice. Firstly, the widely-used Google Map was just launched in 2005 to provide the mapping of the outdoor environment, and nowadays almost all the location-based services are based on Google Map or similar platforms [32]. With the development of the Internet of Things, Smart Cities, Ambient Assisted Living and so on, the indoor location information is becoming an important context and mapping of indoor space is on demand [4, 8, 9]. Therefore, we believe the indoor map will be developed promptly, and a giant platform like Google Map but for the indoor environment may appear very soon. Some indoor map systems have been available in the market, but the functionality is still limited. Secondly, in the last decade, researchers proposed many indoor positioning solutions by obtaining and fusing various data, including different RF signals, the inertial sensor, acoustic data, vision data and indoor map. Among those data, apart from the indoor map the availability and quality of them are dependent on the positioning technology. However, the indoor map is always available and can work with any positioning technology [27]. Thirdly, to support tracking or navigation services, the map is an essential prerequisite and has been commonly used in outdoor in-car navigation [35].
Thus, the ubiquity of WiFi and the critical role of the indoor map for indoor positioning motivate this thesis to investigate the indoor positioning problem through the usage of the ubiquitous WiFi signals and information from the indoor map. The objective of this thesis is to improve the positioning accuracy and deployment efficiency of indoor positioning system from three aspects, which is summarised as follows.
1. Investigate the data structure to describe the information available in the indoor envi-ronment and the approach to implement it as an indoor map.
2. Investigate the ubiquitous WiFi signals and its opportunities to improve the perfor-mance of indoor positioning, especially in conjunction with information obtained from the indoor map.
3. Investigate the role access point plays in WiFi-based indoor positioning and its oppor-tunities to assist positioning.
1.3
Problems and Challenges
The essential and inevitable problem for indoor positioning is the complex indoor environ-ment, characterised by non-line-of-sight (LoS) and signal fluctuation caused by dynamic environmental changes such as people and furniture. For positioning system based on range measurement, to predict the distance between reference beacon and target device accurately, the essential condition is modelling the radio propagation correctly. However, it is very difficult to model the signal propagation in the indoor environment due to a variety of inter-ference. Most importantly, the low availability of LoS path is one critical obstacle, which makes it difficult to find a LoS channel between the signal transmitter and receiver. The reason why GPS performs poorly indoors is also the missing LoS between the mobile device and the satellites. Due to non-line-of-sight in the indoor environment, fingerprinting becomes a popular technique for positioning by using RSS of WiFi signals. However, because of the reflecting surface in indoor space, the signal is affected by the multi-path fading and shows significant fluctuation, which leads to inconsistent RSS observation and eventually mismatched fingerprint, so that the accuracy of positioning is decreased directly [36–39]. Despite such complex indoor environment, highly accurate indoor location information is still highly expected to be provided by indoor positioning solutions.
In the existing fingerprint-based positioning systems using WiFi, some of them can achieve location error of fewer than two meters. This level of accuracy is sufficient to identify a room-level location and can satisfy most indoor positioning scenarios that don’t require higher granularity of location information [30, 40, 41]. However, along with accuracy, another significant problem behind is deployment overhead. For fingerprint-based positioning system, no matter whatever method is used to estimate location, the site survey to create radio map is inevitable. The technique that most systems adopt is the explicit and designated offline manual survey, in which every accessible location of the interesting area needs to be surveyed by manpower before the online positioning work. For example, the COMPASS [42] system need spend more than 4 hours to survey a small building floor of 125 m2. Another problem with the offline survey is that the site survey work needs to be repeated fully or partially when there are environmental changes, such as removal or adding of AP. Thus, the
fingerprint-based system need manually profiling the space, which typically is exceptionally time-consuming, labour-intensive and intrusive.
Moreover, the energy consumption is also a major concern. While the positioning modules running on mobile devices often require fast WiFi scanning and computation-intensive processing, the computing resources and battery capacity of mobile devices are quite limited, which leads to a significant drain of battery in short time. For fingerprint-based positioning, typically the fingerprint database contains a large number of RSS data, and a sophisticated algorithm is utilised to improve positioning accuracy, which makes the energy consumption problem even worse. To reduce the energy consumption of mobile device some server-based positioning systems are proposed by offloading the computation-intensive of positioning to a remote server, but the data communication between mobile device and server can still cause energy consumption [43]. Also, the network connection to server needs to be considered to prevent the downtime of positioning service [44].
Therefore, the latest challenge is how to exploit the synergy of existing technologies to improve the accuracy and optimise the deployment process to be more efficient, rather than developing new technology for indoor positioning [45–48]. The problems and challenges can be summarised as follows.
• Insufficient positioning accuracy caused by
– Signal fluctuation caused by multi-path fading and shadowing
– Dynamic changes of complex indoor environment
– Heterogeneous mobile devices of users
• Inefficient system deployment including
– Time-consuming and laborious site survey
– Complex follow-up works to calibrate radio map
1.4
Contributions
In this thesis, the contributions of indoor positioning are provided in three directions (i.e., AP placement algorithm, positioning using signal patterns and AP-centred architecture) to improve the positioning accuracy and system efficiency. An indoor map system is proposed to provide the information that can be utilised to assist indoor positioning. The main contributions are summarised in detail as follows.
1.4.1
Map-assisted Access Point Placement for Positioning
This thesis presents an indoor map system that provides a geographic coordinate system and graphic presentation, where the detailed map information such as walls can be explicitly expressed. The author studies the problem of optimising the AP placement to achieve better performance for fingerprint-based positioning, in which the walls in the indoor map are used to assist the AP placement algorithm. In this work, AP placement is formulated into an optimisation problem in which the sum of the Euclidean distance of fingerprints among all the reference points is maximised. The fingerprint at each reference point is predicted by an indoor radio propagation model which considers the attenuation of walls with the assistance from our indoor map. The optimisation problem is solved by Particle Swarm Optimisation (PSO). The effectiveness and efficiency of the proposed AP placement algorithm are measured via the accuracy of positioning in the real-world positioning system, where k-nearest neighbours (KNN) is adopted as the positioning algorithm. The experimental results show that our map-assisted AP placement can provide higher positioning accuracy.
1.4.2
Positioning using Signal Patterns and Pathway Map
To identify the opportunity for indoor positioning using ubiquitous WiFi signals, the WiFi signals under modern enterprise WiFi infrastructure are analysed firstly. Then the signal patterns between coexisting access points and signals’ correlation with indoor pathway map are investigated to address the problem of inconsistent WiFi signal observations. The sibling signal patterns (SSP) are defined for the first time and processed to generate Beacon
APs which have higher confidence in positioning. The spatial signal patterns are used to bring the estimated location into a limited area through signal coverage constraint (SCC). The positioning schemes using Beacon APs and SCC are proposed and shows improved positioning accuracy. The proposed schemes are adequately designed, implemented and evaluated in a real-world environment, revealing its effectiveness and efficiency.
1.4.3
AP-centred Positioning with Fingerprint Technique
An AP-centred indoor positioning system is proposed to address some common concerns in the conventional MH (Mobile Handheld)-based positioning system, such as passive positioning and excessive involvement of MH, in particular for scenarios of positioning multiple MHs simultaneously. Meanwhile, the popularly-used fingerprint technique is combined into the AP-centred architecture to achieve higher positioning accuracy. The proposed system is entirely designed, implemented and tested in a real-world deployment. In the environment covered by the APs running the proposed system, the location of the WiFi-enabled MHs appearing in this environment can be computed by a positioning server without disturbing MHs. The accuracy of positioning result obtained from the AP-centred positioning system is evaluated in comparison with a traditional MH-based system in the real experiments. The proposed AP-centred system shows not only the feasibility of AP-centred positioning but also better performance on positioning accuracy and energy consumption of MH.
1.5
Structure of the Thesis
The rest of this thesis is organised as follows. Fig. 1.2 shows the structure of this thesis. In Chapter 2, a detailed survey on WiFi-based indoor positioning is performed. It first discusses the RF technologies which are similar to WiFi and used for indoor positioning. Next, the approaches to estimate locations in the indoor environment, especially the fingerprinting technique are reviewed, followed by the related works from peers to solve the problems of
A
cce
ss
P
oi
nt
A
cce
ss
P
oi
nt
Ma
p-assi
st
ed
In
do
or
P
osi
tio
ni
ng
U
til
izi
ng
U
bi
qu
ito
us
WiFi
Si
gnal
s
Indoor
M
ap
Si
gnal
Patter
n
A
cce
ss
P
oi
nt
Ma
p-assi
st
ed
A
cce
ss
P
oi
nt
P
la
ce
m
en
t f
or
P
osi
tio
ni
ng
P
osi
tio
ni
ng
u
si
ng
S
ig
na
l P
at
te
rn
s
an
d
P
at
hw
ay
M
ap
A
cce
ss
P
oi
nt
-ce
nt
re
d
P
osi
tio
ni
ng
with
Fin
ge
rp
rin
t
Te
ch
ni
qu
e
Indoor
M
ap
Ch
ap
te
r 3
Ch
ap
te
r 4
Ch
ap
te
r 5
In
tr
od
uct
io
n
&
L
ite
ra
tu
re
R
evi
ew
C
on
cl
usi
on
&
F
ut
ur
e
W
or
k
Ch
ap
te
r
1&2
Ch
ap
te
r 6
Fig. 1.2 The structure of this thesisinsufficient accuracy and inefficient deployment. Finally, the existing approaches to express indoor location and map for indoor positioning are presented.
In Chapter 3, a map-assisted AP placement algorithm is presented, which considers the signal attenuation caused by walls in the indoor environment. An indoor map system adopting vector graphic technology is first introduced. Then an optimisation model for AP placement in fingerprint-based indoor positioning system is presented, where the wall information of the indoor map is utilised thoroughly. A kNN-based positioning system has verified the effectiveness of it in experiments and the accuracy has been analysed.
In Chapter 4, the WiFi signals under modern enterprise WiFi infrastructure, signal patterns between coexisting access points and signals’ correlation with indoor pathway map are investigated to address the problem of inconsistent WiFi signal observations. Some positioning scheme using the signal patterns are proposed and shows improved positioning accuracy. The proposed scheme is fully designed, implemented and evaluated in a real-world environment, revealing its effectiveness and efficiency
In Chapter 5, an AP-based indoor positioning architecture with fingerprint technique is proposed, which can infer mobile device’s location without having to install any additional software on the mobile device. To achieve passive positioning, the whole positioning service (RSS scan and location estimation) moves from mobile phone to a remote cloud, which relieves the mobile device’s participation in the positioning process.
In Chapter 6, the achievements of the thesis are summarised, and some future research directions are identified.
Literature Review
Indoor positioning is a well-known problem and attracts a lot of research efforts in the last decade. The literature review of this thesis mainly focuses on RF technologies similar to WiFi that enable indoor positioning, the approaches to estimate locations in an indoor environment, especially the fingerprinting technique, various solutions to improve positioning accuracy and deployment efficiency, and indoor location and map used for the indoor positioning system.
2.1
Comparison of RF Technologies for Positioning
The indoor positioning system is typically consisting of location-known beacons and mobile target devices. The beacons and target devices are communicating with each other using a specific type of wireless technology to determine the distance between them. Radio Frequency (RF) is the frequency that the radio signals are carried and transmitted from the antenna. In this work only RF technologies are considered and these existing technologies include WiFi [11], Bluetooth [12], Ultra-Wide Band (UWB) [13] and radio-frequency identification (RFID) [14] and etc. [30, 49]. The features and peers’ work of these conventional RF technologies used for indoor positioning are discussed as follows.
2.1.1
WiFi
In recent years the wireless local area networks (WLAN) have been deployed in the most indoor environment especially the public areas, such as universities, hospitals, airport, etc. Currently, WiFi (IEEE 802.11) has been the representative technology for WLAN. In addition to broadband data transmission, WiFi networks also provide a good alternative to indoor positioning beacons. The WiFi’s key advantage over other wireless technologies is that the existing WiFi infrastructure and WiFi-enabled devices like smartphones can be reused for positioning directly, which therefore makes the hardware cost for positioning zero. The received signal strength of WiFi acts as a common metric for channel quality and is widely used to infer propagation distance. Most WiFi-based positioning systems use the RSS as the metric to estimate location.
There have been numerous WiFi-based positioning systems and the accuracy of them is approximately 1 to 5 meters. RADAR [11] is an earlier famous system using WiFi for indoor positioning and achieved around 2.37-2.65 meters in 50 percentile and 5.93-5.97 meters in 90 percentile. Youssef [50] using probabilistic method acquires the accuracy of more than 90% to within 2.1 meters, and some other systems revealed that neural networks technique could increase the accuracy to 1 meter with 72% probability. Because of the popularity of WiFi devices and the ubiquitous deployment of WiFi networks, people are continuously attempting to make use of the WiFi signals to achieve indoor positioning. The WiFi signals also suffer from multi-path fading. In addition, the various WiFi chips equipped with mobile devices lead to the problem of device heterogeneity.
2.1.2
Radio Frequency Identification
The radio frequency identification (RFID) is a means of storing and retrieving data through the electromagnetic transmission to an RF compatible integrated circuit. An RFID system consists of RFID readers and RFID tags. The RFID reader can read data emitted from RFID tags. RFID readers and tags use a defined radio frequency and protocol to transmit and receive data. The coverage range of RFID signal could be up to 50 meters and even
hundreds of meters with special antenna [31]. In the indoor positioning systems using RFID technology, the RFID tag is attached to the target object, and the RFID readers are mounted on the ceiling with known locations. The RFID reader can measure the distance to the object by analysing the radio signal strength information [51].
A system called LANDMARC [15] is a prototype indoor location sensing system using RFID technology, and it could achieve the accuracy of 1 meter in average and 2 meters in the worst case. The LANDMARC reveals that the non-line-of-sight nature of RFID is a significant advantage and the radio transmission range is enough for indoor positioning. However, there is a tradeoff between the accuracy and the density of reference tags. The installation and maintenance of numerous infrastructure components in the positioning area are time-consuming and not cost-effective. As a result, whether RFID can be used as the enabling technology depends on the application scenarios and accuracy requirement.
2.1.3
Ultra-Wideband
Ultra-Wideband (UWB) is a kind of radio technology in which the pulses are ultra-short (typically one ns). UWB transmits a signal over multiple bands of frequencies simultaneously, from 3.1 to 10.6 GHz [31]. The short duration pulses are easy to be distinguished from the reflected signals caused by the multi-path effect. The multi-path distortion of radio signals in the indoor environment is the major obstacle of the positioning systems using conventional radio signals. UWB technology improves the positioning accuracy significantly by overcoming multi-path propagation. Furthermore, because of high penetration ability of UWB, the accuracy of the UWB-based positioning system could achieve about tens of centimetres.
Ubisense is an indoor positioning system based on UWB technology to estimate the location using triangulation technique. Thetime difference of arrival(TDOA) andangle of
arrival(AOA) techniques are employed to compute distance by measuring the difference in
arrival times and signal angles. In the Ubisense system, there are networked sensors fixed in the known locations and moving tags that transmit UWB signals to the fixed sensors. The data detected by the multiple sensors is gathered to a central server to estimate the location
of the moving tag. The sensors in Ubisense are deployed as cells with at least four sensors in each cell, and all the sensors throughout buildings can be networked together in a manner similar to cellular phone networks so that the coverage range and scalability are not problems.
2.1.4
Bluetooth
Bluetooth is a short-range (typically 10-15 m) wireless technology that was developed to provide low-cost and low-bandwidth communication scenarios [12]. Bluetooth has been widely used in various types of devices like mobile phone, laptops, media players etc. and Bluetooth chipsets are low cost. Thus Bluetooth has a great market potential for indoor positioning. In Bluetooth based positioning system, the Bluetooth tags are required to be deployed in the positioning area as the positioning infrastructure. The earlier Bluetooth-based positioning systems using old Bluetooth standard (before version 2.1), such as Topaz [31], need to spend around 20 seconds to discover the RSS due to the time-consuming pre-connection, which makes it impossible for real-time positioning. The latest Bluetooth-integrated devices such as Android smartphones could provide Application Programming Interface (API) to access Bluetooth resources and most of today’s Bluetooth chipsets have been equipped with the new Bluetooth standard that can provide RSS reading easily and quickly. Another feature of Bluetooth chip is the low power consumption, which is a significant advantage for the battery-limited systems.
2.1.5
Summary of Comparison
The comparison of these RF technologies from several different aspects is illustrated in Table 2.1. Among these RF technologies, WiFi is the most promising option for generic indoor positioning which is easy to deploy, low cost and could provide sufficient accuracy for most application scenarios. The existing WiFi access points (APs) can be used as positioning beacons, and commodity smartphones are the targeted mobile devices, so dedicated hardware is not required for the positioning purpose.
Table 2.1 Comparison of RF technologies used for indoor positioning Coverage Cost Deployment Accuracy RFID Moderate Moderate Hard 1-2 m UWB Short Expensive Hard tens of centimeters Bluetooth Short Low Moderate 1-3 m WiFi Moderate Low Easy 1-5 m
2.2
Location Estimation Approaches
The location estimation approaches and its fundamental principles are presented in this section for readers to understand the problems of the field. The widely used approaches for WiFi-based positioning can be classified into two categories, range measurement and fingerprinting[26]. Both methods are facing numerous challenges to achieve their expected performance for indoor positioning [41]. In the two approaches mentioned above, they require the targeted device to participate in the positioning work. There are also some other positioning approaches without the involvement of targeted device, which is named device-free passive positioning and introduced afterwards.
In the WiFi-based indoor positioning, RSS is widely used in the last decades, because RSS reflects the distance between transmitter and receiver. The RSS is also easy to obtain in most mobile devices by calling the API of the operating system. However, in typical indoor environments, wireless signals often propagate via multiple paths in a dynamic environment, which leads to unpredictable and inconsistent RSS measurements. Thus, the accuracy of RSS-based positioning is decreased mainly because of RSS fluctuation. Channel state information (CSI) is an emerging technique to replace RSS information, which is also introduced in the follows. CSI can work with either range measurement or fingerprinting technique.
2.2.1
Range Measurement
Range measurement techniques are used to obtain the distance based on the propagation model. Therefore range measurement techniques are also known as modelling-based ap-proaches. A propagation model is used to describe the characteristics of radio propagation in the indoor environment. The different propagation models can be used to describe the
relationship between different propagation properties, such as the relationship between propagation distance and signal strength loss, propagation distance and propagation time, etc..
Based on range measurements a traditional technique to estimate the location is triangula-tion, which uses the geometric properties of triangles to estimate the location of an object by measuring its distances from multiple reference points (RPs) [52]. In triangulation method, with at least three reference points, the location of the object in a two-dimensional environ-ment will be able to be estimated through calculating the intersection of the ranges between the object and each reference points, as shown in Fig. 2.1. The position of the reference points must be known prior to the positioning process, and the location information must contain physical coordinates, rather than just semantic information, such as room number or name. In the positioning approaches based on range measurements, the positioning accuracy depends on the measurement precision directly.
Fig. 2.1 Illustration of triangulation, a typical geometric positioning technique based on range measurement.
2.2.1.1 Propagation Loss Model
Propagation loss model is a conventional model used to measure the distance using received signal strength (RSS), which can be called path loss model as well [53, 54]. The signal propagation loss models can be theoretical or empirical to estimate the propagation distance
by measuring the difference of received signal strengths in the propagation path. The Fig. 2.2 illustrates the log-distance path loss model, which is an empirical model to predict the path loss of a signal and has empirical coefficient parameters. The empirical coefficient values are depending on the frequency of signal and transmission environment. The meaning of the parameters shown in Fig. 2.2 is introduced in Eq. (3.11) in Section 3.3.1. The theoretical model tends to be more flexible than the empirical model. The model is constructed based on the fact that wireless signals travelling through a certain environment undergo specific types of signal loss, which can be modelled using well-known radio propagation and path loss theories to build up the relationship with propagation distance. Path loss model suffers from similar problems as propagation time model, and multi-path fading and shadowing are the major issues for it [55]. The best-known systems using range measurement technique based on propagation loss model can achieve a median accuracy of around 2-4 meters [11, 56]. These systems are easy to deploy because RSS values are easily available on most mobile devices.
0 5 10 15 20 25 30
Length of the Path (meter) -100 -80 -60 -40 -20 0 RSS (dBm) L0 = -28; n = 2.2 L0 = -28; n = 2.7 L0 = -40; n = 3.2 L0 = -40; n = 3.7
2.2.1.2 Propagation Time Model
Propagation time model describes the radio propagation characteristic that the propagation distance is directly proportional to the propagation time. There are numerous techniques based on propagation time model to measure the distance between the object and reference points. Time of arrival (TOA) is one straightforward method based on propagation time model to estimate the propagation distance, which can be computed by multiplying the radio signal velocity and time of flight. To measure the one-way propagation time, the positioning system must meet a necessary condition that all distributed transmitters and receivers need to be precisely synchronised and timestamp must be labelled with the signal sent from the transmitter. Round-trip time of flight (RTOF) works in a similar way like TOA, which also uses absolute travel time to calculate distance. The signal transmitter acts as the signal receiver to measure the round-trip travel time of the signal, and the receiver in TOA becomes a transporter to send the signal back to the transmitter. In the RTOF method, the delay caused by transporter is the major problem that leads to incorrect measurements. Time difference of arrival (TDOA) is to measure the difference in time when the multiple receivers received the signal from the transmitter, in which the multiple receivers (measuring units) share a synchronised time but the signal transmitter (target object) doesn’t need to participate any synchronisation process with receivers. TDOA also brings another benefit that the signal propagation noise and delay can be taken into computing. The best-known systems using propagation time model achieve a median accuracy of 2 meters. However, these methods usually need hardware/firmware modification and time synchronisation in commodity WiFi infrastructure.
2.2.2
Fingerprinting
Fingerprinting is a significant positioning technique used by most RSS-based positioning systems. Fingerprint-based positioning system consists of two stages: offline site survey and online positioning, as illustrated in Fig. 2.4.
It is a common practice that some locations in the interesting area are chosen as reference points (RPs) in the site survey stage, as the illustration in Fig. 2.3. The granularity of the reference points usually is about one to two meters. For example in the system using WiFi, the site survey is conducted by the WiFi-compatible mobile device to collect the WiFi fingerprint at every reference point in the interesting area. The fingerprint is defined as a record of received signal strength (e.g., a set of RSS from surrounding reachable APs, which is also named RSS vectors) collected at a reference point. The fingerprints obtained at all the reference points constitute a fingerprint database of this area to serve the positioning process.
Reference Point (RP) Access Point (AP)
In the positioning stage, the real-time RSS of surrounding WiFi signals received by a user with a WiFi-compatible device is compared with the records in the pre-collected fingerprint database to find the best-matched fingerprint, which is conducted by the major positioning algorithm. The corresponding location information of the best-matched fingerprint is returned to user as the positioning result [27–29][30].
Fig. 2.4 Principle of fingerprinting-based positioning
Fingerprint-based positioning is also named pattern matching-based approach or scene analysis approach [57]. The primary reason to present the idea of the fingerprint is that the severe multi-path effect of radio propagation suffered by modelling-based positioning approaches. In fingerprinting-based positioning, the multi-path characteristics in different indoor locations are considered as the unique pattern to each location, so that the problems caused by multi-path propagation in conventional modelling-based positioning are avoided and become as a unique metric to distinguish different locations. Meanwhile, it brings another benefit that the location of the reference points are not necessary to be known because it is not based on range measurements to estimate location. The best-known systems using fingerprinting technique can provide around 0.6 meters of median accuracy [45, 58].
However, there are also several disadvantages of fingerprinting technique. First and foremost, employing the fingerprinting technique means the system need to conduct the
offline site survey to build up the fingerprint database, which is time-consuming and labour-intensive. To avoid the decrease of accuracy due to the environmental changes, regular updates (i.e., repeat or partially redo the site survey) are required to adapt to the changes, so that the system can maintain the up to date fingerprint database. In addition, with the rapid evolution of mobile devices, the device heterogeneity is another significant issue need to be addressed, which can affect the performance of indoor positioning largely. Finally, because fingerprinting techniques typically require frequent WiFi scan and complex fingerprint matching algorithm, the battery energy of mobile device is a concern as well and will be more outstanding when the system is vastly deployed in mobile devices.
2.2.3
Device-free Passive Positioning
A physical device attached to the person is typically the targeted device of positioning and usually required to participate actively in the positioning process. Thus, several works are proposed to enable detecting, tracking and identifying entities without requiring any attached devices and active participation in positioning. The work in [59] utilises the installed wireless data networks (i.e., WiFi networks) to detect the changes in the environment and hence identify the location of entities passively. Their work relies on the fact that RF signals are affected by changes in the environment, such as people and furniture. When the signals are sent with the same power every time, the temporal variability of the signal remains the same. Because of multi-path effect, the signals’ RSS measurement or time of flight can be varied if there is obstacle sitting between the transmitter and receiver. The entities such as people can easily affect the signal at the 2.4GHz frequency range. In their work, the APs and monitoring stations (i.e., any device capable of receiving WiFi signal) are deployed to continuously monitor and process the changes of RSS measurements, which are then used to detect the changes in the environment and analyse the correlation to the locations of entities. Their experiment is conducted in a testbed consisting of APs and monitoring stations running 802.11b protocol at the 2.4GHz frequency. APs broadcast beacons every 100ms and RSS value can be extracted from the header of the link-layer frame (MAC layer). Their results show that the system can detect the appearance of entities correctly in 100% probability and
identify the location of entities with more than 86% accuracy, which establishes the proof of the feasibility of device-free passive positioning.
2.2.4
Channel State Information
RSS is only a single-value MAC layer information offered by the wireless network adaptor. RSS value is a packet-level estimator, i.e., the average value of the signal power over a packet, which is easily varied by multipath. Thus, recent efforts have dived into the PHY (Physical) layer to obtain richer information which can represent the multi-path propagation. The OFDM (Orthogonal frequency-division multiplexing) system is commonly used in the physical layer of today’s WLAN (i.e., IEEE 802.11 a/g/n) to provide high throughput. In OFDM a channel is orthogonally divided into multiple sub channels, namely subcarriers. The data is modulated and transmitted in parallel on multiple subcarriers at different frequencies. The OFDM system offers channel measurement at the subcarrier level, which is called channel state information (CSI) [60]. CSI is a fine-grained metric full of frequency domain information, which describes how a signal propagates from the transmitter to the receiver and reveals the effect of multipath [61–63]. Thus, compared with RSS, more robust and reliable signal features can be extracted from CSI.
FILA [64] explores the fine-grained CSI measurements by processing the CSI of multiple subcarriers in a single packet. A refined radio propagation model using processed CSI information is proposed to compute the distance between AP and target device, then the simplest trilateration method is used to obtain the location. FILA achieves up to 10 times accuracy gain over the corresponding RSS-based propagation model. Meanwhile, FILA also introduces a CSI-based fingerprinting approach, which uses the frequency diversity attribute of CSI to manifest a location uniquely. Their evaluation shows the CSI-based fingerprinting can achieve the median accuracy of 0.65 m, which outperforms the similar RSS-based approach by about 0.2 m.
SpotFi [65] provides a positioning service using commercial off-the-shelf WiFi NICs (Network Interface Cards) with three antennas, which achieves a comparable accuracy to the systems with large antenna arrays which are not available in commodity WiFi infrastructure.
The key technique of SpotFi is super-resolution algorithm to compute the angle of arrival (AoA) of the package through the CSI measurements, which forms a sensor matrix from 30 OFDM subcarriers and 3 antennas. The AoA and RSS measurement from different APs are combined together to estimate the location of the targeted device through triangulation.
2.3
Improving Positioning Accuracy
In this section, the solutions to improve the positioning accuracy in state of the art are introduced. Most of the solutions are proposed explicitly for the positioning system using WiFi technology and fingerprint technique. The improvements can be achieved from different aspects, including the AP placement, usage of signal patterns and assistance from other signals.
2.3.1
Optimisation of AP Placement
The WiFi APs are used as the beacons for WiFi-compatible mobile devices to work out their locations. The accuracy of indoor positioning using WiFi can be substantially enhanced by appropriate AP placement strategies, i.e., in a given indoor environment to deploy the APs at the locations where the mobile devices can work out their location more precisely.
The majority of the work addresses the AP placement problem from the angle of providing data services, namely, how to place APs to increase the WLAN performance [66]. Issues concerned here consist of reducing interference, increasing coverage and data rate and eventually providing better QoE (quality of experience) to end users [67–73]. However, in the WiFi-based indoor positioning, its performance can be affected by AP deployment, so that the AP placement problem can also be studied for improving the performance of indoor positioning [74][75]. Therefore, the following discussions focus on this angle.
The fingerprint at each RP is stored in a database at the site survey stage. Then at the positioning stage, the fingerprint records in the database are compared with the real-time RSS vector to compute the location of a mobile device. As a result, the goal of all these
studies in the literature is to maximise the differential and diversity of the fingerprints or minimise the number of similar fingerprints.
In [76], an optimisation model is proposed to maximise the sum of the Euclidean distance of RSS vector among RPs within a limited area. A Differential Evolution algorithm is used to solve the optimisation model. The experimental results show that the APs are better to be scattered asymmetrically and the increase of the number of APs placed in the positioning area does not always obtain improvement of positioning performance. A similar technique as above is proposed in [77], which aims to maximise the minimum Euclidean distance of RSS vector between different RPs. The work in [78] defines a threshold called Similar Fingerprint (SF) and aims to minimise the total number of SFs among all the RPs by Simulated Annealing algorithm. In [79], on top of positioning, wireless coverage is also considered when carrying out AP placement. The minimum number of AP and locations of APs to achieve the desired coverage scope is determined in the first stage. In the second stage, the locations of APs are further adjusted to increase the fingerprint difference without compromising the coverage requirement. The fingerprint difference here is also defined as the Euclidean distance of RSS vector. Their result shows their approach cannot only guarantee radio coverage but also improve the positioning accuracy significantly. In [80], one approach inspired by the signal-to-noise ratio (SNR) is presented to find the most beneficial placement by maximising the numerator signal and minimising the denominator noise simultaneously. This work regards the location discriminant information as signal and the degree of unstable measurements of RSS as noise. The placement based on maximising SNR techniques shows considerable improvement of positioning precision and the best placement of APs is extremely asymmetric.
The approaches to describing and indicating the area to place APs of most of the other works are limited and inefficient. For example, in [78], their experimental area of 195m2is partitioned into a grid of 3mx 3.5mfor placing the APs, so there are a total of 18 possible locations where an AP can be placed. In this approach, the area to place APs is dramatically reduced to 18 single points from a space of almost 200m2, so that the probability to obtain the most-effective placement is reduced as well. Apart from using grid [76], defining the area by dimensions of a rectangle is the most common approach to specify the placement
space [79, 80]. The searching space is an open rectangle space without any limitation, and the AP can be placed anywhere inside the rectangle. If grid or rectangle is used to represent a searching space, the interference caused by obstructions in the indoor environment is ignored, so that the fitness of the optimised placement is affected as well.
In summary, the goal of all these techniques in the literature is to maximise the differential and diversity of the fingerprints or minimise the number of similar fingerprints. Most studies of the AP placement problem use the radio propagation model to predict signal strength, and most of the above works did not consider the obstacles in the positioning environment when the optimised AP placement is deployed. Furthermore, the placement results are displayed on preliminary floor plans that are usually drawn manually, e.g., using drawing software [78, 81].
2.3.2
Use of Signal Patterns
The main problem leading to insufficient positioning accuracy is the inconsistent WiFi signals, which is caused by signal fluctuation, changes in the indoor environment and mobile device heterogeneity. Thus, in recent years various solutions are proposed to mitigate the influence of inconsistent WiFi signals by observing the signals from a broader view to generate patterns which can help improve positioning accuracy. The discovery and usage of several signal pattern are discussed as follows.
Even though in the fingerprinting-based positioning system the RSS values are simply used as the metric of fingerprint and not used to calculate the distance between the receiver and AP, the RSS values actually still correlate with the location of APs. The APs are usually scattered in the indoor environment. Thus the remarkable RSS values measured at certain area can be used as the WiFi landmarks to identify this area uniquely. These WiFi landmarks can be discovered when the site survey is completed and the RSS measurements of the whole site are available. Inspired by such observation, people are investigating the patterns of WiFi signals from the spatial aspect, which is calledspatial signal pattern.
Initially the spatial patterns of individual APs are investigated and used to correct or constrain the location estimation, which typically needs to work with motion information
from inertial sensors and may not always be available since the APs are not densely deployed to form sufficient landmarks [82, 83]. Later on the spatial patterns of multiple APs are considered to investigate more reliable approaches. The order of RSS values from different APs is used in HALLWAY [84] as a location-dependent measurement to distinguish the rooms, which can reduce the influence of heterogeneous mobile devices and signal fluctuation. The effectiveness of the order of RSS values depends on the use scenarios and indoor floor plan, because the granularity of its location estimation is limited to a certain level and if the rooms are too small the adjacent rooms cannot be discriminated. Except for the order of RSS values, another approach to mitigating measurement uncertainty is to identify the target location using a range of RSS values rather than the absolute RSS values. Based on this observation, Sectjuntion [85] is proposed to partition the coverage of each AP to sectors according to discrete signal levels from the location where the AP shows maximum RSS value. The RSS sector calculation is conducted after the site survey is completed and takes the RSS measurements at RPs of the whole site into the calculation. The APs with a narrow range of RSS observations are filtered out of the RSS sector calculation because it discriminates fewer sectors. Then the target location is estimated using the intersection of sectors from multiple APs. The spatial signal pattern can help narrow down the search space and reduce the maximum error distance (i.e., in the positioning process to prevent the search space being a dispersed set of RPs, which are quite distant apart geographically).
In the conventional fingerprint-based positioning system, a fingerprint refers to the absolute values of RSS observed at a location (i.e., one of the RPs). As the previous statement, the movement, one-off RSS observation, device and usage diversity all could cause significant RSS variance. To minimise the influence of RSS variance, instead of looking at the one-off RSS value at one point, people are looking at the time-sequence values of RSS observed from a sequence of RPs, which is believed to be more robust than a single value.
Temporal signal pattern(TSP) is a sequence of WiFi signal observations during a short-term movement in the indoor environment, which is observed over time domain. Compared with approaches that use signals observed at a single time and location, the temporal signal
pattern is to make use of the correlation between sequential signals and moving trajectory, which is illustrated in Fig. 2.5. The temporal signal pattern along a movement is unique to the trajectory of movement. The temporal signal patterns are mainly characterised by its trend of change, including rising, decline and peaks.
Corridor WiFi Access Point Moving trajectory Mobile Device
Fig. 2.5 Illustration moving trajectory.
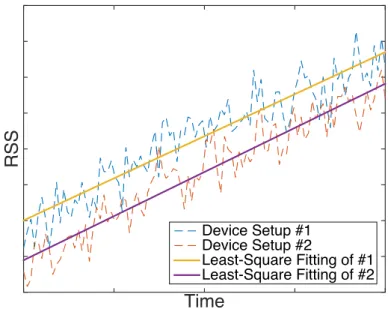
When a mobile device is moving along a trajectory, a set of time-sequence RSS values are observed and named as a temporal signal pattern of the moving trajectory, which is illustrated by the dashed curve in Fig. 2.6. The two dashed curves are the raw value of RSS observed by mobile devices of different setups. From the dashed curves we can see that the RSS is fluctuated significantly because of the movement and the average RSS is different under different device setup. Mobile device setup is depending on device model and device placement, such as placing in hand, pocket or bag. Therefore, using a one-off observation during movement and the absolute RSS values to calculate the position could lead to crucial positioning error. If we find the linear regression model of these two signal patterns by least-square regression, which is depicted by the solid lines in Fig. 2.6, we can see that their slope is nearly the same. The slope indicates the trend of RSS changes of the signal pattern. In such approach, examining the trend of changes instead of the absolute RSS values can address the RSS variance problem effectively.
Time RSS Device Setup #1 Device Setup #2 Least-Square Fitting of #1 Least-Square Fitting of #2
Fig. 2.6 Illustration of temporal signal pattern when moving along a trajectory with different device setup.
On the other hand, the temporal signal pattern can be used to effectively determine the direction of the mobile device when leaving a junction. When a user is approaching and leaving a junction, the fingerprints of locations around the junction are very similar and it’s very difficult to predict without other information like a compass. However, the continuous observation of RSS from certain AP will show a certain temporal signal pattern which can distinguish the direction that the mobile device is heading to. As the illustration in Fig. 2.7, different trajectory options at a junction can lead to different temporal signal trend, which is unique and can be used to determine the trajectory of the mobile device.
Kim et al. [86] propose a smartphone-based pedestrian-tracking system using WiFi, which utilises both spatial and temporal signal patterns. They deeply investigate the incon-sistent RSS problem and their analysis shows that fingerprint-based indoor tracking suffers significant performance degradation due to the RSS variance, while the positioning of a stationary location is more robust to the RSS variance. In their system, an approach named Peak-based WiFi Fingerprinting (PWF) is proposed to overcome the inconsistent RSS prob-lem. In the site survey the RSS vectors at different locations are collected as the traditional fingerprinting system, then the locations with maximum RSS of each AP are selected and recorded with the maximum RSS values. In the tracking phase the peak RSS is detected from
Time RSS Case 1 AP 1 AP 2 Time RSS Case 2 AP 1 AP 2 Time RSS Case 3 AP 1 AP 2 Time RSS Case 4 AP 1 AP 2
Fig. 2.7 Illustration of trajectory options at a junction and the corresponding temporal signal trend.
a sequence of observed RSS values and compared with the maximum RSS value recorded in the site survey. If the RSS value difference between the observed peak and recorded maximum value is less than a predefined threshold, the location with the observed peak is determined as the estimated location. Because RSS peak locations are limited and PWF has only about 20% occurrence ratio, other schemes such as traditional KNN method are used in the positioning of other locations. The PWF method improves the system accuracy by detecting the signal strength peak from temporal signal patterns but has the problem of potential missing scan of peak values.
Walkie-Markie [87] is a system that aims to generate the map of indoor pathway using the WiFi signal and IMU data crowd-sourced from multiple mobile phone users. The WiFi-defined landmark (WiFi-Mark) is introduced in Walkie-Markie to act as the anchor to merge large volume of partial trajectories and limit the drift of IMU-based tracking. WiFi-Mark is defined as a location where the trend of an AP’s RSS reverses, i.e., as the user moves along a pathway, the RSS reading is changing from increasing to decreasing. This approach by examining the RSS trend instead of RSS readings turns out that no matter how the devices are different and how the user is holding the device, the WiFi-Mark occurs at the same location, which shows the effectiveness of tem