Integrating Intelligent Driver Warning Systems: Effects of Multiple Alarms and Distraction on Driver Performance
AND10 – Vehicle User Characteristics
Angela W.L. Ho, M. L. Cummings, Enlie Wang, Louis Tijerina, Dev S. Kochhar
Total: 7076 words = 4826 words + 9 Figures and Tables at 250 words each Submission date: 31 July 2005; Revised version: 15 November 2005 Angela W.L. Ho (Corresponding Author)
Graduate Research Assistant
Humans and Automation Laboratory
Department of Aeronautics and Astronautics Massachusetts Institute of Technology 77 Massachusetts Avenue, Room 33-309 Cambridge, MA 02139-4307 Tel: (857) 891-3681 Fax: (617) 253-4196 Email: [email protected] M. L. Cummings Assistant Professor
Humans and Automation Laboratory
Department of Aeronautics and Astronautics Massachusetts Institute of Technology 77 Massachusetts Avenue, Room 33-305 Cambridge, MA 02139-4307 Tel: (617) 252-1512 Fax: (617) 253-4196 Email: [email protected] Enlie Wang Postdoctoral Associate
Humans and Automation Laboratory
Department of Aeronautics and Astronautics Massachusetts Institute of Technology 77 Massachusetts Avenue, Room 35-220 Cambridge, MA 02139-4307 Tel: (617) 452-3038 Fax: (617) 253-4196 Email: [email protected] Louis Tijerina Technical Expert
Active Safety Research & Advanced Engineering Ford Motor Company
MD-5036, Dearborn, Michigan 48124 Tel: (313) 317-9231 Fax: (313) 337-5432 Email: [email protected] Dev S. Kochhar Technical Expert
Active Safety Research & Advanced Engineering Ford Motor Company
MD-5036, Dearborn, Michigan 48124 Tel: (313) 248-5295
Fax: (313) 323-8868
Abstract. Driver warning systems are under development to improve safety in driving; yet the integration of these systems in cars may increase the complexity of driving, especially in high workload situations. Critical human factors issues arise, such as how the interaction between alerting schemes, system reliabilities, and distractions combine to affect human performance and situation awareness. An experiment was conducted to study how a single master alert versus multiple individual alerts of different reliabilities affect drivers’ responses to different imminent collision situations while distracted. The driver warning systems included auditory alerts for an imminent frontal or rear collisions, or for unintentional left and right lane departures. The different warning systems and reliability factors produced significantly different reaction times and response accuracies. The low reliability system caused accuracy rates to fall more than 40% across the four warning systems. For the master versus individual alarms factor, drivers
responded statistically the same to the different collision warnings for both reaction times and accuracy of responses. In a subjective post-experiment assessment, subjects preferred distinct alarms for different driver warning systems, even though their objective performance showed no difference to the different alerting schemes.
INTRODUCTION
Driver Warning Systems
There is increasing interest in actively advancing safety in vehicles beyond that of improving crash worthiness. To alleviate the number of highway accidents each year, automotive manufacturers are augmenting current passive safety programs with the development of in-vehicular collision warning and avoidance systems (1). In the public domain, significant advancements have been made under the Intelligent Vehicles Initiative (IVI) set up by U.S. Department of Transportation to prevent motor vehicle crashes by assisting drivers in avoiding hazardous mistakes(2). One IVI focus area, Collision Avoidance Systems (CAS) is a subset of Advanced Vehicle Control Safety Systems (AVCSS) which come under the umbrella of Intelligent Transportation Systems (ITS). Primary directions of research are determining implementation strategies and technologies in vehicles and roadway infrastructure, as well as optimizing the driving performance of different populations of drivers when using such avoidance and warning systems.
In Collision Avoidance Systems or Driver Warning Systems implementation, vehicles will communicate with other vehicles as well as with the roadway infrastructure via sensors and telecommunication networks. Vehicle-to-vehicle CAS include warnings that trigger when a vehicle is about to collide with another vehicle. Examples of current systems under investigation include frontal warning and blind spot detection warnings. Vehicle-to-infrastructure CAS include warnings that trigger when a vehicle is about to collide with the roadway infrastructure.
Examples include intersection warnings, lane departure warnings, curve speed warnings and road-condition warnings.
Human Factors Concerns
Driving in a dynamic environment has become increasingly complex, such that drivers must make decisions in a dynamic and potentially high workload mental environment which includes visually tracking objects, monitoring a constantly changing system, and managing traditional in-vehicle and telematics information. Introducing intelligent alarms into in-vehicles could add to the complexity of this dynamic environment. One human factors issue that will arise involves the warnings or alarms that comprise driver warning systems. Problems in alarm systems that give rise to human factors concerns include nuisance alarms, ambiguous alarms, alarm inflation, etc. It is important that alarms are informative in alerting driver to the condition at hand, without overwhelming them with too much or inadequate information. Such information may be embedded in the nature of the alarm (i.e. a speech warning), or may come from the driver awareness of the context (3).
Several studies have been conducted to determine the effectiveness of intelligent alerting systems for warning drivers of impending collisions. Studies include examining effectiveness of such warning systems on different age groups (4), as well as on comparing the effectiveness of alarm warnings presented through different modalities: visual (5), aural and haptic (6), as well as the multi-staged alert strategies for impending collisions (7). Further research has also been conducted on drivers’ performance in distinguishing between aural alarms like auditory icons and beeps (8), as well as the effectiveness of visual warnings like icons or warnings signs (5). While these studies have comprehensively studied a number of critical issues in the introduction of intelligent predictive alarms into the driving domain, no study has directly compared the
effects of the integration of multiple driver warning systems or intelligent alarms on the perception, recognition, subsequent action and overall situation awareness of drivers. Of particular concern is how the presentation of different alerts could affect drivers’ performance, and how interactions among the various other alerts, different alert management schemes, system reliabilities, and distractions combine to affect situational awareness of drivers.
This study addresses this gap in Collision Avoidance Systems and intelligent alarm research by examining whether or not a single master alarm warning versus multiple warnings for the different collision warning systems conveys adequate information to the drivers. Intelligent driver warning systems signaling impending frontal and rear collisions, as well as unintentional lane departures were used. In this study, warnings were presented to drivers through the aural channel only.
METHOD
Apparatus and Subjects
A human-in-the-loop simulation test bed was developed using STISIM Drive™ Build Simulation System developed by Systems Technology, Inc. Scenarios were built using the Scenario Definition Language (SDL) and modifications were made using the STISIM Drive™ Open Module code.
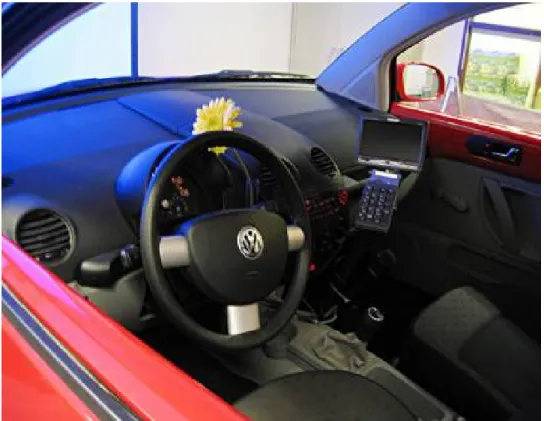
The experiment was conducted on a fully instrumented, fixed-based driving simulator, a 2001 Volkswagen Beetle, named “Miss Daisy”. The rearview is provided via the simulation environment. Subjects drive through programmed scenarios, interfacing with the brake pedal, accelerator pedal and steering wheel, which provided force feedback for a degree of realism. The speedometer, turning signals, hazard lights, seat adjustments, air conditioning are fully functional. Auditory output, namely vehicular motor sounds, and the pertinent alarm warnings are broadcast through the in-car radio sound system. The virtual environment is projected onto a large wall-mounted eight feet by six feet projector screen six feet in front of the driver. This provided a 30° horizontal field of view, approximately. A secondary small screen with a number keypad
connected is on the right side of the driver. Figure 1 illustrates the driving environment and the secondary task screen.
Forty licensed drivers volunteered to participate in this experiment: 17 females and 23 males. Subjects’ ages ranged from 18 to 40 years, with the mean age of 25.8, and standard
deviation of 5.43 years. Their driving experience ranged from 0.5 to 24 years, with a mean age of 7.21, and standard deviation of 5.03 years. 35 subjects were affiliated with M.I.T. as either student or staff. After signing consent forms and filling out a pre-simulation survey, subjects were seated in the car. Throughout the 60 minute long experiment, subjects heard pre-recorded instructions through the in-car sound system. Subjects were told to drive as they normally would, and to obey speed limits and traffic control devices such as stop signs and intersection lights.
FIGURE 1 Interior of Testing Car - Driver's Interface and Internal Screen for Secondary Task.
Experimental Design
In this study, the critical questions to be answered were:
1. Do multiple intelligent alarms as opposed to a single master alarm affect drivers’ recognition, performance, and action when they experience a likely imminent collision and unintentional lane departure?
2. Is driver performance and overall situation awareness under the two different alarm alerting schemes affected by reliabilities of the warning systems?
To investigate the impact of the different alarm alerting schemes, different driver warning systems, and warning reliability factors on driver’s overall situation awareness, an experiment was conducted using a mixed 2x4x2 mixed factorial design.
Factor 1: Alarm Alerting Scheme
The first factor was the type of alarm alerting scheme (single master alarm vs. multiple alarms). It was a between-subjects factor. Half of the subjects who drove through the test scenarios heard a single master alarm for all the different warnings, while the other half heard different alarms for each of the frontal and rear impending collisions, as well as potential left and right lane departures. Sound files for all alarms were provided by the Ford Motor Company, and consisted only of tonal beeps.
For the first treatment level of a single master alarm, subjects heard a generic tonal beeping alarm for all the different Driver Warning Systems alarms. For the second treatment
level of multiple alarms for different Driver Warning Systems, subjects heard the following alarms:
• Forward Collision Warning (FCW): a tonal beep consisting of short phase difference, conveying a sense of urgency
• Follow Vehicle Fast-Approach (FVFA): a tonal beep consisting of a longer phase difference
• Left Lane Departure Warning (LLDW): an alert simulating a low frequency rumble strip, broadcast through the in-car left speaker
• Right Lane Departure Warning (RLDW): an alert simulating a low frequency rumble strip, identical to the LLDW warning, but broadcast through the in-car right speaker.
It is important to note that while the FCW and FVFA alarms were heard in both speakers,
directional alarms for the Lane Departure Warnings were used under the multiple alarms alerting scheme.
Factor 2: Driver Warning Systems
The second factor was the alarm event type which included imminent frontal or rear collisions, and unintentional left and right lane departures. Thus subjects would experience an alarm in all four cardinal directions. This factor was repeated across subjects, and every participant
experienced all types of events. For each testing scenario, there was an equal number of FCW, FVFA, Left LDW and Right LDW events randomly interspersed in the driving roadway scenario.
Frontal Collision Warning: There were four types of FCW triggering events:
1. An oncoming vehicle on the highway that overtook another car, resulting in an impending head-on collision. The head-on incoming car would swerve back into its own lane at the last minute to avoid a collision, but still triggered the FCW warning.
2. A lead vehicle on the highway that suddenly braked.
3. A stationary parked vehicle that pulled out from the side of the road into the driver’s path. 4. A stationary parked vehicle that backed out from a garage onto the driver’s path, and then
moved forward into the garage again.
The alarm would stop when the driver decreased the closing velocity by braking or by swerving to avoid the impending frontal collision.
Follow Vehicle Fast-Approach: One FVFA triggering event was used in which a vehicle quickly approached the driver from the rear with a closing velocity of 50 feet/second. The rear vehicle approached and overtook on the driver’s left when the 2 vehicles were within 2 feet of each other. The alarm would stop when the driver decreased the closing velocity by increasing the distance from the follow vehicle or by swerving to avoid the impending collision.
Lane Departure Warning: In the real world, lane departure warnings are potentially useful for drivers who are inattentive, distracted or drowsy. However, such a scenario is not practical to reliably reproduce during a controlled experimental test. In this experiment, the LDW event was tested by forcing a lane change maneuver on the drivers via a “windy’ condition. Subjects were told before the experiment that they would experience periodic wind gusts while driving. This would force a gradual heading change and subsequent lane change either to the left or right of the subject’s vehicle. The alarm would stop when the driver swerved back into the lane by a steering motion.
Factor 3: Reliability of the Warning Systems
The third factor investigated was the effect of two levels of warning reliabilities on the drivers’ performance. This was a within-subject factor, and every subject experienced both a highly reliable warning system of TP:FP =3:1 (true positive: false positive) across the four different warning systems, and a lower warning system reliability ratio of TP:FP = 1:3. TP events are defined as an actual occurrence of the event for the respective alarm and FP events occurred when an alarm sounded with no actual corresponding event. The order in which participants experienced these two different reliabilities was counterbalanced to reduce order effects. In each test session, subjects experienced 32 events, 8 events (including TP and FP) per driver warning system, arranged in a random order. Each event occurred approximately 30-45 seconds apart.
Distraction
Drivers were required to perform a visual cognitive load task which was presented to their right on an internal side screen (Figure 1). It provided a means of distraction by directing drivers’ attention away from driving to look away from the roadway scenario. During the cognitive load task, seven numbers would flash on the internal side screen at random during the drive. Each number string comprised six zeros and one non-zero number. The participant was required to do a mental addition sum of the non-zero number and its position in the number string, and then enter the answer via the number keypad located just below the internal screen. For example, if the string displayed was “8 0 0 0 0 0 0”, the correct answer was 8+1=9.
Dependent Variables
One dependent variable in the experiment was the driver reaction time for initiation of a corrective action from the triggering of the alarm for a True Positive event. For an FCW event, the reaction time was the time taken to take sharp braking action or sharp steering action to avoid a frontal collision. For an FVFA event, it was the time to depress the accelerator pedal or take evasive steering action. For an LDW event, it was the time to apply a sharp steering correction in a direction opposite to that of the lane departure. The alarm did not stop until drivers took a corrective action (either accurate or inaccurate response). In the case of a false alarm, the time window for measuring the reaction time was the cycle of the alarm, approximately 4 seconds. In addition, the accuracy of the initial response to the TP and FP events was also analyzed. For example, an accurate response to a FP event would be to not respond.
Procedure
The experiment consisted of three practice scenarios preceding two testing scenarios. Only
daylight and dry road conditions were simulated. For the three training scenarios (15-20 minutes), subjects acclimated to the simulator in an urban setting followed by a mountainous setting and also practiced driving while performing the cognitive load task. In the practice scenarios, subjects encountered impending collisions and heard the warning alarms for the different driver warning systems, and also experienced false alarms. In the subsequent two testing scenarios (15 minutes each), subjects drove through roadways consisting of both urban and highway settings, and encountered the collision events presented in randomized order. Subjects were required to drive while performing a cognitive load task. After subjects completed the testing scenarios, they filled out a post-testing survey.
RESULTS Reaction Time
The reaction times for true positive events were analyzed by GLM repeated measures statistical model with alarm alerting scheme as a between-subjects factor and types of driver warning systems, and reliability levels as within-subjects factors. All data met normality and
homogeneity assumptions at a level of α = .05. The alerting scheme factor (single/multiple alarm) was not a significant factor in affecting the TP reaction times (F(1, 38) = 0.0004, p = 0.995). Types of driver warning systems (FCW/FVFA/LLDW/RLDW) and system warning reliabilities (high/low) factors were significant, (F(3, 114) = 91.244, p < .001) and (F(1, 38) = 9.649, p < .01) respectively. There was a significant interaction effect between types of warning systems and reliability (F(3, 114) = 8.559, p< .001) but no significant interaction between alerting scheme and reliability.
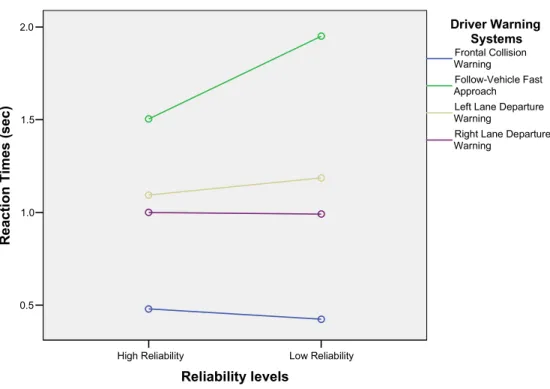
Figure 2 demonstrates that reaction time to FCW alarms were the shortest, followed by that of the left and right LDW alarms. Reaction times to FVFA events show both a marked increase and a larger variance in performance. According to Bonferroni pairwise comparisons, the reaction times were significantly different for all pairings (p < .001) of the warning systems. From the interaction graph between the factors of driver warning systems and reliabilities (Figure 3), while reaction times are relatively constant across low and high reliabilities, the FVFA reaction times were significantly longer for the low reliability case as opposed to the high condition. Right Lane Departure Warning Left Lane Departure Warning Follow-vehicle Fast Approach Frontal Collision Warning s in g le m u lti p le A la rm t y p e Low reliability High reliability Low reliability High reliability Low reliability High reliability Low reliability High reliability 4 3 2 1 0 4 3 2 1 0
FIGURE 2 Reaction Times to True Positive Events Across All Factor Levels.
R e a c ti o n t im e ( S e c )
Low Reliability High Reliability Reliability levels 2.0 1.5 1.0 0.5 R e a c ti o n T im e s ( s e c )
Right Lane Departure Warning
Left Lane Departure Warning Follow-Vehicle Fast Approach Frontal Collision Warning Driver Warning Systems
True Positive Reaction Times for Different Driver Warning Systems and Reliability Levels
FIGURE 3 Reaction Times to True Positive Events for Driving Warning Systems and Reliability Levels.
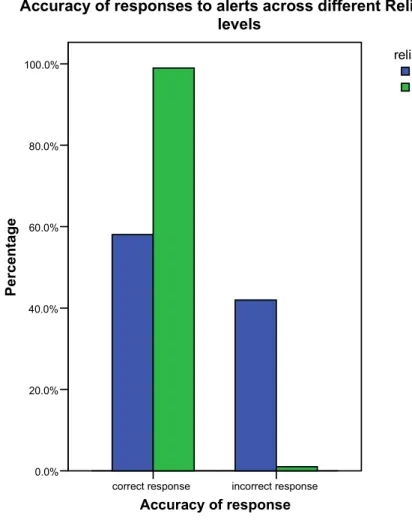
Subjects were generally accurate in determining the correct response to a given event, whether it be to intervene in the case of a true event or to take no action in the case of a false alarm. Over all test scenarios, 72% events were handled correctly (see Table 1). Because of the dichotomous nature of driver response (either correct or incorrect), a non-parametric chi square test was used to examine the main factors. The results are very similar to the reaction time results, in that the multiple versus single alarm condition was not significant (χ2 = .251, df = 1, p = .616), but the different warning systems and reliability were significant (χ2 = 14.121, df =3, p < .01 and χ2 = 548.0, df = 1, p < .001 respectively). Figures 4 and 5 illustrate the significant effects (missing data not included). Subjects were generally correct (either responding correctly to a true alarm or not responding in a false condition), but their error rate significantly increased when they had an unreliable system. Interestingly, Figure 4 shows that the error rates for
responding to alerts in the front and rear quadrant were slightly higher than for the left and right. Figure 5 illustrates subjects’ responses for the different warning systems under both system reliabilities. This further demonstrates that the low reliability condition contributed to subjects’ errors in their initial responses. When only examining whether or not the responses to the false alarms were correct, the different driver warning systems were significant (χ2 = 8.31, df = 3, p = .04), but again the single vs. multiple alarm factor was not (χ2 = .120, df = 1, p = .729).
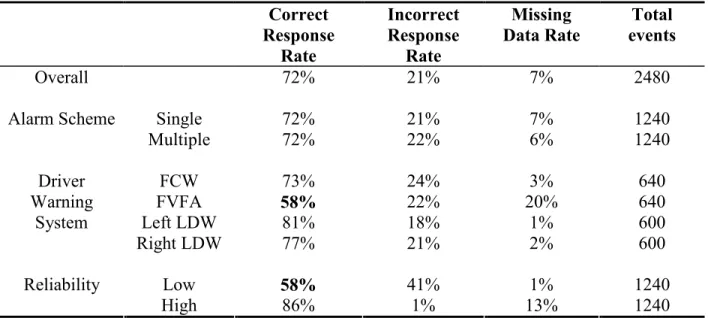
TABLE 1 Accuracy of responses across all factor levels Correct Response Rate Incorrect Response Rate Missing Data Rate Total events Overall 72% 21% 7% 2480 Single 72% 21% 7% 1240 Alarm Scheme Multiple 72% 22% 6% 1240 FCW 73% 24% 3% 640 FVFA 58% 22% 20% 640 Left LDW 81% 18% 1% 600 Driver Warning System Right LDW 77% 21% 2% 600 Low 58% 41% 1% 1240 Reliability High 86% 1% 13% 1240 incorrect response correct response Accuracy of response 100.0% 80.0% 60.0% 40.0% 20.0% 0.0% P e rc e n ta g e Right LDW Left LDW Follow-Vehicle Fast Approach Frontal Collision Warning Driver Warning Systems Accuracy of responses to alerts across different Driver
Warning Systems
incorrect response correct response Accuracy of response 100.0% 80.0% 60.0% 40.0% 20.0% 0.0% P e rc e n ta g e High Low reliability
Accuracy of responses to alerts across different Reliability levels
FIGURE 5 Accuracy of Responses Across Different Reliability Levels. DISCUSSION
Factor 1: Multiple Alarms vs. Single Master Warning Alarm
For this study, results showed that there was no significant difference in drivers’ reaction times or for the accuracy of the responses under the different alarm alerting schemes, regardless of responses to TP or FP events. This is an important finding since it means that hearing a master alarm or different alarms for the four conditions did not have a significant impact on drivers’ performances. Nevertheless, it should be noted that the only aural alarms were used, and results may differ when combined with haptic and visual alerts or alarms.
According to the post-survey, 100% of subjects reported that they were not confused by the alarm scheme. Moreover, according to the post survey questions asked to determine
preference for type of alarms, 26% of the subjects preferred the master alarm while 74% preferred having distinct alarms for the different driver warning systems. Out of the 74%, participants generally preferred auditory beeps as alarms for indicating left and right lane drift, and specific voice alerts (e.g. “front hazard”, “rear hazard”) for impending directional collisions (although voice alerts were not tested in this experiment). This is an interesting finding because
even though most people prefer a distinct warning for different systems and think they will perform better, their reaction times and accuracy results show otherwise. Thus, the objective results did not corroborate their preferences. This dissonance between users’ preferences and their performance has been established for visual displays (9), and this study highlights that this discord can also be true for audio displays.
One artifact of experimental studies such as this is that participants experience an unusually high incidence of potential collision events and lane departures in a compressed time period. Thus, subjects are expecting the alerts to sound and assume a higher mental alert state in response to the test conditions. However, in reality the incidence of these events will be much lower for an average driver. Since TP events would be rare occurrences, whether drivers would know what these distinct alarms meant given sporadic usage remains an open question. It is nonetheless encouraging that a single master alert appears to work as well as multiple alerts even in a laboratory setting. This might be explained by the fact that the driving context usually defines the nature of the crash hazard. A master alert associated with a lane departure, for example, will generally be interpreted as such when the driver perceives the vehicle's lane
position and yaw angle. Similarly, a master alert for a forward collision threat will also generally become apparent once the driver focuses attention to the forward visual field and sees a vehicle or obstacle ahead.
Factor 2: Different Driver Warning Systems
There was a significant statistical difference in drivers’ reaction times to the different intelligent warnings in a true event, with the most significant increase in reaction time occurring in the Follow Vehicle Fast-Approach condition. Reaction times to the FCW events were the shortest, while those to the Left and Right LDW were about the same (Figures 2 and 3). This is expected, since subjects’ attention was focused mainly on the front visual scene. An impending frontal collision would elicit a quick reaction time on the order of 0.5 seconds. However, lane drifts did not have this inherent connotation of urgency associated with it, especially if they were driving on an empty highway.
Reaction time was much longer for responding to a potential rear collision for a variety of reasons. First, it may be due to the division of attention, primarily directed to the forward visual scene and to the secondary task which occurred throughout the drive rather than to the rear-view mirror image. In addition, when subjects heard the FVFA alarm, they needed to develop a prediction for what the car in the rear might do. Thus, subjects took longer to decide if the follow-vehicle was indeed closing in on their car, and then respond accordingly.
In subjective evaluations, 37% of the subjects felt that the FCW alarms offered a timely warning in alerting them to impending collisions, as compared to a much higher 79% and 74% for the FVFA and LDW alarms respectively (see Table 2). This forward collision hazard may have been more obvious to subjects and so the FCW alarm seemed less useful. Alternatively, this difference between subjective preferences for frontal and rear collision warnings as well as the difference in objective reaction times may be due to the desire to cognitively offload the rearview monitoring task, especially since subjects were distracted. Spare cognitive resources were used for the secondary task, which in the real world could be talking on a cell phone or interacting with a navigation system. Because potential critical events in the rear require an extra step of prediction and additional monitoring, subjects tended to shed the rear-view monitoring
task when distracted. This example of cognitive shedding is further evidence that for events that are not taking place in the frontal view, drivers need alarm devices for situation awareness.
TABLE 2 Subjective evaluation of helpfulness of alarms
Were alarms helpful in: Yes No
Avoiding a Frontal Collision 37% 63% Avoiding a Rear Collision 79% 21%
Keeping in own lane 74% 26%
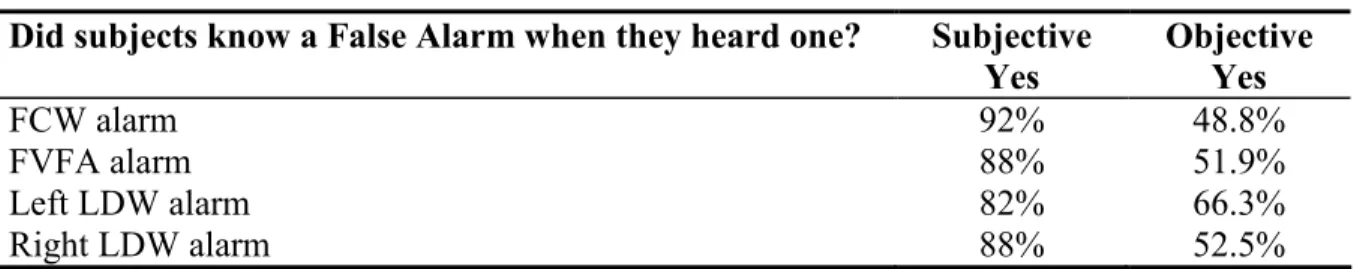
In terms of subject confidence, a high percentage of subjects reported on the post-survey that they knew when an alarm was a false one (see Table 3). Yet a consistently lower percentage of subjects correctly rejected a false alarm by not responding. This illustrates that even though subjects thought an alarm was false, they still responded. One reason might be that when the subject heard an alarm, it was instinctive to respond. Furthermore this could be a “better-be-safe-than-sorry” risk-averse attitude because no negative costs were incurred since there was no penalty for responding to a false alarm. This result also illustrates that there is a bias in subjective assessment of performance and that the subjects tended to overestimate their performance, which is a well-established phenomenon (10).
TABLE 3 Subjective and objective measures of false alarm awareness Did subjects know a False Alarm when they heard one? Subjective
Yes Objective Yes FCW alarm 92% 48.8% FVFA alarm 88% 51.9% Left LDW alarm 82% 66.3% Right LDW alarm 88% 52.5%
Factor 3: Reliability of the Warnings
There was a significant difference in drivers’ reaction times when they were driving under different system reliabilities. However, this effect must be evaluated in light of the significant interaction. As illustrated in Figures 2 and 3, the difference in system reliability primarily affected only the FVFA condition. Under this condition, participants’ TP reaction times were shorter for the high reliability condition as compared to the low. This was generally expected under all conditions but only demonstrated under the FVFA condition. Since the rear quadrant events were more difficult to both detect and take correct action, the addition of an unreliable system caused participants to delay decisions to brake even further.
While there is a small effect of reliability of subjects’ reaction time, there is a much more significant difference in accuracy of responses to the different reliability levels. Responses to the highly reliable system were much more accurate than that to the less reliable system. According to Figure 5, when reliability level is high, there is essentially no difference between accuracy for the different warning systems, and when it is low, the correct responses to the different alarms drops dramatically. Furthermore, correct rejection of false alarms dropped from 98.3% for a system with high reliability (25% false alarm rate) to 60.7% for the system with low reliability (75% false alarm rate).
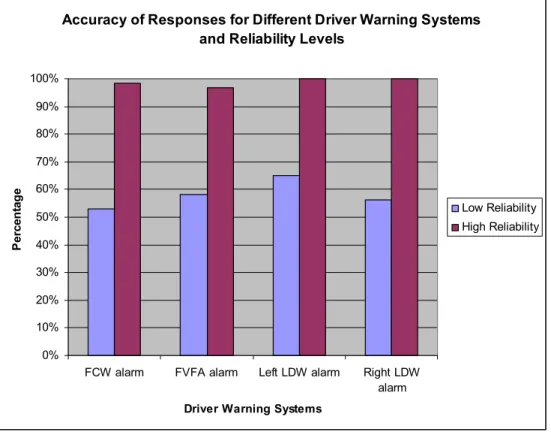
On the whole, the rates for responding accurately were generally high (see Table 1). Most of the inaccuracies came from responses to the false warnings, which were particularly
problematic in the low reliability condition. Figure 6 demonstrates the interaction between reliability levels and warning systems on response accuracy rates. While the LDW system appeared to produce the best performance under low reliability, the remaining systems were between 50-60% in terms of accuracy performance. The significant drop of error rate across all four warning systems from low to high clearly demonstrates that reliability of alerting systems in critical in achieving superior human performance.
Accuracy of Responses for Different Driver Warning Systems and Reliability Levels
0% 10% 20% 30% 40% 50% 60% 70% 80% 90% 100%
FCW alarm FVFA alarm Left LDW alarm Right LDW alarm
Driver Warning Systems
P e rc e n ta g e Low Reliability High Reliability
FIGURE 6 Accuracy of Responses for Driver Warning Systems and Reliability Levels.
In terms of subjective assessments, according to post-survey results, 33% of subjects felt that the alarms were an annoyance; 27% felt stressed by the alarms, and 22% felt that the alarms were distracting and adversely affected their driving. These results illustrate that even if the subjects did well in terms of driving performance, many perceived the alarms negatively. This perception could have been, in part, a function of the nature of the experiments during which alarms constantly sounded, especially in the low reliability test sessions.
CONCLUSION
A significant finding of this study is that even though subjects preferred distinct alarms for different driver warning systems, their objective performance showed no difference in reaction times and accuracy of responses to a single versus multiple alarms for the different driver warning systems. This is an important finding since it implies that if performance is unaffected, automotive manufacturers can customize the alerting schemes of driver warning systems to the customers’ desires, or use a simple master alerting scheme for vehicles where cost savings are
important. However, these results are only applicable to aural alerting schemes and this work should be extended to include integration with visual and haptic alerts.
While not unexpected, the results that demonstrate that low reliability can dramatically (and negatively) influence human performance further highlight the need for the development of highly reliable intelligent warning systems. While intelligent driving warning systems can serve as an additional protection to drivers in times of urgent or emergent events, as demonstrated in this study, decreased system reliability can dramatically increase incorrect responses to these systems. If there is a high incidence of false alarms for intelligent warning systems, drivers might be better served by not having such intelligent aids at all.
ACKNOWLEDGEMENTS
Financial support for this project was provided by the Ford Motor Company. We would also like to thank Andrea Greb (undergraduate research assistant) and The Age Lab at M.I.T. for their assistance, especially Dr. Bryan Reimer.
REFERENCES
1. Intelligent Vehicle Initiative Mission Homepage. IVI's Mission: Prevention of Highway Crashes and the Fatalities and Injuries They Cause, U.S. Department Of Transportation. http://www.its.dot.gov/ivi/mission.html Accessed March 18, 2005.
2. Runge J. W. What is VII. Presented at VII (Vehicle Infrastructure Integration) Public Meeting, San Francisco CA, 2005.
3. Woods D. The Alarm Problem and Directed Attention in Dynamic Fault Management.
Ergonomics, Vol. 38, No. 11, 1995, pp. 2371-2393.
4. Maltz M., Sun H., Wu Q. & Mourant R. Use of In-Vehicle Alerting System for Older and Younger Drivers: Does Experience Count? CD-ROM of the 83rd Annual Meeting of the Transportation Research Board, Washington, D.C., January, 2004.
5. General Motors Corporation and Delphi-Delco Electronic Systems. Automotive Collision
Avoidance Operational Field Test Warning Cue Implementations Summary Report.
Publication No. DOT-HS-809-462, National Highway Transportation Safety Administration, U.S. Department of Transportation, 2002.
6. Tijerina, L., Johnston, S., Parmer, E., Pham, H.A., Winterbottom, M.D. & Barickman, F.S.
Preliminary Studies in Haptic Displays for Rear-end Collision Avoidance System and
Adaptive Cruise Control Application. Publication No. DOT-HS-809-151, National Highway
Transportation Safety Administration, U.S. Department of Transportation, 2000.
7. Lee, J. D., & Hoffman J. D. Collision Warning Designed To Mitigate Driver Distraction. Presented at SIGCHI Conference on Human Factors in Computing Systems, Vienna Austria, 2004.
8. Graham, R. Use of Auditory Icons as Emergency Warnings: Evaluation within a Vehicle Collision Avoidance Application. Ergonomics, Vol. 42, No. 9, 1999, pp 1233-1248.
9. Andre, A., & Wickens C. When users want what's not best for them. Ergonomics in design; the magazine of human factors applications.1995.
10. Tversky, A., & Kahneman, D. Judgment Under Uncertainty: Heuristics and Biases. Science.