Förnamn Efternamn
Marcelo G. Gutierrez B.
Master’s Thesis
Master of Engineering - Big Data Analytics
May 15, 2020
TEXT MINING FOR
GLOBAL REPORTING INITIATIVE (GRI) STANDARDS:
STUDY OF NORDIC LISTED COMPANIES
1 MASTER’S THESIS
Arcada University of Applied Sciences
Degree Programme: Master of Engineering - Big Data Analytics Identification number: 7752
Author: Marcelo G. Gutierrez B.
Title: Text Mining for Global Reporting Initiatives (GRI) Standards: Study of Nordic Listed Companies. Supervisor (Arcada): Leonardo Espinosa Leal
Commissioned by: Abstract:
This thesis investigates using text mining methods, if Corporate Social Responsibility reports have been published following the guidelines of the Global Reporting Initiative Standards. To achieve this goal, several text mining techniques were implemented such as Latent Dirichlet Allocation (LDA), Transformation into inverse frequency (TF-idf), FastText, Global Vectors (gloVE), Latent Semantic Index (LSA), wor2vec and doc2vec. These results are analysed from an Unsupervised Learning perspective. We extract string, corpus and hybrid semantic similarities and we evaluated the models trough the intrinsic assessment methodology. Index matching was develop to complement the semantic valuation. The final results show us that LSA and gloVE as the best option for our study of Nordic listed companies.
Keywords: Text mining, sustainability, Semantic similiarity, GRI reports, Corporate Social Responsability, Machine Learning.
Number of pages: 79
Language: English
2
CONTENTS
1 INTRODUCTION ... 8
1.1 Motivation and theoretical framework ... 8
1.2 Limitations ... 9
1.3 Ethical considerations ... 9
1.4 The structure ... 10
2 FUNDAMENTALS AND LITERATURE REVIEW ... 11
2.1 Text Mining ... 11
2.2 Text representation and encoding... 11
2.2.1 Text Preprocessing. ... 12
2.2.2 Text-Transformation. ... 12
2.2.2.1 Bag of Words (BOW) ... 12
2.2.2.2 Skip-gram ... 13
2.2.2.4 Hashing Features ... 14
2.2.2.5 Word embedding ... 15
2.2.2.6 Sentence Embedding ... 16
2.3 Methods of generating meta-embeddings ... 17
2.3.1 Word2vec ... 17
2.3.2 Doc2Vec ... 18
2.3.3 FastText ... 18
2.3.4 gloVE ... 19
2.4 Text-Mining Methods ... 19
2.4.1 Text Mining Approaches ... 19
2.5 Evaluation of word embeddings ... 20
2.5.1 Extrinsic evaluation methods ... 20
2.5.2 Intrinsic evaluation methods ... 21
2.6 Semantic Text Similarity ... 22
2.6.1 Overview ... 22
2.6.2 Cosine similarity ... 23
2.6.3 Soft cosine similarity ... 24
2.6.4 Latent Semantic Analysis (LSA) ... 25
2.7 GRI reports ... 27
2.7.1 GRI versions ... 27
2.7.2 Text Mining on GRI reports ... 28
3
3.1 Overview ... 30
3.2 Data Collection ... 30
3.3 Pre-processing ... 31
3.4 EDA ... 32
3.4.1 Exploratory Data Analysis (EDA) ... 32
3.4.2 Descriptive analysis of the dataset ... 34
3.4.2.1 N-Grams distribution ... 34
3.4.3 Example Analysis Bottom-up ... 37
3.4.3.1 LDA ... 40
3.4.3.2 Visualizing how Corpora Differ ... 42
3.5 Matching the reports by Guidelines (IR) ... 45
3.5.1 Recovery Measures ... 45
3.5.2 Recovery Models ... 46
3.6 Conclusions ... 46
4 EXPERIMENTATION ... 47
4.1 Tools for Data collection, preprocessing and transformation ... 47
4.1.1 Collecting ... 47
4.1.2 Encoding ... 47
4.1.3 Vectorization of text and calculation of similarities... 48
4.1.4 Graphics ... 48 4.1.5 Storage ... 48 4.1.6 Text preprocessing ... 48 4.1.7 Multithreading ... 49 4.1.8 Information Extraction ... 49 4.1.9 Others ... 49 4.2 Hardware ... 49 4.3 Architecture ... 50
4.3.1 Key modules of the architecture ... 52
4.3.1.1 Corpus creation: scraping and preprocessing ... 52
4.3.1.2 Text preprocessing ... 52
4.3.1.3 Training and saving the models ... 52
4.3.1.3 Database ... 53
4.4.1 Vectorization models ... 55
4.4.2 Pre-trained models ... 56
4.5 Search and Semantic systems in practice ... 57
4
4.5.1.1 Extracting embeddings ... 58
4.5.1.2 Building the index, time by launch ... 58
5 RESULTS ... 59
5.1 Results ... 59
5.2 Conclusions ... 60
About similarity of words ... 60
About similarity of sentences ... 60
About similarity matching by index ... 64
6 CONCLUSIONS ... 67
6.1 Future Work ... 68
5
Figures
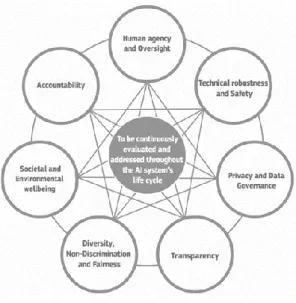
Figure 1. Ethics guidelines for trustworthy AI by the European Union 11
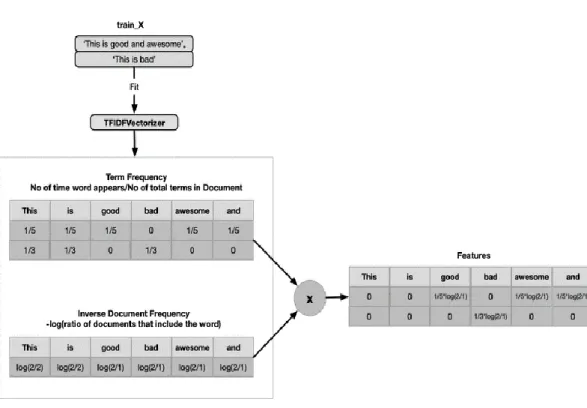
Figure 2. TF-IDF Architecture 13
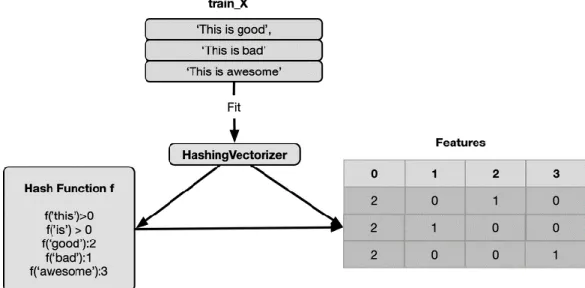
Figure 3. Hashing Architecture 14
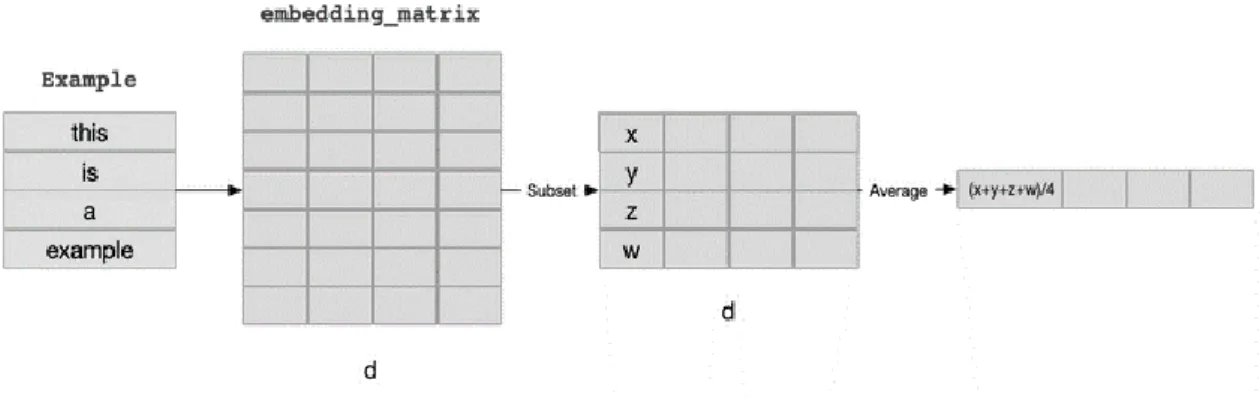
Figure 4. Representation of word embedding 15
Figure 5. CBOW Neuronal Network 16
Figure 6. Skip-gram Neuronal Network 16
Figure 7. PV-DM Neuronal Network 17
Figure 8. PV-DBOW simplified 17
Figure 9. gloVE storage of the information concurrency 18
Figure 10. Overview of Text Similarity Measure 22
Figure 11. Cosine similarity equation 23
Figure 12. Cosine similarity with Euclidean distance equation 23
Figure 13. Soft-Cosine similarity equation 24
Figure 14. Sample Cosine and Soft-Cosine similarities 24
Figure 15. LSA workflow 25
Figure 16. Example: Matrix data Transformation using LSA 26
Figure 17. Distribution of collecting data by country and standard
Guideline 31
Figure 18. GRI Guidelines distribution 33
Figure 19. Distribution of Guidelines by length and number of words 35
Figure 20. Top frequently words on Guidelines 36
Figure 21. Top frequently bigrams on Guidelines 36
Figure 22. Top frequently trigrams on Guidelines 37
Figure 23. Frequently of part of speech on Guidelines 38
Figure 24 Text sample of Standard 305_1 39
Figure 25 Distribution of the text by length and number of words of
6
Figure 26. Distribution of Top trigrams of GRI-305 and Skatkraft 40
Figure 27. Applying word2vec to a Standard 33 Corpus 41
Figure 28. LDA for GRI – 305 42
Figure 29. LDA for Statkraft 42
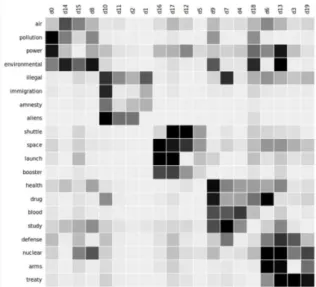
Figure 30. Terms associations between GRI-305 and Skatkraft 44
Figure 31. Terms associations between GRI-305 and Skatkraft trough F-score 44
Figure 32. High-level solution architecture for the text semantic search system 52
Figure 33. DataBase 54
Figure 34. Snippet of index matching 56
Tables
Table 1. The intermediate form 11
Table 2. Topic #0 for GRI-305 and Skatkraft 43
Table 3. Design of executions 57
Table 4. Similarity by words 61
Table 5. Similarity by sentences 63
Table 6. Top 10 semantic similarity 63
Table 7. Top 10 index matching 65
Table 8. Top 10 semantic similarity by countries 66
Table 9. Top 10 index matching by countries 67
8 1 INTRODUCTION
The objective of this research is to evaluate the degree of affinity that Nordics companies’ report published under the Global Reporting Initiatives (GRI) framework have. The grade of affinity will be the result of the combination of two text mining methods. Therefore this work implement Natural Language Processing (NLP) and Information Retrieval (IR) methods in order to obtain the semantic similarity and matching disclosures respectively. The combination of this methods can give us somewhat clues to know which documents are following GRI guidelines and to what degree.
Currently, the Corporate Social Responsibility reports (CSR), whose most important referent is the GRI standards, are considered as a decision investment factor comparable to the company's financial statements. The CSR not only represent companies' commitment to Environmental, Social and Governance (ESG) practices, or engagement to the UN 2030 agenda, the CSR is a benchmark of the real economic health of a company in long-term. (Servaes et al., 2017). Even in many stock markets in emerging countries1, the submission of these reports is periodic and mandatory. It is estimated that the lack of regulation and consensus of these frameworks creates a gap of USD 12 billion of direct investment on sustainability2. Complying with these frameworks is voluntary and does not require much detail, the majority of reports are presented in an unstructured way and therefore there is no other alternative than to use text mining techniques for extract some knowledge of them.
Since the GRI framework removed the rating that was weighted on these documents from the G4 versions, we ran into an Unsupervised Learning challenge. In this way we begin to implement text mining methods to extract the degree of semantic similarity that the texts published by the companies have under the guidelines published by the GRI institution. GRI is the entity in charge of promoting, maintain and modify these standards. New models were trained and pretrained models were implemented, a methodology for evaluating words, sentences from different abstractions of the text, corpus and hybrids was developed.
1.1 Motivation and theoretical framework
Over recent years, corporations have begun to focus on the corporate social responsibility (CSR) concept, particularly on one of its central platforms – the notion of sustainability and sustainable development. Despite the fact that several researchers have discovered conflicting results between Corporate Social Investments and Corporate Financial Performance (CFP) (Griffin et al, 1997), there is increasing proof that Environmental, Social and Governance (ESG) factors, may deliver significant long-term performance advantages when incorporated into portfolio investment analysis (Wang, et al, 2016). It is, therefore, important for CSR companies to effectively communicate their economic and ESG performance to their stakeholders. There are several guidelines issued by different organizations for CSR reporting; the most important are Global Reporting
1 In October of 2019 a coalition of asset managers, public pension funds, and responsible investment
organizations filed a petition (https://www.sec.gov/comments/4-711/4-711.htm) with the Securities Exchange Commission (USA) to request that it develop a compressive ESG disclosure framework.
9
Initiative (GRI), Global Compact Issued by UN and ISO 2600. For this study, we selected the GRI versions G3, G4 and GRI Standards. Also in several countries GRI are linked to local regulatory reporting requirements3 (KPMG, 2017). Since the number of companies and organization reporting their CSR activities is increasing, the current manual process of analyzing the reports demands a lot of effort (Aryal and Nabin, 2014) and is rapidly becoming obsolete.
According to Shahi et al., (2015) the automated CSR report analysis system has been overlooked by the research community, despite the fact that its text categorization and Machine Learning (ML) approach have been the subject of research since their early introduction, with the aim of solving various document analysis problems. Shahi et al., (2015) have produced the only work in this area, using the GRI G3 version. This version used a score grade ranging from A+ to C to measure the effectiveness of the Level Check which was removed from the framework for the GRI G4 version. Presently, a company has two options, or levels, for reporting “in accordance with” the GRI guideline – core
and “comprehensive” reports. The most substantial difference between a core and a comprehensive report are the number of governances and strategy disclosures. Due to this development, comparing the accuracy of classification is now more difficult. Nevertheless, we can choose to conduct our study in a qualitative method (Wilson and Rayson, 1993). This includes the compilation and classification of quantitative and qualitative data into the GRI guidelines in order to discover similarities within the scope selected (Guthrie & Abeysereka, 2006).
To the best of our knowledge, previous work has never included characteristics of CSR reports in G4 and new standards. This implementation or adaption could increase the value of the evidence that is used to demonstrate the importance that the market places on EGS activities that are captured in a non-systematic way. Therefore, due to the current state of the literature review regarding the implementation of ML to valuate ESG activities, we believe it is important to produce a work that has the ability to discover and analyze the relationship of the GRI reports published by the companies with the GRI official guidelines through text mining.
1.2 Limitations
This work is limited only to the context of Nordic Companies that have published on the GRI reports Database using English language.
The final solution designed is mostly an implementation of the tools already built for the application of machines learning techniques, as they are. We do not make an improved or deep review of the available tools.
1.3 Ethical considerations
About the data, the data we used in this work is in the public domain. Companies submitted this report voluntarily.
3 KPMG Survey of Corporate Responsibility Reporting provides a very useful insight into the recent
trends in CSR reporting. KPMG started publishing such report from 1993.
10
About the results, the models that are created for this proposal will be available for later revisions in order to confirm the veracity of the results.
About the models, we will ensure that Artificial Intelligence model will behave in a way that prioritizes human safety above their assigned tasks. And their own safety and that are also in accordance with accepted precepts of human morality. See Figure 1.
Figure 1. Ethics guidelines for trustworthy AI by the European Union. (Reprinted: https://ec.europa.eu/futurium/en/ai-alliance-consultation/guidelines/1)
1.4 The structure
After this introductory section, we will describe the fundamentals of the related tools and their state of the art in Chapter 2. In the third chapter, the environment of the problem is examined in more detail, we will apply Exploratory Data Analysis to obtain a more adjusted vision for the development of the models to implement. The technical and design details of the models, both parameterization, architecture, and execution capacity of the system are revealed in chapter 4. The results of the executions are examined in section 5. Finally, the conclusions and certain suggestions for improvement of this work are made in Chapter 6.
11
2 FUNDAMENTALS AND LITERATURE REVIEW 2.1 Text Mining
The concept of Text Mining (TM) is still under discussion. But for our research we can define as the process of extracting knowledge or patterns, previously unknown, non-trivial and interesting (potentially ‘useful’) and understandable by humans from unstructured text sources. Text Mining or knowledge discovery text (KDT), first introduced by Feltham et al., (1995), is an extension of Data Mining (DM) that seeks to extract useful and important information from text. We have to be careful not to think that the classical DM techniques can be directly applied to textual information. DM works with databases with a known scheme e.g. Relational DataBase. Each text document is an ordered collection of words and separators with meaning associated, whose the location in the text is determined by synthetic and semantic constraints. There are semi-structured texts such as documents written in XML or JSON. In TM the data is:
Inherently unstructured o Implicit structure
o Much greater richness than in structures cases Ambiguous
Multilingual
This absence of structure is the biggest problem of TM and implies the need to pre-process the texts, to move them to an intermediate form (Allahyari et al., (2017).
2.2 Text representation and encoding
In order to apply text mining it is necessary to represent the content of the documents by a model. One of the most simple but effective and commonly used ways to represent text is using the bag of words (BOW), which considers the number of occurrences of each term (word/phrase) but ignores the order. When using this representation, we discard most of the structure of the input text, like chapters, paragraphs, sentences, and formatting, and only count how often each word appears in each text in the corpus.
This representation leads to a vector representation that can be analyzed with dimension reduction algorithms from machine learning and statistics. Three of the main dimension reduction techniques used in text mining are:
Latent Semantic Indexing (LSI) (Dumais et al., 1995),
Probabilistic Latent Semantic Indexing (PLSA) (Hofmann, 1999) and Topic models LDA (Blei and Jordan, 2003).
Over a long time, most techniques used to research text mining problems used shallow machine learning models and hand-crafted features (high-dimensional features). However, with the recent popularity and success of word embedding’s implemented in Word2vec (Mikolov et al., 2013) low dimensional, distributed representations and deep learning methods (Socher et al., 2013), have achieved superior results on various language-related tasks as compared to traditional machine learning models.
12
Collbert et al., (2011) as cited in Young et al., (2018) demonstrated how a simple deep learning framework outperforms most approaches in several Natural Language Processing (NLP) tasks such as semantic role labeling (SRL), named-entity recognition (NER), and POS tagging. Since then, numerous complex deep learning based algorithms have been proposed to solve difficult NLP tasks.
2.2.1 Text Preprocessing.
The steps involved in a traditional text mining preprocessing comprises:
Tokenization: Tokenization is the process of dividing a text document (or a collection of them) into the list of words that make it up, by identifying, for example, blank spaces or punctuation marks on. This step is essential in the subsequent analysis since we are going to use vector space models, in which the words are the basic elements.
Filtering: This stage consists of the elimination of the words that do not have interest for the mining of texts, such as articles, pronouns, prepositions, conjunctions, and even words that are used very frequently and do not help the differentiation from one document to another.
Lemmatization and Stemming: At these stages, it is assumed that the meaning of the words is not influenced by the grammatical form it presents. Stemming is the process of heuristically removing parts of a word to reduce it to a common form. For its part, lemmatization refers to a more complex process that uses a syntactic analysis, as well as morphological analysis of structures. Therefore, one of the effects of these stages is to reduce the number of words that will appear in our dictionary.
2.2.2 Text-Transformation.
The Intermediate Form (See Table 1) is a model of knowledge representation capable of expressing the implicit content of the text in a computable form by means of an algorithm or a program. The technique for obtaining the intermediate form determines the type of information to be obtained in the discovery process (de la Torre, 2005).
Table 1. The intermediate form
Pre-processing Representation Discovery
Categorization Vector of representative terms
Relationship between terms
Full Text Analysis Sequences of words Language Patterns
Information Extraction Database table Relationships between entities
2.2.2.1 Bag of Words (BOW)
The representation of the text as words is, in the end, a feature engineering or feature engineering task. According to Domingos (2012) and the general literature, in this area,
13
each individual property of an observed phenomenon is called a characteristic, that is, each input variable in a machine learning algorithm. Many learning models obtain good results and others, on the contrary, do not, and the difference between them is the most important factor: the extraction of these characteristics.
Feature extraction is an essential process in a machine learning model that involves creating the input features for a something-rhythm to work. The main idea of this model is obtained from its own name, "word bag", and it is to transform each word into a number so that the input of the classification algorithm is a vector of numbers, a bag of words, in which each position is a word of the text to classify.
There are two possible ways to carry out this transformation: transform into a vector of occurrences or transform into a vector of frequencies. The reason it is called a bag is that it does not take into account the meaning of each word or its context, that is, it takes each word as an independent number and only takes into account whether or not the word appears in the text. This is one of the main disadvantages of the model, since considering the semantics of words can benefit the result. Another possibility, widely used and perhaps the most powerful, is the use of n-grams, an n-gram being a sequence of elements.
2.2.2.2 Skip-gram
Mikolov (2013) introduced another variant of BOW, Skip-gram, which uses the same architecture but in a contrary way, tries to predict the context based on the word that is to be represented, producing this representation in the process (See Figure 6).
A priori it may seem like you have scattered vectors again, but this is only at the input. The strength of this model is in the weight matrix. When multiplying the input vector by the weight matrix, the result is the vector of the element that has a one, since the rest are zeros. Thus, you have completely dense vectors.
2.2.2.3 Transformation into inverse frequency vector TF-Idf
Inverse document frequency TF-Idf is a numerical measure found from a set of documents
D for a term t in a document d ∈ D, which expresses how relevant t is to document d
depending on the set of documents. t may consist of one or more consecutive words ( n-gram) of d.
The TF-Idf value increases proportionally to the number of times a word appears in the document, but is compensated for by the frequency of the word in the document collection, which allows for handling the fact that some words are generally more common than others. During the text we call "model", with the same name, referring the group of these measures calculated and ordered from the data and with certain training criteria, along with other attributes or meta-data generated.
14
TF-Idf is a simple technique to find features from sentences. In the Figure 2, let’s consider two things about any word from a document:
Figure 2. TF-IDF Architecture. (Reprinted:
https://mlwhiz.com/blog/2019/02/08/deeplearning_nlp_conventional_methods/)
As we can see in the Figure 2, TF-IDF then is just multiplication of these two scores. Intuitively, One can understand that a word is important if it occurs many times in a document. But that creates a problem. Words like “a”, “the” occur many times in sentence. Their TF score will always be high. We solve that by using Inverse Document frequency, which is high if the word is rare, and low if the word is common across the corpus.
2.2.2.4 Hashing Features
When we are manipulating a large number of sentences or words in a document corpus. One way to resolve to mitigate risks of memory collapse is by utilizing the Hashing representations.
15
The hash feature is a string of numbers and letters of fixed length and in a unique and unrepeatable order that represent a series of data. In the Figure 3, this string is created by a unique cryptographic function known as a hash function.
Figure 3. Hashing Architecture. (Reprinted:
https://mlwhiz.com/blog/2019/02/08/deeplearning_nlp_conventional_methods/)
With the hashing function we can get the index of any word, rather than getting the index from a dictionary.
2.2.2.5 Word embedding
Word embedding is an approach to distribution semantics that represents words as real number vectors (See Figure 4). Such a representation has useful grouping properties, since it groups words that are semantically and syntactically similar. For example, we hope that the words “Samsung” and “Xiaomi” are close, but “Xiaomi” and “dolphin” are not close since there is no strong relationship between them. Therefore, the words are represented as vectors of real values, where each value captures a dimension of the meaning of the word. This causes semantically similar words to have similar vectors. In a simplified way, each dimension of the vectors represents a meaning and the numerical value in each dimension captures the closeness of the association of the word with that meaning. Word embedding are a series of approaches that seek to represent text taking into account the context of words through “dense” vectors, that is, they solve the problem of the bag-of-words model that used scattered vectors, since each vector represented all the vocabulary words and most of their elements are zeros, since the texts only include some words.
16
Figure 4. Representation of word embedding. (Reprinted: https://mlwhiz.com/blog/2019/02/08/deeplearning_nlp_conventional_methods/)
The term word embedding was originally conceived by Bengio et al., (2003) who trained this type of vectors in a probabilistic neuronal model. However, Collobert and Weston were possibly the first to demonstrate the power of word embeddings in their paper A unified architecture for natural language processing published in 2008, in which they establish word embeddings as a highly effective tool for different types of tasks, and present a neural network architecture on which many of the current approaches are based.
2.2.2.6 Sentence Embedding
Words combine in order to produce units of discourse: an utterance. Words do not 'carry' or encode meaning. Rather, meaning is a property associated with a complete utterance. Utterances do not exist in written language, only their representations do. For written language, the closest concept to utterance is sentence, knowing that they are not the same thing (Evans, 2006). Many successful models have been developed for sentence semantic embedding or sentence dense vector representation. However, most of such techniques use deep learning techniques on very large text corpus; and, in many cases, reuse the word vectors as input to such deep learning models. Example of these deep learning techniques are convolutional neural network (Collobert et al., 2011), recurrent neural networks (Mikolov et al., 2017) using many architectures like long-short term memory (LSTM) (Gers et al., 2000), bidirectional LSTM (Graves and Schmidhuber, 2005) and Gated Recurrent Units (GRU) (Kiros et al., 2015). All of such neural networks are mainly used to learn the dense vector representation or the semantic features of the sentence in an unsupervised learning approach.
Sent2Vecis one of the recent practical open-source models that has performed very well in semantic similarity tasks (Pagliardini et al., 2018). Sent2Vec, was used by Microsoft Research for one of their sentence embedding models that performs the mapping using the Deep Structured Semantic Model (DSSM) proposed in (Huang et al., 2013), or the DSSM with convolutional-pooling structure (CDSSM) (Shen et al., 2014) (Gao et al., 2014). But is Doc2Vec from Mikolov’s (Mikolov et al., 2017) who extends the idea of
17
Sent2Vec. Doc2Vec learns a randomly initialized vector for the document along with the words, (document could be a sentence).
2.3 Methods of generating meta-embeddings
Since word2vec in 2013 started to popularize word embeddings, a lot of different methods to generate word embeddings have emerged. In this section we will present the word embeddings that we will later use in the comparisons. We have chosen the best known word embeddings for analysis, as well as some that have been interesting to us, either because of their performance or because they are very different from the rest of the word embedding methods. These word embedding methods are usually accompanied by pre-calculated vectors that we will use for evaluation and will also describe during the section.
2.3.1 Word2vec
The Word2Vec model developed by Mikolov et al., (2013b), a group of Google engineers, which caused a drastic change from previous models thanks to the increase of the efficiency of training with neural networks. It is a predictive model for generating word embeddings. The Distributional Hypothesis is the main idea behind Word2Vec
Figure 5. CBOW Neuronal Network Figure 6. Skip-gram Neuronal Network
(Reprinted: (Gupta et al., 2016)) (Reprinted: (Gupta et al., 2016))
Word2Vec implements two neural models: CBOW and Skip-gram (See Figure 5 and 6). In the first one, given the context of the target word, it tries to predict it. In the second, given the word, it tries to predict the context. The internal layers of the neural network encode representation of the target word, i.e. the word embeddings. In this study we will use the vectors trained in the Google News dataset with about 100 billion words. The model contains 300 dimensional vectors for 3 million words and phrases. The vectors used are available at the following address: https://code.google.com/archive/p/ word2vec/.
18 2.3.2 Doc2Vec
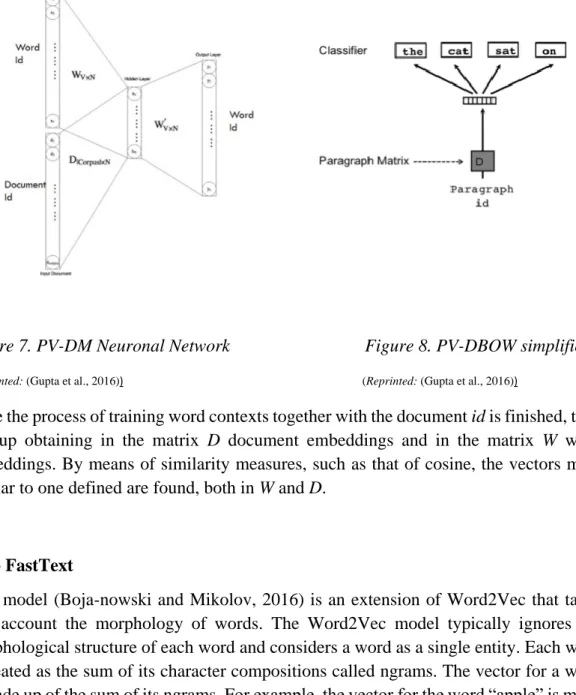
Paragraph vector or Doc2Vec (Le and Mikolov, 2014) applies very similar methodology of Word2Vec (Skip-gram and CBOW models) using the frequent neighbouring words to predict the document features and vice versa. Doc2Vec therefore has two algorithms to obtain the embeddings: DM (Paragraph Vector - Distributed Memory) and PV-DBOW (Paragraph Vector - Distributed Bag of Words). Each one arises from the extension of the above mentioned wor2vec algorithms, respectively. In other words, PV-DM is an adaptation from word2vec's CBOW, and PV-DBOW is from Skip-gram. (See Figure 7 and 8)
Figure 7. PV-DM Neuronal Network Figure 8. PV-DBOW simplified
(Reprinted: (Gupta et al., 2016)) (Reprinted: (Gupta et al., 2016))
Once the process of training word contexts together with the document id is finished, they end up obtaining in the matrix D document embeddings and in the matrix W word embeddings. By means of similarity measures, such as that of cosine, the vectors most similar to one defined are found, both in W and D.
2.3.3 FastText
This model (Boja-nowski and Mikolov, 2016) is an extension of Word2Vec that takes into account the morphology of words. The Word2Vec model typically ignores the morphological structure of each word and considers a word as a single entity. Each word is treated as the sum of its character compositions called ngrams. The vector for a word is made up of the sum of its ngrams. For example, the vector for the word “apple” is made up of the sum of the vectors for the ngrams “<ap, app, appl, apple, apple>, ppl, pple,
19
pple>, ple, ple>, le>”. In this way, it is expected to obtain better representations for "rare" words, which have very few appearances in corpus of texts, and thus be able to generate vectors for words that are not in the vocabulary of word embeddings.
2.3.4 gloVE
The gloVE (Global Vectors) model, an unsupervised learning algorithm that obtains representations of words in vectors through statistics of co-occurrence. gloVE unlike Word2Vec is a count based model. gloVE generates a large matrix where the information of the concurrency between words and contexts is stored (See Figure 9). That is, for each word we count how many times that word appears in some context. The training objective of this matrix is to learn vectors so that the scalar product between the words is equal to the logarithm of the probability of co-occurrence between the words. The number of contexts is very high, therefore a factorization of said matrix is performed to obtain a smaller one. Thus obtaining a vector that represents each of the words. The advantage of gloVE over Word2Vec is that it is easier to parallelize the training, therefore it is possible to use more information during the training. Therefore it is possible to use more data during training.
Figure 9. gloVE storage of the information concurrency
(Reprinted: https://nlp.stanford.edu/projects/glove/)
2.4 Text-Mining Methods 2.4.1 Text Mining Approaches
Information Retrieval (IR): Information Retrieval is the activity of finding information resources (usually documents) from a collection of unstructured data sets that satisfies the information need (Manning et al., 2008).
Natural Language Processing (NLP): Natural Language Processing is sub-field of computer science, artificial intelligence and linguistics which aims at understanding of natural language using computers (Manning et al., 1999).
Information Extraction from text (IE): Information Extraction is the task of automatically extracting information or facts from unstructured or semi-structured documents (Cowie and Lehnert, 1996).
20
Text Summarization: Many text mining applications need to summarize the text documents in order to get a concise overview of a large document or a collection of documents on a topic. (Radev et al., 2002).
Unsupervised Learning Methods: Unsupervised learning methods are those in which we do not have a pool of previously classified examples, but only from the properties of the examples we try to give a grouping (classification, clustering) of the examples according to their similarity. They are techniques trying to find hidden structure out of unlabeled data. They do not need any training phase, therefore can be applied to any text data without manual effort.
Supervised Learning Methods: Supervised classification systems are those in which, from a set of classified examples (training set), we try to assign a classification to a second set of examples. Supervised learning methods are machine learning techniques pertaining to infer a function or learn a classifier from the training data in order to perform predictions on unseen data. (Sebastiani, 2002).
Probabilistic Methods for Text Mining: There are various probabilistic techniques including unsupervised topic models such as probabilistic Latent semantic analysis (pLSA) (Hofmann, 1999) and Latent Dirichlet Allocation (LDA) (Blei and Jordan, 2003), and supervised learning methods such as conditional random fields that can be used regularly in the context of text mining.
Sentiment Analysis: also known as opinion mining, It is a great challenge for language technologies, as obtaining good results is much more difficult than many believe. The task of automatically classifying a text written in a natural language into a positive or negative feeling, opinion or subjectivity (Bo and Lee, 2008), is sometimes so complicated that it is even difficult to agree on different human notebooks about the classification to assign to a given text. With the advent of e-commerce and online shopping, a huge amount of text is created and continues to grow about different product reviews or users opinions.
2.5 Evaluation of word embeddings
The methods of evaluation of recordings can be grouped into large groups, extrinsic methods and intrinsic methods.
2.5.1 Extrinsic evaluation methods
Extrinsic evaluation methods are based on the ability of a word embedding to be used as vectors of characteristics of supervised self-learning algorithms used in various NLP tasks. The performance of the supervised method (usually measured in a dataset for NLP tasks) is taken as a measure of the quality of the word embedding. Some of the most common tasks in which word embeddings are evaluated are
1. Phrase name extraction. The objective is recognize nominal phrases and their limits within a sentence.
21
2. Entity name recognition. Recognize name of entities as names of organizations, persons, brands... within a sentence and its limits.
3. Sentimental analysis. A particular case of classification of texts, where a fragment must be marked with a binary tag reporting whether the text has positive or negative feeling towards something.
4. Syntax analysis superficial. Breakdown of sentences in groups (nominal sentences, verbal sentences, adjective sentences…).
5. Scope of denial. This is a text classification task. It is about identifying whether a specific action in a sentence determines denial or not.
2.5.2 Intrinsic evaluation methods
Intrinsic evaluation methods are experiments in which word embeddings are compared with human judgments about word relationships. Often manually created word sets are used, first the human evaluations are obtained and then these are compared with the word embeddings. Most intrinsic evaluation methods are designed to collect evaluations that are the result of conscious processes in the human brain. There are a large number of evaluation methods that fall under the heading of intrinsic methods, so we will focus on the most widely used, so-called conscious intrinsic evaluation methods. There are different tasks that are included within them:
1. Analogy of words. It is based on the idea that arithmetic operations in word vector space could be predicted by humans: given a set of three words, a, a* and b, the task is recognize such a word b* such that the relation b: b * is the same as the relation a: a *. "Paris is to France as Moscow is to Russia." The main criticism of this method is the lack of precise evaluation metrics.
2. Thematic adjustment. The method evaluates the ability of a model to separate different thematic roles from the arguments of a predicate. The idea is to find out how well word embeddings can find the most semantically similar noun for a certain verb used in a certain role. For humans, a certain verb might make a person expect that a certain role should be filled with a certain noun (for example, for the argument "I'm going to cut" the most expected argument in the object role is "cake").
3. Synonym detection. The objective is to evaluate the ability of a word embedding by stopping a word W and a series of words K=a1,a2,a3... to find the word K most similar to W.
4. Given a list of words the objective is to detect the anomalous word within the group. For example, given the words "pineapple, apple, cherry, orange, book, banana" the anomalous word is "book" because it is unrelated to the rest.
5. Semantic similarity between words: This is the popular method of evaluating word embeddings and is the method we are going to use to evaluate the word embeddings in the next chapters. The method is based on the idea that the distances between words in a word embedding can be evaluated by human heuristic judgments about the actual distances between words. (For example, the distance between "cop" and "cup" could be defined in a range of 0.1 to 0.) The evaluator is given a series of words and is asked to evaluate the degree of similarity for each one. The more similar they are, the better the word embedding. This method dates back to 1965, when the first experience with human judgments on the semantic similarity of words was made to test the distribution hypothesis.
22
However, this method also receives some criticism, since there are conditions, linguistic, psychological and social, that can affect human judges, even fatigue after scoring a large number of word pairs can affect the score given. Another criticism of this method is that different experiments tend to give different semantic similarity definitions, for example some describe it as hyperonymy/hyponymy ("machine", "car") and others as synonymy ("car", "vehicle"). However, this method is the most popular for evaluating word embeddings.
There are several different data sets for evaluating word similarity. These can be grouped into two large groups, those that measure the semantic similarity of words, and those that measure the semantic relationship or association. These two concepts are different. Datasets that study word similarity generally capture synonymic relationships between words, sometimes also hyperonymic and hyponymic relationships. For example, the words "coast" and "coastline" are synonymous, so both in datasets where semantic similarity is studied and in those where semantic relationships are studied, they will appear with a very high score. On the other hand, the words "clothes" and "wardrobe" do not have any kind of synonymy or hyperonomy/hyponymy relationship, therefore, in datasets that study semantic similarity, they will have a very low score. However, both words have a great relationship with each other, since clothes are kept in closets, therefore in datasets that analyze the semantic relationship they will have a very high score.
2.6 Semantic Text Similarity 2.6.1 Overview
In the Figure 10 is a summary of the seminal work of Wael and Fhamy, (2013) and Dwi et. al, (2018) which make an exhaustive and detailed study of the different approaches have been promoted to measure the similarity between texts. Given the limited scope of our work, we will only mention the measures of similarity implemented in our research.
23
Figure 10. Overview of Text Similarity Measure
As can be seen in the table above, similarity measures are generally classified into four main groups. Of these, hybrid similarities are the ones that currently receive the most attention and popularity.
We will highlight three measures of similarity, which correspond to the approach of string, corpus and hybrid based, in order to provide robustness to our comparison that we will see in the following chapters.
2.6.2 Cosine similarity
Cosine similarity is a measure of similarity that is calculated between two non-zero vectors within the internal space of the product that measures the cosine of the angle Longest Common Subsequence
Damerau-Levenshtein Jaro Jaro-Winkler Needleman-Wunsch Smith-Waterman n-gram Block Distance Cosine Similarity Dice's Coefficient Euclidean distance Jaccard similarity Matching Coefficient Overlap Coefficient CL-LSA SOC-PMI DISCO1 DISCO2 res lin jcn Ich wup path vector
Hybrid similarities
this approach is to combine the previously described approaches,
including string-based, corpus-based, and knowledge-based similarity to reach a better metric
by adopt their advantages.
Soft Cosine similarity Normalized Google Distance (NGD)
Extracting DIstributionally Similar words using CO-occurrence (DISCO)
Knowledge-based
Is one of semantic similarity measures that bases on identifying the degree of similarity between words using information derived from semantic networks
Similarity Information Content Path Length Relatedness hso lesk T e x t S i m i l a r i t y M e a s u r e
String based
A string metric is a metric that measures similarity or dissimilarity
(distance) between two text strings for approximate string
matching or comparison
Character-based
Term-based
Corpus-based
Similarity between words according to information gained
from large corpora.
Hyperspace Analogue to Language (HAL) Latent Semantic Analysis (LSA) [27]
Explicit Semantic Analysis (ESA) Pointwise Mutual Information (PMI),
24
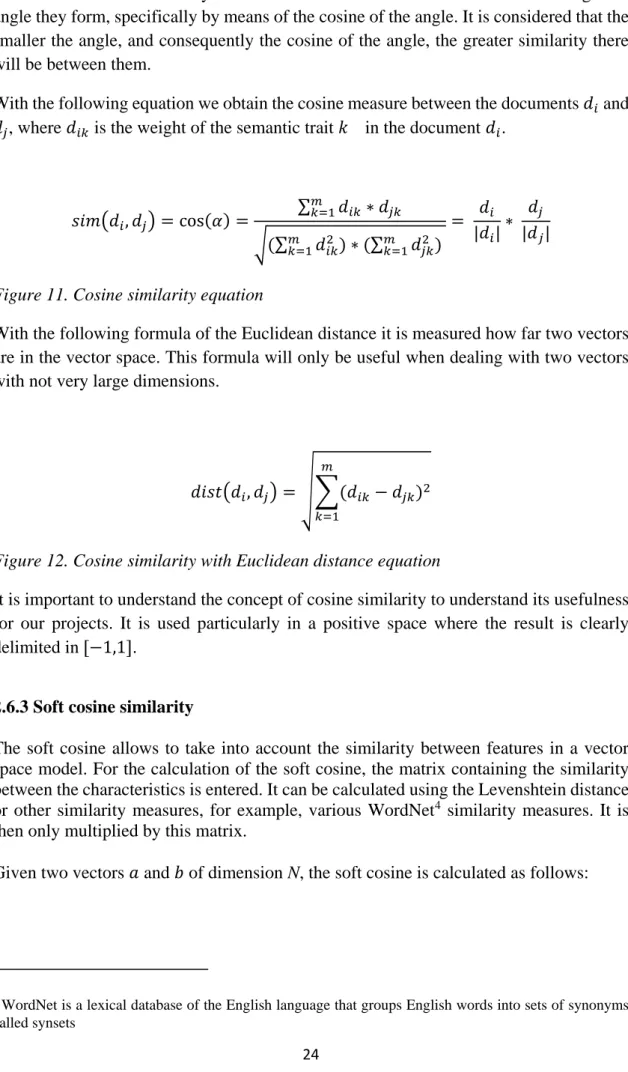
between them. The similarity between two word vectors can be obtained through the angle they form, specifically by means of the cosine of the angle. It is considered that the smaller the angle, and consequently the cosine of the angle, the greater similarity there will be between them.
With the following equation we obtain the cosine measure between the documents 𝑑𝑖 and
𝑑𝑗, where 𝑑𝑖𝑘 is the weight of the semantic trait 𝑘 in the document 𝑑𝑖.
𝑠𝑖𝑚(𝑑𝑖, 𝑑𝑗) = cos(𝛼) = ∑ 𝑑𝑖𝑘 ∗ 𝑑𝑗𝑘 𝑚 𝑘=1 √(∑𝑚𝑘=1𝑑𝑖𝑘2 )∗ (∑𝑚𝑘=1𝑑𝑗𝑘2 ) = 𝑑𝑖 |𝑑𝑖|∗ 𝑑𝑗 |𝑑𝑗|
Figure 11. Cosine similarity equation
With the following formula of the Euclidean distance it is measured how far two vectors are in the vector space. This formula will only be useful when dealing with two vectors with not very large dimensions.
𝑑𝑖𝑠𝑡(𝑑𝑖, 𝑑𝑗) = √∑(𝑑𝑖𝑘− 𝑑𝑗𝑘)2 𝑚
𝑘=1
Figure 12. Cosine similarity with Euclidean distance equation
It is important to understand the concept of cosine similarity to understand its usefulness for our projects. It is used particularly in a positive space where the result is clearly delimited in [−1,1].
2.6.3 Soft cosine similarity
The soft cosine allows to take into account the similarity between features in a vector space model. For the calculation of the soft cosine, the matrix containing the similarity between the characteristics is entered. It can be calculated using the Levenshtein distance or other similarity measures, for example, various WordNet4 similarity measures. It is then only multiplied by this matrix.
Given two vectors 𝑎 and 𝑏 of dimension N, the soft cosine is calculated as follows:
4WordNet is a lexical database of the English language that groups English words into sets of synonyms
25
𝑠𝑜𝑓𝑡_𝑐𝑜𝑠𝑖𝑛𝑒(𝑎, 𝑏) = ∑ 𝑠𝑖𝑗𝑎𝑖𝑏𝑗
𝑁 𝑖,𝑗
√∑ 𝑠𝑁𝑖,𝑗 𝑖𝑗𝑎𝑖𝑎𝑗 √∑ 𝑠𝑁𝑖,𝑗 𝑖𝑗𝑏𝑖𝑏𝑗
Figure 13. Soft-Cosine similarity equation
where 𝑠𝑖𝑗 = similarity(feature 𝑖, feature 𝑗).
If there is no similarity between characteristics (𝑠𝑖𝑗= 1, 𝑠𝑖𝑗= 0 for 𝑖 ≠ j), the given equation is equivalent to the conventional cosine similarity formula.
The complexity of this measure is quadratic, which makes it fully applicable to real-world problems. The complexity can even be transformed to linear.
Figure 14. Sample Cosine and Soft-Cosine similarities
To compute soft cosines, we need a dictionary (a map of word to unique id), a corpus (word counts) for each sentence and the similarity matrix.
2.6.4 Latent Semantic Analysis (LSA)
The LSA (Latent Semantic Analysis) also known as LSI (Latent Semantic Index) is a mathematical tool that analyzes semantic relationships between different linguistic units in a fully automated way (Landauer and Dumais, 1997). It was originally presented in 1990 as a method of information retrieval, to overcome the great limitations presented by search engines in databases, although later it has also been considered a model of acquisition and representation of knowledge.
The operation of this technique is as follows. The LSA processes the documents we are handling, which can be large, containing a large number of paragraphs and, ultimately,
26
information, giving rise to the linguistic corpus. Next, this corpus is represented by a matrix whose rows and columns contain, respectively, the different terms that appear in the corpus and the documents that we are considering. This matrix reflects the number of times each term appears in each document.
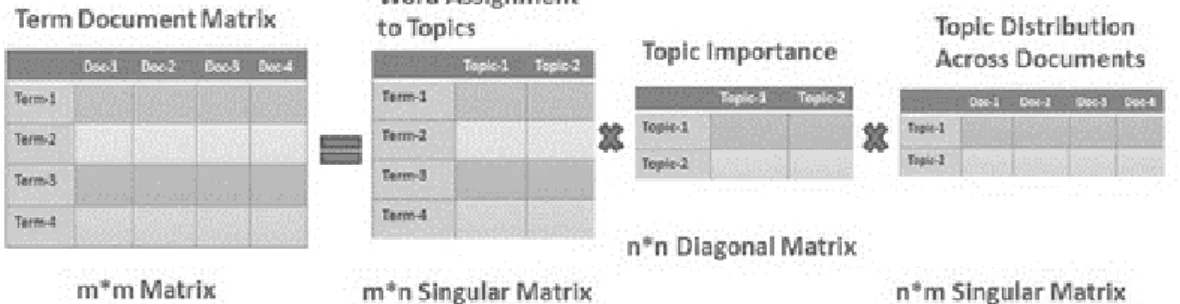
Figure 15. LSA workflow
Since we can assume that excessively frequent words do not discriminate the information in each document, the LSA weighs down the importance of notably more frequent words and increases the importance of moderately infrequent words. Next, apply to the obtained matrix the singular value decomposition algorithm (SVD)5 with the aim of reducing the dimension of the matrix with which we are working to a more manageable number (approximately 300), and without losing relevant information. The objective of applying the SVD is to weight each term based on its ability to represent a document. In addition, by means of this algorithm, the vector space with which we will work in the following will have been created and with all the advantages of working with a vector space (for example, the comparison of vectors using distances).
Whereas before applying the algorithm, the vectors were hollow vectors, the new vectors would not be so in general. This makes it possible to detect significant relationships between pairs of documents, even if those documents did not have common terms. The idea is that terms that have a similar meaning will be oriented in approximately the same direction in latent space.
On the other hand, the LSA presents the possibility of introducing into the space new vectors that represent texts that do not appear in the linguistic corpus that the LSA had analyzed, and that we call pseudo-documents (Landauer et al., 1998). The incorporation of the pseudo documents does not require recalculating the vector space, which is a great advantage. These pseudo documents will later be used to categorize terms and texts.
5The SVD is a specific form of factor analysis. In the starting matrix, terms and documents are mutually
dependent on each other, while, after applying the algorithm, these relationships appear broken down. The SDV decomposes the original matrix into the product of three new matrices T, D, and S, which contain the eigenvectors and eigenvalues. The eigenvalues, in turn, contain the variability information, in terms of terms and documents, explained by each dimension. The matrix T contains the information of the factors that have been determined by the analysis carried out.
27
Figure 16. Example: Matrix data Transformation using LSA, left side raw values, right side after applied LSA
2.7 GRI reports
The Corporative Social Responsibility (CSR) s is part of the Environmental Social and Governance (ESG) initiatives. This reports are created in order to satisfied the stakeholders demands and have to contain both qualitative and quantitative information to the extent which reveals how the company has improved its own economic, environmental and social effectiveness and efficiency in the reporting period and how the company has integrated these aspects into its sustainability management system. (KPMG, 2017) highlights “the necessity of balance between qualitative and quantitative information in sustainability reports when providing an overview of the company’s financial/economic, social/ethical, and environmental performance”. One of the most popular reporting and considering as the most excellent and worldwide acknowledged framework is the Global Reporting Initiative (GRI) (Issakson and Steimle, 2009); (Knebel and Seele, 2015). Currently, 93% of the 250 biggest companies report on their sustainability based on the GRI Guidelines (KPMG, 2017).
2.7.1 GRI versions
The development of GRI guideline generations is constantly in progress. From July 2018, a new generation called “GRI Standards” will replace GRI G4. One of the main differences is that now the GRI standard is going through to simplify the framework and avoid labelling the ESG commitment of the companies.
In GRI G3, the chapters on company profile and management approach were followed by the section of non-financial performance indicators, including 84 indicators in total. The 56 core and 28 additional indicators were further classified into economic indicators (7 core, 2 additional), environmental indicators (18 core, 2 additional), and social indicators (31 core, 14 additional). In the case of social indicators, four subcategories. Were identified: human rights, labour, product responsibility, and society. In the G3
28
system, companies could decide on different levels (A, B, or C), containing different amounts of core and additional indicators. The + sign indicated the independent third party assurance of the report (Knebel and Seele, 2015). This standard was observed for the use of an excessive amount of indicators (Knebel and Seele, 2015b) and that the guideline did not consider the synergies among different dimensions (Lozano–Huisingh, 2011).
In the case of GRI G4, there is no separation of core and additional indicators, while indicators have been further extended in number. This may cause problems in internal comparison with previous reports of the same company, when switching from G3 to G4 (Global Report Initiative, 2013). In addition, G4 includes further differences compared to G3. One of the central elements of G4 is materiality assessment–the function of which is to serve as an input for preparing the report –since its aim is to explore the main environmental, social and economic aspects relating to the activities of the company from the points of view of stakeholders and the company itself. The boundaries of reporting were redefined as well, resulting in a replacement of A, B, C classification by “in accordance” levels.
For the GRI Standards, an update of GRI G4, new requirements have been introduced in terms of corporate governance and impacts along the supply chain (Global Report Initiative, 2016). It is a change of format from GRI G4 which is made up of two documents to a compendium of 36 independent but interrelated documents. This new, more flexible structure aims to make is easier to use and to update (it will possible to update only one of the documents, without modifying the rest). The GRI standards do not include new aspects, but they do include certain changes in the way of reporting e.g. the difference between what is mandatory and what is a recommendation or orientation is now clearer, in the location of the aspects and in the indicators. The GRI standards is mandatory since July 2018.
2.7.2 Text Mining on GRI reports
The Corporative Sustainability Reports (CSR) are becoming increasingly important for the scientific community, especially in the study of methodology, definition and frequency (Kolk, 2004), (Kolk, 2003), (Bjørn et al., 2004). Also in the comparison of the different techniques used by companies from a qualitative point of view (Freundlieb and Teuteberg, 2013).
We will examine the content of CRS reports, focus on the GRI reports, in a more quantitative way through text mining techniques, e g. Liew et al., (2014) try to identify sustainability trends and practices in the chemical process industry by analyzing published sustainability reports. Székely et al., (2017) confirms previous research on a more widely with 9514 sustainability reports Yamamoto et al., (2017) develops a method that can automatically estimate the security metrics of documents written in natural language. This paper also extends the algorithm to increase the accuracy of the estimate. Chae and Park, (2018) study adopts computational content analysis for understanding themes or topics from CSR-related conversations in the Twitter-sphere and Benites-Lazaro, (2018) identify companies' commitment to sustainability and business-led governance.
29
The default technique used in previous investigations is LDA, but other techniques were also implemented such as unsupervised learning using the expectation-maximization algorithm for identify clusters and patterns. Tremblay and Gonzales (2015) that use an attractor network to learn a sequence series with the goal to predict the GRI scoring. Extensive attention has been paid to this topic for the works by Modapothala starting from statistical techniques (Modapothala, 2014), Bayesian (Modapothala, 2009), or multidiscriminatory analysis (Modapothala et al., 2013), for analysis of corporate environment reports.
Shahi and Modapothala, (2015) have produced a specific work in this area, using the GRI G3 version. This version used a score grade ranging from A+ to C to measure the effectiveness of the Level Check which was removed from the framework for the GRI G4 version. As such as Liu et al., (2017) make use of TF-idf method to obtain important and specific terms for further analytical algorithm and test with many shallow machine learning models.
30 3 METHODOLOGY
3.1 Overview
Since the last GRI framework was implemented, there is no record of the level of compliance that published reports have with current standards, therefore, there is no test information that we can use to validate text mining techniques. Henceforth, we are faced with an Unsupervised Learning Problem. In an unsupervised learning problems it is not possible to know which model or algorithm gives the best result on a data set without having previously experimented, so when choosing a model for a certain problem the only thing that can be done it is trial and error, that is, testing with different representations of the data set, different algorithms and different parameters of each algorithm, which is why a procedure must be followed.
In this instance, we need understand our data set. We will apply Exploratory Data Analysis (EDA) in order to design which algorithms would best suit our needs and environment. Carrying out a methodology allows planning and estimating the work to be done, preparing a development plan and focusing the focus on each of the phases independently.
3.2 Data Collection
The GRI standards database is publicly accessible, this database has more than sixty thousand reports stored, for our study we initially decided to focus on Finnish companies, but given the small volume that we had we decided to expand to all Nordic countries, that is, we download all reports using only country as filter parameter. In total, we have 450 reports where some were discarded because they were written in another language than English, leaving a total of 424 reports. Of which, as can be seen in figure 5, most correspond to Sweden and Finland.
Figure 17. Distribution of collecting data by country and standard Guideline
We can appreciate the volume of reports that belong to the last standard and that will be the framework studied, because as we will see later, it will be an important feature when evaluating these reports.
450
191 161 96 2 Sweden Denmark Finland Iceland31 3.3 Pre-processing
To normalize the extracted data, the texts were subjected to a default process of debugging and transformation of the texts. The task at hand is focused on cleaning the text of the data set to eliminate all irrelevant aspects or those that do not facilitate the performance of the model. This task is complicated and it is not possible to know if a modification to the text may affect the result of the model better or worse, so we will try to make it as simple as possible.
1. Normalization: the first step in this preprocessing is to normalize the text, that is, that different representations of the same word become a common representation. In this case, all words will be normalized to lowercase.
2. Elimination of repeated characters: it is common in texts that are not formal (such as in social networks) the repetition of the same characters in order to produce emphasis. In English there are no words that repeat the same character more than 2 times, so we correct all the words in which this situation occurs.
3. Correction of spelling errors: even eliminating repeated characters, in English there are many words that contain the same character twice, so it is not possible to eliminate all the characters that are repeated these times. If we remove the ones that are repeated the most, it could still happen that the word was spelled incorrectly with the same character repeated 2 times. For this reason, a spell checker will be used that, in addition to solving this problem, will correct misspelled words. Automatic spelling correction is a task still under study in the field of language processing, due to its complexity (if the word differs much from the correct one it is very difficult to correct it), which makes this correction not perfect. Therefore, a basic spell checker implementation is used to correct words in the simplest way possible.
4. Elimination of punctuation marks and non-alphanumeric characters: once all the words have been normalized, the text content that is not relevant to the problem is eliminated. Punctuation marks and other non-alphanumeric characters do not provide any information on this problem, so the following characters are removed from our documents:! "# $% & '() * +, -. / :; < =>? @ [\] ˆ _ '{|}.
5. Elimination of empty words: empty words are those common words that appear very frequently in the text and do not have any meaning or impact within it. These can be articles, prepositions, etc. In English, for example, the most common would be "the" or "is".
6. Stemming: stemming consists of reducing a word to an English common root form. The utility of this modification is that it allows to reduce the size of the vocabulary, identifying in the same way the different variations of the words. For example, if it is a review, the words “fishes” and “fishing” are found, both would be represented as “fish”. However, performing this step may cause the meaning of some words to be lost, as the different variations of the same words may cause different meanings. Furthermore, in the case of experimentation with the model Word2Vec, the
32
representation in the vector space of the words may have made the pre-trained model learn the different morphological variations of them. For these reasons, it will be experimented previously with the clean set without lemmatization and with the stemmed set to determine which one produces better results and use it in experimentation.
Because the reports we are using are generally unstructured, so it has been necessary to apply specific tasks to solve problems such as the absence of fields or the existence of incomplete data. Unfortunately the text preprocessing is not perfect and always can be improved, but it is considered that the reports have been well cleaned and that going deeper into it would remove the focus from the objective of the work.
3.4 EDA
It has already been explained previously that the problem that we face using text mining methods is to represent the text in such a way that an algorithm can interpret it, e.g. in all machine learning models one of the main tasks prior to experimentation is the preparation of the data.As it is a UL problem, we need to build our methodology by experimenting a little, to identify the limits and best options that could be adjusted to our problem, which is why we will apply the following method:
3.4.1 Exploratory Data Analysis (EDA)
The Exploratory Data Analysis (EDA) is an approach to the study of data collections, mostly utilizing visual methods, to summarize their key characteristics. Instead of jut apply statistical descriptive functions, EDA can help us for seeing what the data can tell us beyond the formal modelling or hypothesis testing task. EDA can show us hidden relationships and attributes present in our data even before we throw it at a text mining model.
Dataset description.
We have two important tables, that of the companies (see Fig. 5) and that of the guidelines. The guidelines database are the result of the extraction of the embedded text in pdf documents (see chapter 4).
These GRI guidelines are distributed as follows6:
33
GRI 102: General Disclosures 2016 Organizational profile
102-1: Name of the organization
102-2: Activities, brands, products, and services
102-3: Location of headquarters 102-4: Location of operations 102-5: Ownership and legal form 102-6: Markets served
102-7: Scale of the organization
102-8: Information on employees and other workers 102-9: Supply chain
102-10: Significant changes to the organization and its supply chain 102-11: Precautionary Principle or approach
102-12: External initiatives
102-13: Membership of associations Strategy
102-14: Statement from senior decision-maker 102-15: Key impacts, risks, and opportunities
Ethics and integrity
102-16: Values, principles, standards, and norms of behavior
Governance
102-18: Governance structure
102-22: Composition of the highest governance body and its committees
102-23: Chair of the highest governance body
102-24: Nominating and selecting the highest governance body 102-32: Highest governance body’s role in sustainability reporting
102-38: Annual total compensation ratio
102-39: Percentage increase in annual total compensation ratio
Stakeholder engagement
102-40: List of stakeholder groups 102-41: Collective bargaining agreements 102-42: Identifying and selecting stakeholders
102-43: Approach to stakeholder engagement
102-44: Key topics and concerns raised
Reporting practice
102-45: Entities included in the consolidated financial statements 102-46: Defining report content and topic Boundaries 102-47: List of material topics
102-48: Restatements of information
102-49: Changes in reporting
102-50: Reporting period 102-51: Date of most recent report 102-52: Reporting cycle
102-53: Contact point for questions regarding the report
102-54: Claims of reporting in accordance with the GRI Standards
102-55: GRI content index
102-56: External assurance
Series 200: Economic Topics Economic Performance
GRI 103: Management Approach 2016
103-1: Explanation of the material topic and its Boundary 103-2: The management approach and its components 103-3: Evaluation of the management approach
GRI 201: Economic Performance 2016
201-1: Direct economic value generated and distributed
User defined disclosures
G4 NGO Sector Disclosure: Ethical Fundraising Series 400: Social Topics Employment
GRI 103: Management Approach 2016
103-1: Explanation of the material topic and its Boundary
103-2: The management approach and its components
103-3: Evaluation of the management approach
Figure 18. GRI Guidelines distribution
GRI 401: Employment 2016
401-1: New employee hires and employee turnover
Training and Education
GRI 103: Management Approach 2016
103-1: Explanation of the material topic and its Boundary
103-2: The management approach and its components
103-3: Evaluation of the management approach
GRI 404: Training and Education 2016
404-1: Average hours of training per year per employee
404-3: Percentage of employees receiving regular performance and career development reviews User defined disclosures
G4 NGO Sector Disclosures: Mechanisms for workforce feedback and complaints and their resolutions
Diversity and Equal Opportunity
GRI 103: Management Approach 2016
103-1: Explanation of the material topic and its Boundary
103-2: The management approach and its components
103-3: Evaluation of the management approach
GRI 405: Diversity and Equal Opportunity 2016
405-1: Diversity of governance bodies and employees
Other Topics
Fostering Effective Collaboration with other Organizations
Management Approach
103-3: Evaluation of the management approach
103-1: Explanation of the material topic and its Boundary
103-2: The management approach and its components Custom Disclosures
Driving Better Sustainability Reporting
Management Approach
103-3: Evaluation of the management approach
103-2: The management approach and its components
103-1: Explanation of the material topic and its Boundary Custom Disclosures
Improving Performance through Sustainability Reporting
Management Approach
103-3: Evaluation of the management approach
103-2: The management approach and its components
103-1: Explanation of the material topic and its Boundary Custom Disclosures
Harmonizing the Sustainability Reporting Landscape
Management Approach
103-3: Evaluation of the management approach
103-2: The management approach and its components
103-1: Explanation of the material topic and its Boundary
34
The GRI guidelines consist on 169 disclosures grouping in 37 Standards (See Appendix A). This guidelines contain information about the minimal technical information that need to be provide by the companies. The companies itself determine if they accomplish or not this requirements.
3.4.2 Descriptive analysis of the dataset
Next we will show some characteristics of the dataset that we are manipulating. 3.4.2.1 N-Grams distribution
Distribution of the text by length and number of words:
Figure 19. Distribution of Guidelines by length and number of words
Standard 22, 10 and 16 stand out as greater containers of words and therefore with greater length of text. Now let's see which words are the most frequent by n-grams, implemented stop words
35
Figure 20. Top frequently words on Guidelines
It becomes evident, the necessity that the use of stopwords makes necessary for the interpretation.
The distribution of top bigrams before removing stop words
Figure 21. Top frequently bigrams on Guidelines