n engl j med 356;22 www.nejm.org may 31, 2007 2257
original article
Surgical versus Nonsurgical Treatment
for Lumbar Degenerative Spondylolisthesis
James N. Weinstein, D.O., Jon D. Lurie, M.D., Tor D. Tosteson, Sc.D., Brett Hanscom, M.S., Anna N.A. Tosteson, Sc.D., Emily A. Blood, M.S., Nancy J.O. Birkmeyer, Ph.D., Alan S. Hilibrand, M.D., Harry Herkowitz, M.D., Frank P. Cammisa, M.D., Todd J. Albert, M.D., Sanford E. Emery, M.D., M.B.A.,
Lawrence G. Lenke, M.D., William A. Abdu, M.D., Michael Longley, M.D., Thomas J. Errico, M.D., and Serena S. Hu, M.D.*
From the Departments of Orthopaedics (J.N.W., B.H., E.A.B., W.A.A.), Medicine (J.D.L., A.N.A.T.), and Community and Family Medicine (J.N.W., T.D.T., A.N.A.T.), Dartmouth Medical School, Lebanon, NH; the University of Michigan, Ann Arbor (N.J.O.B.); the Rothman Institute at Thomas Jefferson University, Philadelphia (A.S.H., T.J.A.); William H. Beaumont Hos-pital, Royal Oak, MI (H.H.); the Hospital for Special Surgery, New York (F.P.C.); the University Hospitals of Cleveland and Case Western Reserve University, Cleve-land (S.E.E.); Washington University, St. Louis (L.G.L.); the Nebraska Foundation for Spinal Research, Omaha (M.L.); the Hospital for Joint Diseases, New York (T.J.E.); and the University of California at San Francisco, San Francisco (S.S.H.). Address reprint requests to Dr. Weinstein at SPORT@dartmouth.edu.
*Other investigators participating in the Spine Patient Outcomes Research Trial (SPORT) are listed in the Appendix. N Engl J Med 2007;356:2257-70. Copyright © 2007 Massachusetts Medical Society.
ABS TR ACT
BACKGROUND
Management of degenerative spondylolisthesis with spinal stenosis is controversial. Surgery is widely used, but its effectiveness in comparison with that of nonsurgical treatment has not been demonstrated in controlled trials.
METHODS
Surgical candidates from 13 centers in 11 U.S. states who had at least 12 weeks of symptoms and image-confirmed degenerative spondylolisthesis were offered en-rollment in a randomized cohort or an observational cohort. Treatment was stan-dard decompressive laminectomy (with or without fusion) or usual nonsurgical care. The primary outcome measures were the Medical Outcomes Study 36-Item Short-Form General Health Survey (SF-36) bodily pain and physical function scores (100-point scales, with higher scores indicating less severe symptoms) and the modified Oswestry Disability Index (100-point scale, with lower scores indicating less severe symptoms) at 6 weeks, 3 months, 6 months, 1 year, and 2 years.
RESULTS
We enrolled 304 patients in the randomized cohort and 303 in the observational co-hort. The baseline characteristics of the two cohorts were similar. The one-year cross-over rates were high in the randomized cohort (approximately 40% in each direction) but moderate in the observational cohort (17% crossover to surgery and 3% crossover to nonsurgical care). The intention-to-treat analysis for the randomized cohort showed no statistically significant effects for the primary outcomes. The as-treated analysis for both cohorts combined showed a significant advantage for surgery at 3 months that increased at 1 year and diminished only slightly at 2 years. The treatment effects at 2 years were 18.1 for bodily pain (95% confidence interval [CI], 14.5 to 21.7), 18.3 for physical function (95% CI, 14.6 to 21.9), and −16.7 for the Oswestry Disability Index (95% CI, −19.5 to −13.9). There was little evidence of harm from either treatment. CONCLUSIONS
In nonrandomized as-treated comparisons with careful control for potentially con-founding baseline factors, patients with degenerative spondylolisthesis and spinal stenosis treated surgically showed substantially greater improvement in pain and func-tion during a period of 2 years than patients treated nonsurgically. (ClinicalTrials. gov number, NCT00000409.)
n engl j med 356;22 www.nejm.org may 31, 2007 2258
D
egenerative spondylolisthesis is the slipping forward of one lumbar verte-bra on another with an intact neural arch. It rarely occurs before the age of 50 years, and it disproportionately affects women, particularly black women, with a male:female ratio of approx-imately 1:6.1 Slippage most commonly occurs atthe L4–L5 level and rarely exceeds 30% of verte-bral width.1 Degenerative spondylolisthesis is
gen-erally asymptomatic, but it can be associated with symptomatic spinal stenosis.1
Spinal stenosis, the most common reason for lumbar surgery in adults over the age of 65, is a narrowing of the spinal canal with encroachment on the neural structures by surrounding bone and soft tissue. Patients typically present with neuro-genic claudication — pain in the buttocks or legs with walking or standing that resolves with sitting or lumbar flexion. However, anatomical spinal stenosis is frequently detected by imaging studies in asymptomatic patients; thus, clinical correlation between symptoms and imaging is critical.2
Two studies have compared surgery with non-surgical treatment for spinal stenosis, but both of these studies included patients with and those without degenerative spondylolisthesis.3-5 Several
studies have compared surgical techniques in co-horts with degenerative spondylolisthesis; how-ever, these studies had small samples with limited geographic participation and lacked nonsurgical controls and validated outcome measures.6-8 The
optimal treatment strategy for symptomatic de-generative spondylolisthesis remains unclear.
The Spine Patient Outcomes Research Trial (SPORT) was designed to compare the effective-ness of surgical and nonsurgical treatment among participants with confirmed diagnoses of inter-vertebral disk herniation,9,10 spinal stenosis, and
degenerative spondylolisthesis.11 Here we report
the 2-year outcomes of patients with degenerative spondylolisthesis.
Methods
Study Design
The SPORT was conducted in 11 states at 13 med-ical centers in the United States that have multi-disciplinary spine practices. The SPORT included both a randomized cohort and a concurrent obser-vational cohort with identical selection criteria and outcomes assessment.12 The standardized
proto-col was approved by human subjects committees
at each participating institution, and an indepen-dent data and safety monitoring board monitored the results of the trial. The principal investigator had full access to all the data in the study and takes responsibility for the accuracy and integrity of the data analysis. Additional background information has been published previously.9-11,13
Patient Population
All patients had neurogenic claudication or radic-ular leg pain with associated neurologic signs, spi-nal stenosis shown on cross-sectiospi-nal imaging, and degenerative spondylolisthesis shown on lat-eral radiographs obtained with the patient in a standing position. The patients had had persistent symptoms for at least 12 weeks and had been con-firmed as surgical candidates by their physicians. Patients with adjacent levels of stenosis were eli-gible; patients with spondylolysis and isthmic spondylolisthesis were not. The nature of non-surgical care before enrollment was not prespec-ified but included physical therapy in 68% of pa-tients, epidural injections in 55%, chiropractic treatment in 25%, antiinflammatory agents in 63%, and opioid analgesic agents in 30%.
Research nurses at each site identified poten-tial participants and verified their eligibility. The patients were offered enrollment in either cohort and gave written informed consent after viewing videotapes explaining the expected benefits, risks, and uncertainties of the treatments.14,15
Partici-pants in the randomized cohort received computer-generated random treatment assignments blocked according to center; those in the observational cohort chose their treatment with their physician. Enrollment began in March 2000 and ended in February 2005.
Study Interventions
The protocol surgery consisted of a standard pos-terior decompressive laminectomy with or with-out bilateral single-level fusion (iliac crest bone grafting with or without posterior pedicle-screw instrumentation).11 The nonsurgical protocol was
usual care, recommended to include at least active physical therapy, education or counseling includ-ing instructions for exercisinclud-ing at home, and non-steroidal antiinflammatory agents if tolerated.11,13 Study Measures
The primary end points were the Medical Outcomes Study 36-Item Short-Form General Health Survey
The New England Journal of Medicine
Downloaded from nejm.org on August 15, 2016. For personal use only. No other uses without permission. Copyright © 2007 Massachusetts Medical Society. All rights reserved.
n engl j med 356;22 www.nejm.org may 31, 2007 2259 (SF-36) bodily pain and physical function scores16-19
and the Oswestry Disability Index (American Acad-emy of Orthopaedic Surgeons/Modems version)20
measured at 6 weeks and at 3, 6, 12, and 24 months after enrollment. Secondary outcomes included patient-reported improvement, satisfaction with current symptoms and care,21 the Stenosis
Bother-someness Index,22,23 and the Low Back Pain
Bothersomeness Scale.3 The SF-36 scores range
from 0 to 100, with higher scores indicating less severe symptoms; the Oswestry Disability Index ranges from 0 to 100, with lower scores indicat-ing less severe symptoms; the Stenosis Bother-someness Index ranges from 0 to 24, with lower scores indicating less severe symptoms; and the Low Back Pain Bothersomeness Scale ranges from 0 to 6, with lower scores indicating less severe symptoms.
Statistical Analysis
A sample size of 150 patients in each treatment group for the randomized cohort was determined as sufficient on the basis of a two-sided t-test with a power of 0.85 to detect a 10-point difference in the SF-36 bodily pain and physical function scores or a similar effect size in the Oswestry Disability Index. The sample size allowed for up to 20% of the data to be missing but did not account for any specific levels of nonadherence.
Initial analyses compared baseline character-istics of the patients between the randomized co-hort and the observational coco-hort and between the treatment groups of the combined random-ized cohort and the observational cohort. The ex-tent of missing data and the percentage of patients undergoing surgery were calculated for each scheduled follow-up. Baseline predictors of time until surgical treatment in both cohorts (including treatment crossovers) were determined by a step-wise proportional-hazards regression model with an inclusion criterion of P<0.1 to enter and P>0.05 to exit. Predictors of missing follow-up visits at 1 year were determined by stepwise logistic re-gression with entry and exit criteria of P<0.1 and P>0.05, respectively.
Primary analyses compared surgical and non-surgical treatments using changes from baseline at each follow-up time for SF-36 bodily pain and physical function and for the Oswestry Disability Index. The randomized cohort was initially ana-lyzed on an intention-to-treat basis. However, be-cause of the extent of crossover, subsequent
analy-ses combined the randomized cohort and the observational cohort and were based on treatments actually received. In these as-treated analyses, the treatment indicator was a time-varying covariate, allowing for variable times to surgery. Before the time of surgery, all changes from baseline were included in the estimates of the nonsurgical treat-ment effect. After surgery, subsequent changes in outcomes were assigned to the surgical group with follow-up measured from the date of surgery. The randomized cohort and the observational cohort were each analyzed to produce separate as-treated estimates of treatment effect. These results were compared with the use of a Wald test to simul-taneously test all follow-up visit times for differ-ences in estimated treatment effects between the randomized and observational groups.24
Subse-quent analyses combined the two cohorts. To adjust for potential confounding effects, baseline variables associated with missing data or treatment received were included as covariates in longitudinal regression models.24 A random
effect was specified to account for the correla-tion between the repeated measurements of in-dividual patients. Computations were performed with the use of SAS software (PROC MIXED for continuous data with normal random effects and PROC GENMOD for binary and non-normal sec-ondary outcomes). Statistical significance was de-fined as P<0.05 on the basis of a two-sided hypoth-esis test (SAS software, version 9.1). Data for these analyses were collected through October 3, 2006.
R esults
Overall, 607 of 892 eligible participants were en-rolled in the SPORT (304 in the randomized co-hort and 303 in the observational coco-hort). A total of 601 patients (99%) completed at least one fol-low-up visit and were included in the analysis; between 83% and 95% of enrollees supplied data at each follow-up visit (Fig. 1).
In the randomized cohort, 159 patients were assigned to surgery and 145 to nonsurgical treat-ment. Of those assigned to surgery, 57% under-went surgery by 1 year and 64% by 2 years. In the group assigned to nonsurgical care, 44% un-derwent surgery by 1 year and 49% by 2 years. In the observational cohort, 173 patients initially chose surgery and 130 initially chose nonsurgical care. Of those initially choosing surgery, 97% un-derwent surgery by 1 year, and one additional
n engl j med 356;22 www.nejm.org may 31, 2007 2260
39p6 892 Patients were eligible
1164 Patients were screened
272 Patients were ineligible 124 Were not surgical candidates
40 Had inadequate nonsurgical treatment 29 Had fracture, infection, or deformity 19 Had cancer
60 Had other reasons
285 Patients declined to participate
304 Were in the randomized
cohort 303 Were in the observationalcohort
159 Were assigned
to surgery nonsurgical treatment145 Were assigned to
146 Were available at 6 wk 12 Missed the follow-up visit
1 Withdrew 0 Died
15 (9%) Underwent surgery
135 Were available at 6 wk 9 Missed the follow-up visit 1 Withdrew
0 Died
11 (8%) Underwent surgery
155 Were available at 6 wk 17 Missed the follow-up visit
1 Withdrew 0 Died
119 (69%) Underwent surgery
124 Were available at 6 wk 6 Missed the follow-up visit 0 Withdrew
0 Died
0 Underwent surgery 173 Chose surgery 130 Chose nonsurgicaltreatment
144 Were available at 3 mo 13 Missed the follow-up visit
2 Withdrew 0 Died
57 (36%) Underwent surgery
133 Were available at 3 mo 11 Missed the follow-up visit
1 Withdrew 0 Died
35 (24%) Underwent surgery
160 Were available at 3 mo 11 Missed the follow-up visit
2 Withdrew 0 Died
153 (88%) Underwent surgery
114 Were available at 3 mo 14 Missed the follow-up visit
2 Withdrew 0 Died
3 (2%) Underwent surgery
146 Were available at 6 mo 10 Missed the follow-up visit
2 Withdrew 1 Died
84 (53%) Underwent surgery
134 Were available at 6 mo 9 Missed the follow-up visit 1 Withdrew
1 Died
55 (38%) Underwent surgery
161 Were available at 6 mo 10 Missed the follow-up visit
2 Withdrew 0 Died
165 (95%) Underwent surgery
115 Were available at 6 mo 9 Missed the follow-up visit 5 Withdrew
1 Died
9 (7%) Underwent surgery
144 Were available at 1 yr 9 Missed the follow-up visit 4 Withdrew
2 Died
91 (57%) Underwent surgery
134 Were available at 1 yr 8 Missed the follow-up visit 2 Withdrew
1 Died
64 (44%) Underwent surgery
162 Were available at 1 yr 8 Missed the follow-up visit 3 Withdrew
0 Died
167 (97%) Underwent surgery
117 Were available at 1 yr 3 Missed the follow-up visit 8 Withdrew
2 Died
22 (17%) Underwent surgery
132 Were available at 2 yr 8 Missed the follow-up visit 11 Withdrew
2 Died 6 Visit pending
101 (64%) Underwent surgery
120 Were available at 2 yr 6 Missed the follow-up visit 5 Withdrew
5 Died 9 Visit pending
71 (49%) Underwent surgery
159 Were available at 2 yr 6 Missed the follow-up visit 5 Withdrew
3 Died
168 (97%) Underwent surgery
110 Were available at 2 yr 6 Missed the follow-up visit 11 Withdrew 3 Died 32 (25%) Underwent surgery AUTHOR: FIGURE: JOB: ISSUE: 4-C H/T RETAKE SIZE ICM CASE EMail Line H/T Combo Revised
AUTHOR, PLEASE NOTE:
Figure has been redrawn and type has been reset. Please check carefully.
REG F Enon 1st 2nd 3rd Weinstein 1 of 2 05-31-07 ARTIST: ts 35622
Figure 1. Exclusion, Enrollment, Randomization, and Follow-up of Trial Participants.
The values are cumulative over 2 years. For example, a total of two patients in the group assigned to surgery died during the 2-year follow-up period.
The New England Journal of Medicine
Downloaded from nejm.org on August 15, 2016. For personal use only. No other uses without permission. Copyright © 2007 Massachusetts Medical Society. All rights reserved.
n engl j med 356;22 www.nejm.org may 31, 2007 2261 tient underwent surgery between 1 and 2 years
from the time of enrollment. Of those initially choosing nonsurgical treatment, 17% underwent surgery by 1 year and 25% by 2 years. In both co-horts combined, 372 patients underwent surgery within the first 2 years and 235 received only non-surgical treatment.
Patient Characteristics
Table 1 shows the baseline characteristics and clinical findings of participants in the random-ized and the observational cohorts. The cohorts were remarkably similar; however, patients in the observational cohort had more L4–L5 involve-ment, less involvement of L3–L4, and less lateral recess stenosis.
Summary statistics for the combined cohorts are also shown in Table 1 according to treatment received; the mean age was 66 years. Eighty-five percent of patients had neurogenic claudication, and 77% had associated dermatomal pain radia-tion. Most of the degenerative slips and associated stenoses were at L4–L5. On imaging, stenosis was graded as severe in 60% of patients, and 35% had multiple levels of stenosis.
At baseline, patients in the group undergoing surgery from the combined randomized and ob-servational cohorts were younger and more likely to be receiving compensation (e.g., workers’ com-pensation or social security) than those receiving nonsurgical treatment. They had worse pain, func-tion, disability, and symptoms than patients in the nonsurgical group. Patients in the surgery group were more dissatisfied with their symp-toms and at enrollment more often rated their symptoms as worsening. This observation high-lights the need to control for baseline differences in the adjusted models. The final model controlled for the following covariates, selected as described in the Methods section: age, sex, work status, de-pression, osteoporosis, joint problems, duration of current symptoms, reflex deficit, number of mod-erate or severe stenotic levels, baseline score (for the SF-36, the Oswestry Disability Index, and the Stenosis Bothersomeness Index), and the center where the patient was treated. SF-36 and the Os-westry Disability Index scores were also adjusted for the baseline Stenosis Bothersomeness Index score.
Lateral radiographs obtained with the patient in a neutral standing position were available for independent review for 169 patients. The percent-age of slip as measured by the method of
Mor-gan and King25 ranged from 1 to 37% (median,
15%; interquartile range, 10 to 21%). Eighty-six percent of patients had grade 1 slip and 14% had grade 2.
Nonsurgical Treatments
Nonsurgical treatments used during the SPORT included physical therapy (42%), epidural steroid injections (45%), nonsteroidal antiinflammatory drugs (51%), and opioids (34%). Nonsurgical treat-ments were similar in the randomized cohort and the observational cohort, though more patients in the randomized cohort reported visits to a sur-geon (44% vs. 34%, P = 0.04), receiving injections (49% vs. 37%, P = 0.02), and narcotics use (40% vs. 26%, P = 0.007).
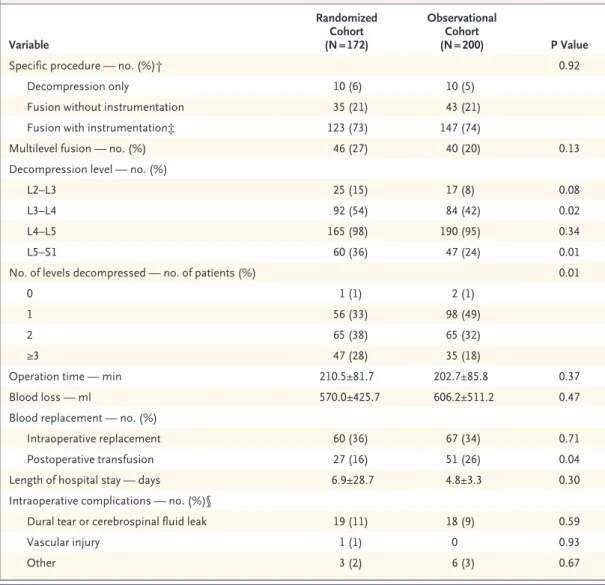
Surgical Treatment and Complications
The median surgical time was 199 minutes, with a mean blood loss of 589 ml (Table 2). There were no significant differences between the cohorts in rates of intraoperative blood replacement, but there was a difference in the postoperative transfusion rates (16% in the randomized cohort vs. 26% in the observational cohort, P = 0.04). The most com-mon surgical complication was dural tear (10%). The 2-year reoperation rate was 12%.
Main Treatment effects
The intention-to-treat analysis of the randomized cohort showed no statistically significant effects for the primary outcomes, on the basis of a global hypothesis test for differences in mean changes from baseline between the treatment groups in-cluding all time periods. Treatment effects at 2 years were 1.5 for SF-36 bodily pain (95% con-fidence interval [CI], –4.2 to 7.3; P = 0.52), 1.9 for physical function (95% CI, –3.7 to 7.5; P = 0.71), and 2.2 for the Oswestry Disability Index (95% CI, –2.3 to 6.8; P = 0.68).
As-treated effects for the combined cohorts were statistically significant in favor of surgery for all primary and secondary outcomes (Table 3 and Fig. 2). Treatment effects were stable for 2 years and were significant for all time periods, with treatment effects at 2 years of 18.1 for SF-36 bodily pain (95% CI, 14.5 to 21.7), 18.3 for physical function (95% CI, 14.6 to 21.9), and −16.7 for the Oswestry Disability Index (95% CI, −19.5 to −13.9). The results of the intention-to-treat and the as-treated analyses of the randomized and the ob-servational cohorts are compared in Figure 2. The as-treated treatment effects at 2 years were nearly
n engl j med 356;22 www.nejm.org may 31, 2007 2262
Table 1. Characteristics of the Patients According to Study Cohort at Baseline.*
Characteristic Randomized Cohort (N = 301) Observational Cohort (N = 300) ValueP Surgical Treatment (N = 368)† Nonsurgical Treatment (N = 233)† ValueP Age — yr 66.0±10.0 66.1±10.6 0.86 64.7±10.1 68.2±10.3 <0.001
Female sex — no. (%) 200 (66) 212 (71) 0.30 255 (69) 157 (67) 0.69
Race or ethnic group — no. (%)‡
Non-Hispanic 292 (97) 295 (98) 0.42 359 (98) 228 (98) 0.97
White 259 (86) 247 (82) 0.26 316 (86) 190 (82) 0.19
Black 29 (10) 32 (11) 0.78 30 (8) 31 (13) 0.06
Any college education — no. (%) 201 (67) 199 (66) 0.98 247 (67) 153 (66) 0.78
Married — no. (%) 198 (66) 198 (66) 0.98 249 (68) 147 (63) 0.29
Work status — no. (%) 0.42 0.96
Working full- or part-time 116 (39) 102 (34) 133 (36) 85 (36)
Disabled 21 (7) 30 (10) 33 (9) 18 (8)
Retired 129 (43) 128 (43) 156 (42) 101 (43)
Other 35 (12) 40 (13) 46 (12) 29 (12)
Compensation — no. (%)§ 21 (7) 20 (7) 0.99 34 (9) 7 (3) 0.005
Body-mass index¶ 29.1±5.7 29.2±6.7 0.91 29.4±6.5 28.8±5.7 0.22
Current smoker — no. (%) 23 (8) 28 (9) 0.55 34 (9) 17 (7) 0.49
Coexisting conditions — no. (%)
Hypertension 141 (47) 134 (45) 0.65 164 (45) 111 (48) 0.51
Diabetes 39 (13) 41 (14) 0.89 48 (13) 32 (14) 0.90
Osteoporosis 33 (11) 36 (12) 0.79 40 (11) 29 (12) 0.65
Heart problem 61 (20) 61 (20) 0.94 65 (18) 57 (24) 0.055
Stomach problem 64 (21) 69 (23) 0.68 79 (21) 54 (23) 0.70
Bowel or intestinal problem 17 (6) 26 (9) 0.20 30 (8) 13 (6) 0.30
Depression 56 (19) 42 (14) 0.16 63 (17) 35 (15) 0.57
Joint problem 175 (58) 169 (56) 0.72 202 (55) 142 (61) 0.17
Other‖ 121 (40) 113 (38) 0.58 146 (40) 88 (38) 0.70
Symptom duration >6 mo — no. (%) 185 (61) 176 (59) 0.54 227 (62) 134 (58) 0.35 SF-36 scores**
Bodily pain 30.7±16.4 31.7±17.5 0.44 29.2±16.8 34.4±16.7 <0.001
Physical function 34.4±21.5 34.3±23.3 0.98 30.5±20.5 40.3±23.9 <0.001
Mental component summary 49.9±11.9 50.5±11.2 0.53 49.5±11.6 51.3±11.3 0.06 Oswestry Disability Index†† 41.8±16.5 41.3±19.1 0.72 45.0±16.6 36.2±18.5 <0.001
Stenosis Frequency Index‡‡ 14.2±5.5 13.8±5.7 0.36 14.8±5.5 12.6±5.4 <0.001
Stenosis Bothersomeness Index§§ 14.8±5.6 14.6±5.6 0.79 15.6±5.5 13.3±5.4 <0.001 Low Back Pain Bothersomeness Scale¶¶ 4.3±1.8 4.3±1.8 0.99 4.4±1.8 4.0±1.9 0.01 Very dissatisfied with symptoms — no. (%) 203 (67) 213 (71) 0.39 287 (78) 129 (55) <0.001
Self-assessment of health trend — no. (%)‖‖ 0.73 <0.001
Problem getting better 17 (6) 21 (7) 17 (5) 21 (9)
Problem staying about the same 100 (33) 94 (31) 89 (24) 105 (45)
Problem getting worse 179 (59) 182 (61) 258 (70) 103 (44)
Treatment preference at baseline — no. (%)*** <0.001 <0.001
Definitely prefer nonsurgical treatment 44 (15) 83 (28) 32 (9) 95 (41) Probably prefer nonsurgical treatment 71 (24) 37 (12) 40 (11) 68 (29)
Not sure 117 (39) 20 (7) 83 (23) 54 (23)
Probably prefer surgery 30 (10) 31 (10) 51 (14) 10 (4)
Definitely prefer surgery 38 (13) 129 (43) 162 (44) 5 (2)
The New England Journal of Medicine
Downloaded from nejm.org on August 15, 2016. For personal use only. No other uses without permission. Copyright © 2007 Massachusetts Medical Society. All rights reserved.
n engl j med 356;22 www.nejm.org may 31, 2007 2263 Table 1. (Continued.) Characteristic Randomized Cohort (N = 301) Observational Cohort (N = 300) ValueP Surgical Treatment (N = 368)† Nonsurgical Treatment (N = 233)† ValueP Pseudoclaudication — no. (%) 259 (86) 252 (84) 0.56 319 (87) 192 (82) 0.19
Straight-leg–raising test or femoral-tension
sign — no. (%) 44 (15) 41 (14) 0.83 48 (13) 37 (16) 0.39
Dermatomal pain radiation — no. (%) 239 (79) 229 (76) 0.42 288 (78) 180 (77) 0.85 Any neurologic deficit — no. (%) 142 (47) 152 (51) 0.44 185 (50) 109 (47) 0.45
Asymmetric reflex depression 53 (18) 40 (13) 0.18 65 (18) 28 (12) 0.08
Asymmetric sensory decrease 79 (26) 90 (30) 0.35 108 (29) 61 (26) 0.45
Asymmetric motor weakness 74 (25) 72 (24) 0.94 87 (24) 59 (25) 0.71
Listhesis level — no. (%) 0.17 0.69
L3–L4 34 (11) 23 (8) 33 (9) 24 (10)
L4–L5 267 (89) 277 (92) 335 (91) 209 (90)
Stenosis level — no. (%)
L2–L3 31 (10) 22 (7) 0.26 33 (9) 20 (9) 0.99
L3–L4 136 (45) 100 (33) 0.004 145 (39) 91 (39) 1.00
L4–L5 285 (95) 295 (98) 0.03 357 (97) 223 (96) 0.54
L5–S1 27 (9) 30 (10) 0.77 29 (8) 28 (12) 0.12
No. of moderate or severe stenotic levels —
no. (%) 0.10 0.14
0 7 (2) 16 (5) 9 (2) 14 (6)
1 179 (59) 191 (64) 231 (63) 139 (60)
2 96 (32) 76 (25) 104 (28) 68 (29)
≥3 19 (6) 17 (6) 24 (7) 12 (5)
Stenosis location — no. (%)
Central 277 (92) 272 (91) 0.65 341 (93) 208 (89) 0.20
Lateral recess 286 (95) 260 (87) <0.001 338 (92) 208 (89) 0.36
Neuroforamen 123 (41) 120 (40) 0.89 152 (41) 91 (39) 0.64
Stenosis severity — no. (%) 0.08 0.08
Mild 7 (2) 16 (5) 9 (2) 14 (6)
Moderate 116 (39) 99 (33) 131 (36) 84 (36)
Severe 178 (59) 185 (62) 228 (62) 135 (58)
Instability — no. (%)††† 26 (9) 21 (7) 0.55 35 (10) 12 (5) 0.07
* Plus–minus values are means ±SD.
† Patients in the two cohorts combined were classified according to whether they received surgical treatment or only nonsurgical treatment during the first 2 years of enrollment.
‡ Race or ethnic group was self-assessed. Whites and blacks could be either Hispanic or non-Hispanic.
§ This category includes patients who were receiving or had applications pending for workers’ compensation, Social Security compensation, or other compensation.
¶ The body-mass index is the weight in kilograms divided by the square of the height in meters.
‖ Other problems included those related to stroke, cancer, lung disease, fibromyalgia, chronic fatigue syndrome, post-traumatic stress disorder, alcohol abuse, drug dependency, liver disease, kidney disease, vascular disease, neurologic disease, migraine, or anxiety.
** The SF-36 scores range from 0 to 100, with higher scores indicating less severe symptoms.
†† The Oswestry Disability Index ranges from 0 to 100, with lower scores indicating less severe symptoms. ‡‡ The Stenosis Frequency Index ranges from 0 to 24, with lower scores indicating less severe symptoms. §§ The Stenosis Bothersomeness Index ranges from 0 to 24, with lower scores indicating less severe symptoms. ¶¶ The Low Back Pain Bothersomeness Scale ranges from 0 to 6, with lower scores indicating less severe symptoms. ‖‖ Data were not available for eight patients.
*** Data were not available for one patient.
††† Instability is defined as a change of more than 10 degrees of angulation or more than 4 mm of translation of the ver-tebrae between flexion and extension of the spine.
n engl j med 356;22 www.nejm.org may 31, 2007 2264
identical in the randomized and the observational cohorts. For SF-36 bodily pain, the effect was 17.8 (95% CI, 12.5 to 23.0) in the randomized cohort as compared with 18.5 (95% CI, 13.4 to 23.6) in the observational cohort; for SF-36 physical func-tion, the effect was 16.7 (95% CI, 11.4 to 22.1) in the randomized cohort as compared with 19.9 (95% CI, 14.8 to 24.9) in the observational cohort; and for the Oswestry Disability Index, the effect was −15.9 (95% CI, −20.2 to −11.7) in the random-ized cohort as compared with −17.7 (95% CI, −21.6 to −13.7) in the observational cohort. The global hypothesis test comparing the treatment effects in the randomized and the observational cohorts over all time periods revealed no significant dif-ference between the cohorts: P = 0.29 for SF-36 bodily pain, P = 0.28 for SF-36 physical function, and P = 0.97 for the Oswestry Disability Index.
Subgroup Analyses
Models fitted for selected subgroups were exam-ined for evidence of modification of treatment efficacy. Participants less than 65 years old at baseline had larger treatment effects in favor of surgery at 3 months (21.3 vs. 14.6 for bodily pain, P = 0.02) but not at 1 or 2 years. The treatment effect for a degenerative spondylolisthesis level of L3–L4 was larger than that for a level of L4–L5 (33.1 vs. 16.8 for SF-36 bodily pain, P = 0.01) at 2 years but not at 3 months or 1 year. Participants with no more than a high-school education had smaller treatment effects for surgery at 3 months (12.8 vs. 20.5 for SF-36 bodily pain, P = 0.02) and 2 years (11.5 vs. 21.6 for SF-36 bodily pain, P = 0.01). Other subgroups (defined according to sex, smoking history, severity of symptoms at base-line, duration of symptoms, treatment preference,
Table 2. Surgical Treatments and Complications.*
Variable Randomized Cohort (N = 172) Observational Cohort (N = 200) P Value
Specific procedure — no. (%)† 0.92
Decompression only 10 (6) 10 (5)
Fusion without instrumentation 35 (21) 43 (21)
Fusion with instrumentation‡ 123 (73) 147 (74)
Multilevel fusion — no. (%) 46 (27) 40 (20) 0.13
Decompression level — no. (%)
L2–L3 25 (15) 17 (8) 0.08
L3–L4 92 (54) 84 (42) 0.02
L4–L5 165 (98) 190 (95) 0.34
L5–S1 60 (36) 47 (24) 0.01
No. of levels decompressed — no. of patients (%) 0.01
0 1 (1) 2 (1)
1 56 (33) 98 (49)
2 65 (38) 65 (32)
≥3 47 (28) 35 (18)
Operation time — min 210.5±81.7 202.7±85.8 0.37
Blood loss — ml 570.0±425.7 606.2±511.2 0.47
Blood replacement — no. (%)
Intraoperative replacement 60 (36) 67 (34) 0.71
Postoperative transfusion 27 (16) 51 (26) 0.04
Length of hospital stay — days 6.9±28.7 4.8±3.3 0.30
Intraoperative complications — no. (%)§
Dural tear or cerebrospinal fluid leak 19 (11) 18 (9) 0.59
Vascular injury 1 (1) 0 0.93
Other 3 (2) 6 (3) 0.67
The New England Journal of Medicine
Downloaded from nejm.org on August 15, 2016. For personal use only. No other uses without permission. Copyright © 2007 Massachusetts Medical Society. All rights reserved.
n engl j med 356;22 www.nejm.org may 31, 2007 2265 number of stenotic levels, severity of stenosis on
imaging, number of coexisting conditions, and baseline SF-36 mental component summary score) did not show significant effect modification. These results should be considered cautiously, be-cause the study was not designed or powered to examine subgroup differences.
Discussion
In patients with image-confirmed degenerative spondylolisthesis and symptoms persisting for at least 12 weeks, the intention-to-treat analysis found no significant advantage for surgery over nonsurgical care, but the analysis was severely limited by treatment crossover. As-treated analy-ses showed that surgery was superior to nonsur-gical treatment in relieving symptoms and
im-proving function. This treatment effect was seen as early as at the 6-week follow-up and persisted over 2 years. The nonsurgical-treatment group showed only moderate improvement over time. The smaller treatment effect for surgery seen in less-educated subjects is intriguing but unex-plained and may be a chance finding in a post hoc subgroup.
The randomized and observational cohorts were remarkably similar at baseline. The only significant differences were small ones in level and location of stenosis on baseline imaging. The cohorts also had similar outcomes, with no sig-nificant differences between the treatment effects in the as-treated analyses. These similarities sup-port the validity of the combined analysis pre-sented here.
There was little evidence of harm from either
Table 2. (Continued.) Variable Randomized Cohort (N = 172) Observational Cohort (N = 200) P Value
Postoperative complications and events — no. (%)¶
Nerve-root injury 1 (1) 0 0.93
Wound dehiscence 0 1 (1) 0.93
Wound hematoma 0 1 (1) 0.93
Wound infection 8 (5) 3 (2) 0.12
Other 21 (12) 14 (7) 0.10
Death within 3 mo after surgery — no. (%) 1 (1) 1 (1) 0.55
Additional spine surgeries within 1 yr — no. (%)‖** 13 (8) 11 (6) 0.40
Recurrent stenosis or progressive listhesis 1 (1) 1 (1)
Pseudarthrosis or fusion exploration 0 1 (1)
Complication 11 (6) 7 (4)
New condition 1 (1) 1 (0.5)
Additional spine surgeries within 2 yr — no. (%)‖ 18 (11) 23 (12) 0.84
Recurrent stenosis or progressive listhesis 5 (3) 5 (2)
Pseudarthrosis or fusion exploration 0 3 (2)
Complication 13 (8) 11 (6)
New condition‖ 1 (1) 4 (2)
* A total of 172 patients in the randomized cohort and 200 patients in the observational cohort underwent surgery with-in 2 years after enrollment. Information about the surgery was available for 169 patients from the randomized cohort and 200 from the observational cohort. Plus–minus values are means ±SD.
† Data on specific procedures were available for 168 patients in the randomized cohort and 200 patients in the observa-tional cohort.
‡ All 270 patients undergoing fusion with instrumentation had pedicle screws; 46 underwent additional interbody fusion. § No cases were reported of aspiration into the respiratory tract, nerve-root injury, or operation at the wrong level. ¶ Complications or events occurring up to 8 weeks after surgery are listed. There were no reported cases of bone-graft
complication, cerebrospinal fluid leak, paralysis, cauda equina injury, or pseudarthrosis. ‖ The postsurgical reoperation rates are Kaplan–Meier estimates.
** One new stenosis occurred in the randomized cohort, and two new herniations and two new stenoses occurred in the observational cohort.
n engl j med 356;22 www.nejm.org may 31, 2007 2266 Ta bl e 3. Change Scores and Treatment Effects for Primary and Secondary Outcomes in the Randomized and Observational Cohorts Combined, According to Treatment Received.* Outcome 3 Mo 1 Yr 2 Yr Surgery (N = 385)† Nonsurgical Treatment (N = 320) Treatment Effect of Surgery (95% CI)‡ Surgery (N = 286) Nonsurgical Treatment (N = 234) Treatment Effect of Surgery (95% CI)‡ Surgery (N = 324) Nonsurgical Treatment (N = 187) Treatment Effect of Surgery (95% CI)‡ Primary outcomes SF-36 bodily pain§ 28.1±1.1 10.3±1.1 17.8 (14.9 to 20.6) 31.5±1.2 12.7±1.3 18.8 (15.5 to 22.1) 29.9±1.2 11.7±1.5 18.1 (14.5 to 21.7) SF-36 physical function§ 21.5±1.1 7.6±1.2 13.9 (11.1 to 16.8) 29.0±1.2 9.6±1.3 19.4 (16.1 to 22.7) 26.6±1.3 8.3±1.5 18.3 (14.6 to 21.9) Oswestry Disability Index¶ −20.8±0.9 −6.2±0.9 −14.6 (−16.8 to −12.4) −25.4±1.0 −7.5±1.1 −17.9 (−20.5 to −15.3) −24.2±1.0 −7.5±1.2 −16.7 (−19.5 to −13.9) Secondary outcomes Stenosis Bothersomeness Index‖ −10.2±0.5 −3.3±0.3 −6.9 (−8.0 to −5.9) −9.5±0.4 −4.0±0.4 −5.5 (−6.5 to −4.5) −8.9±0.4 −4.0±0.4 −4.9 (−6.0 to −3.8) Leg Pain Bothersomeness Scale** −3.2±0.1 −1.1±0.1 −2.1 (−2.5 to −1.8) −3.1±0.1 −1.4±0.1 −1.6 (−1.9 to −1.3) −2.9±0.1 −1.4±0.1 −1.5 (−1.8 to −1.1) Low Back Pain Bothe rsome -ness Scale** −2.2±0.1 −1.0±0.1 −1.2 (−1.5 to −0.9) −2.4±0.1 −1.1±0.1 −1.4 (−1.6 to −1.1) −2.2±0.1 −1.2±0.1 −1.0 (−1.3 to −0.7) Very or somewhat satisfied with symptoms (%) 69.6 24.0 45.6 (39.1 to 52.1) 73.2 26.8 46.4 (39.0 to 53.9) 68.8 32.2 36.6 (28.0 to 45.1) Very or somewhat satisfied with care (%) 90.8 68.3 22.5 (16.4 to 28.5) 90.8 68.2 22.6 (15.6 to 29.6) 89.2 67.3 21.9 (13.9 to 29.9) Self-rated major improvement in progress (%) 77.5 19.9 57.7 (51.8 to 63.5) 77.2 24.8 52.4 (45.3 to 59.6) 74.1 24.1 50.0 (42.2 to 57.9) * Sc or es a re a dj us te d fo r ag e, s ex , w or k st at us , d ep re ss io n, o st eo po ro si s, jo in t p ro bl em s, d ur at io n of c ur re nt s ym pt om s, r ef le x de fic it, n um be r of m od er at e or s ev er e st en ot ic le ve ls , b as eline scores (for the SF-36, Oswestry Disability Index, and Stenosis Bothersomeness Index), and the center where the patient was treated. Plus–minus values are means ±SE and represent changes from baseline. Percentages represent the proportion of patients giving positive responses at each follow-up examination. † For secondary outcomes, the total number of patients was 263. ‡ The global P value based on a Wald test assessing all time points simultaneously is less than 0.001 for all measures. § The SF-36 scores range from 0 to 100, with higher scores indicating less severe symptoms. ¶ The Oswestry Disability Index ranges from 0 to 100, with lower scores indicating less severe symptoms. ‖ The Stenosis Bothersomeness Index ranges from 0 to 24, with lower scores indicating less severe symptoms. ** The Leg Pain and the Low Back Pain Bothersomeness Scales range from 0 to 6, with lower scores indicating less severe symptoms.
The New England Journal of Medicine
Downloaded from nejm.org on August 15, 2016. For personal use only. No other uses without permission. Copyright © 2007 Massachusetts Medical Society. All rights reserved.
n engl j med 356;22 www.nejm.org may 31, 2007 2267 treatment. Often patients fear they will get worse
without surgery, but the patients receiving non-surgical treatment, on average, showed moderate improvement in all outcomes. No patients under-going surgical or nonsurgical treatment had cauda equina syndrome; 89% of surgical patients had no operative complications.
The characteristics of the participants in the SPORT were similar to those in previous studies of degenerative spondylolisthesis and mixed co-horts of patients with stenosis. The mean age of 66 years was similar to that in the cohorts re-ported by Herkowitz and Kurz8 (63.5 years),
Fischgrund et al.7 (67 years), the Maine Lumbar
Spine Study (MLSS)3 (66 years), Yukawa et al.26
(63 years), and Malmivaara et al.5 (63 years). At
enrollment, 60% of the SPORT participants re-ported having had symptoms for more than 6 months, as did 60% of the participants in the MLSS. Baseline functional status in the SPORT was similar to that in the MLSS (mean SF-36 physical function scores, 34 and 35, respectively) and in the randomized trial by Malmivaara et al. (mean Oswestry Disability Index scores, 41.5 and 35.0, respectively).
The surgical outcomes in the SPORT were gen-erally similar to those in previous surgical series. Herkowitz and Kurz8 reported absolute
improve-ments of 33% for back pain and 55% for leg pain (6-point scales) at 3 years, similar to the changes of 31% and 41%, respectively (7-point scales), seen in the SPORT at 2 years. Also, the improvement at 1 year in the patients in the SPORT who were undergoing surgery for degenerative spondylolis-thesis was similar to the outcomes of surgery in the MLSS mixed-stenosis (those with and those without degenerative spondylolisthesis) cohort. The improvement in the SF-36 bodily pain score was 32 in the SPORT and 43 in the MLSS, and the improvement in the SF-36 physical function score was 29 in the SPORT and 27 in the MLSS.3
The nonsurgical outcomes in the SPORT were similar to those in the study by Malmivaara et al.5
and in the MLSS.3 Malmivaara et al. reported
absolute improvements in back pain at 2 years of 18% on an 11-point scale, as compared with 17% on a 7-point scale in the SPORT, and an improve-ment in leg pain of 16%, as compared with 17% in the SPORT. Similarly, at 1 year the MLSS re-ported an improvement of 12.0 points in SF-36 bodily pain, as compared with 12.7 in the SPORT. The nonsurgical functional outcomes, however,
were better in the SPORT than in these previous studies. SF-36 physical function improved by 9.6 points in the SPORT nonsurgical group, as com-pared with 1.0 point in the MLSS, and the Os-westry Disability Index improved by −7.5 points in the SPORT, as compared with −4.5 points in the study by Malmivaara et al. The somewhat greater improvement in the SPORT may be related to the nonsurgical treatments received. The SPORT participants had higher rates of epidural steroid injections than did the MLSS participants (44% vs. 18%), similar rates of physical therapy, and much lower use of activity restriction (16% vs. 29%) and transcutaneous electrical nerve stimu-lation (2% vs. 14%). Differences in nonsurgical outcomes might also be due to differences in the underlying disease process in patients with de-generative spondylolisthesis as compared with a mixed stenosis population in the study by Malmi-vaara et al. and in the MLSS.
We can directly compare estimates of treatment effect in the SPORT with those in the MLSS and the study by Malmivaara et al. The estimated 1-year treatment effects for surgery in the SPORT were smaller than those in the MLSS (18.8 vs. 30.4 points for SF-36 bodily pain, and 19.4 vs. 25.5 points for SF-36 physical function). However, the MLSS did not adjust treatment effects for base-line differences between the treatment groups, which probably explains these discrepancies. The estimated 1-year treatment effects were similar in the SPORT and in the study by Malmivaara et al. (Oswestry Disability Index, −17.9 vs. −11.3, re-spectively; leg pain, 23% [7-point scale] vs. 15% [11-point scale], respectively; and back pain, 20% [7-point scale] vs. 21% [11-point scale], respec-tively.
The 1-year rate of reoperation for recurrent stenosis or spondylolisthesis was 0.6%, less than the rates reported by Malmivaara et al. (2%) and the MLSS (1.2%). The reoperation rate increased to 3% at 2 years. The perioperative mortality rate was 0.6%, which is less than the 1.3% seen in Medicare patients after fusion surgery for spon-dylolisthesis.27 The 2-year mortality rate was
simi-lar in both treatment groups and less than actu-arial projections.
A limitation of this study is the marked de-gree of nonadherence to randomized treatment. The protocol stipulated that patients assigned to surgery have their surgery within 3 to 6 months after enrollment, a period thought to be
n engl j med 356;22 www.nejm.org may 31, 2007 2268
Surgery — as treated Surgery — intention-to-treat
(randomized cohort only) Nonsurgical treatment — intention-to-treat(randomized cohort only) Nonsurgical treatment — as treated
Adjusted Mean Score
60 80 40 20 0 0 3 6 12 24 Months
Adjusted Mean Score
60 80 40 20 0 0 3 6 12 24 Months
Adjusted Mean Score
60 80 40 20 0 0 3 6 12 24 Months
Adjusted Mean Score
60 80 40 20 0 0 3 6 12 24 Months
A Randomized Cohort — SF-36 Bodily Pain B Observational Cohort — SF-36 Bodily Pain
C Randomized Cohort — SF-36 Physical Function D Observational Cohort — SF-36 Physical Function
Adjusted Mean Score
60 40 20 0 0 3 6 12 24 Months
Adjusted Mean Score
60 40 20 0 0 3 6 12 24 Months
E Randomized Cohort — Oswestry Disability Index F Observational Cohort — Oswestry Disability Index
AUTHOR: FIGURE: JOB: ISSUE: 4-C H/T RETAKE SIZE ICM CASE EMail Line H/T Combo Revised
AUTHOR, PLEASE NOTE:
Figure has been redrawn and type has been reset. Please check carefully.
REG F Enon 1st 2nd 3rd Weinstein 2 of 2 05-31-07 ARTIST: ts 35622 33p9 The New England Journal of Medicine
Downloaded from nejm.org on August 15, 2016. For personal use only. No other uses without permission. Copyright © 2007 Massachusetts Medical Society. All rights reserved.
n engl j med 356;22 www.nejm.org may 31, 2007 2269 priate in the clinical experience of the
investiga-tors. Although patients consented to this proto-col, as in all clinical trials this consent could be changed at the request of the patient, and many chose to do so. This reduced the power of the intention-to-treat analysis to demonstrate a treat-ment effect. Although the as-treated analysis lost the strong protection from confounding conferred by randomization, these analyses were carefully controlled for important covariates and yielded results similar to previous studies.
Another limitation is the heterogeneity of the treatment interventions. The choice of nonsurgi-cal therapies was at the discretion of the treating physician and the patient. However, with limited evidence regarding efficacy for most nonsurgical treatments for degenerative spondylolisthesis, creating a fixed protocol for nonsurgical treat-ment was neither clinically feasible nor general-izable. The nonsurgical treatments used were consistent with published guidelines.28,29
Simi-larly, the surgeries performed varied in terms of the presence, method, and extent of spinal fusion accompanying the decompression. We cannot make direct conclusions regarding the compari-son between the effect of surgery and any specific nonsurgical treatment, nor do we directly com-pare the efficacy of nonsurgical treatment with one specific surgical technique.
The magnitudes of the mean changes reported here after surgery for degenerative spondylolis-thesis are less than those reported for patients in a SPORT observational cohort undergoing surgery for intervertebral disk herniation. The mean change scores after 2 years were as follows: SF-36 bodily
pain, 29.9 for degenerative spondylolisthesis ver-sus 42.6 for intervertebral disk herniation; SF-36 physical function, 26.7 for degenerative spondy-lolisthesis versus 43.9 for intervertebral disk her-niation; Oswestry Disability Index, −24.2 for degenerative spondylolisthesis versus 37.6 for in-tervertebral disk herniation.9,10 However, the
treat-ment effects for surgery in the degenerative-spondylolisthesis group were larger than those in the study of intervertebral disk herniation (18.4 for bodily pain in the degenerative-spondylolisthe-sis group vs. 10.2 in the intervertebral-disk-her-niation study) because of dramatic improvements in the nonsurgical group with intervertebral disk herniation not seen in the degenerative-spondylo-listhesis group.
In these nonrandomized comparisons with careful control of potentially confounding base-line factors, patients with persistent neurogenic claudication from degenerative spondylolisthesis treated surgically showed substantially greater improvement in pain and function, as well as satisfaction, for 2 years. Characteristics of the patients and treatment outcomes were similar in the randomized and observational cohorts.
Supported by a grant (U01-AR45444-01A1) from the National Institute of Arthritis and Musculoskeletal and Skin Diseases (NIAMS) and the Office of Research on Women’s Health; by the National Institutes of Health; by the National Institute of Occu-pational Safety and Health and the Centers for Disease Control and Prevention; and by a grant (P60-AR048094-01A1 to the Multidisciplinary Clinical Research Center in Musculoskeletal Diseases) and a Research Career Award (1 K23 AR 048138-01 to Dr. Lurie) from NIAMS. These sources had no role in the design or conduct of the study; in the collection, management, analy-sis, or interpretation of the data; or in the preparation, review, or approval of the manuscript.
Dr. Weinstein reports receiving consulting fees from United
Healthcare and an honorarium as editor-in-chief of Spine. Dr.
Lurie reports receiving consulting fees from the Pacific Busi-ness Group on Health. Dr. Birkmeyer reports receiving grant support from Blue Cross/Blue Shield of Michigan. Dr. Herkow-itz reports receiving consulting fees and royalties from Medtronic Sofamor Danek. Dr. Cammisa reports owning eq-uity in HealthPoint Capital Partners, K2M, Mazor Surgical Technologies, and Spinal Kinetics. Dr. Albert reports receiving consulting fees, lecture fees, and royalties from DePuy Spine and owning equity in K2M. Dr. Emery reports receiving de-partmental block grant support from Zimmer, Medtronic So-famor Danek, and Synthes. Dr. Lenke reports receiving con-sulting fees and grant support from Medtronic Sofamor Danek and Biotek. Dr. Longley reports owning equity in Custom Spine. Dr. Errico reports receiving consulting fees from Stryk-er and Fastenetix; fellowship support from AOSpine, DePuy Spine, and Medtronic Sofamor Danek; and clinical research grant support from Stryker and Synthes. No other potential conflict of interest relevant to this article was reported.
We thank Tamara S. Morgan, Department of Orthopaedic Surgery, Dartmouth Medical School, for graphic design and pro-duction and for overall assistance to the SPORT.
Figure 2 (facing page). Intention-to-Treat and As-Treat-ed Results over Time for the Primary Outcome Mea-sures of SF-36 Bodily Pain (Panels A and B), SF-36 Physical Function (Panels C and D), and the Oswestry Disability Index (Panels E and F).
SF-36 bodily pain and physical function scores range from 0 to 100, with higher scores indicating less severe symptoms. The Oswestry Disability Index ranges from 0 to 100, with lower scores indicating less severe symptoms. The horizontal dashed line in each of the four SF-36 graphs represents the age- and sex-adjusted norms. I bars represent the 95% confidence intervals. The floating symbols at 0 months represent the ob-served mean scores for each treatment group, whereas the plotline at 0 months originates from the overall mean as used in the adjusted analyses.
n engl j med 356;22 www.nejm.org may 31, 2007 2270
APPENDIX
In addition to the authors, the following investigators participated in the Spine Patient Outcomes Research Trial (institutions are in order
from highest to lowest enrollment): Dartmouth Medical School, Hanover, NH — J. Forman, B. Butler-Schmidt, J.J. Hebb, P. Bernini. R. Hazard,
P. Ball, C. Murray, M. Splaine, D. Sengupta, H. Schmidek, R. Rose, C. Olson, P. McDonough, H. Magnasdottir; William Beaumont Hospital,
Royal Oak, MI — G. Bradley, M. Lurie, L. Kurz, J. Fischgrund, D. Montgomery, E. Truumees; Rothman Institute at Thomas Jefferson Hospital, Phila-delphia — C. Simon, T. Conliffe; Hospital for Special Surgery, New York — B. Green, J. Farmer, H. Sandhu; Nebraska Foundation for Spinal Research, Omaha — N. Fullmer, A.M. Fredericks, R. Woodward, J. Fuller, E. Phillips, J. McClellan, P. Bowman, T. Burd; Emory University–Emory Clinic, Atlanta — S. Boden, S. Lashley, H. Levy, D. Hubbell, M. Schaufele, J. Rhee, S.T. Yoon, S. Dreyer, J. Heller; Washington University, St. Louis — G.
Stobbs, K. Bridwell, A. Margherita, K.D. Riew, B. Taylor, J. Metzler; University Hospitals of Cleveland and Case Western Reserve University, Cleveland
— C. Furey, K. Higgins, J.X. Yoo, E.B. Marsolais, H. Bohlman; Hospital for Joint Diseases, New York — A. Lee, J. Bendo, J. Goldstein, J. Spivak,
R. Perry, R. Schoenfeldt, R. Moskovich, J. Dryer; Kaiser Permanente, Oakland, CA — H. Goldberg, P. Malone, F. Massimino; University of California,
San Francisco, San Francisco — P. Malone, S. Berven, T. Smith; Rush–Presbyterian–St. Luke’s Medical Center, Chicago — G. Andersson, H. An, M.
Hickey, E. Goldberg, F. Philips; Maine Spine and Rehabilitation, Scarborough — R. Keller, L. Thibodeau, J. Florman.
References
Jacobsen S, Sonne-Holm S, Rovsing H, Monrad H, Gebuhr P. Degenerative lumbar spondylolisthesis: an epidemio-logical perspective: the Copenhagen Os-teoarthritis Study. Spine 2007;32:120-5.
Boden SD, Davis DO, Dina TS, Patro-nas NJ, Wiesel S. Abnormal magnetic-resonance scans of the lumbar spine in asymptomatic subjects: a prospective in-vestigation. J Bone Joint Surg Am 1990; 72:403-8.
Atlas SJ, Deyo RA, Keller RB, et al. The Maine Lumbar Spine Study, Part III: 1-year outcomes of surgical and nonsur-gical management of lumbar spinal ste-nosis. Spine 1996;21:1787-94.
Atlas SJ, Keller RB, Robson D, Deyo RA, Singer DE. Surgical and nonsurgical management of lumbar spinal stenosis: four-year outcomes from the Maine Lum-bar Spine Study. Spine 2000;25:556-62.
Malmivaara A, Slatis P, Heliovaara M, et al. Surgical or nonoperative treatment for lumbar spinal stenosis? A randomized controlled trial. Spine 2007;32:1-8.
Bridwell KH, Sedgewick TA, O’Brien MF, Lenke LG, Baldus C. The role of fu-sion and instrumentation in the treatment of degenerative spondylolisthesis with spi-nal stenosis. J Spispi-nal Disord 1993;6:461-72.
Fischgrund JS, Mackay M, Herkowitz HN, Brower R, Montgomery DM, Kurz LT. Degenerative lumbar spondylolisthesis with spinal stenosis: a prospective, ran-domized study comparing decompressive laminectomy and arthrodesis with and without spinal instrumentation. Spine 1997;22:2807-12.
Herkowitz HN, Kurz LT. Degenerative lumbar spondylolisthesis with spinal ste-nosis: a prospective study comparing de-compression with dede-compression and in-tertransverse process arthrodesis. J Bone Joint Surg Am 1991;73:802-8.
Weinstein JN, Lurie JD, Tosteson TD, et al. Surgical vs nonoperative treatment for lumbar disk herniation: the Spine Pa-tient Outcomes Research Trial (SPORT)
1. 2. 3. 4. 5. 6. 7. 8. 9.
observational cohort. JAMA 2006;296: 2451-9.
Weinstein JN, Tosteson TD, Lurie JD, et al. Surgical vs nonoperative treatment for lumbar disk herniation: the Spine Pa-tient Outcomes Research Trial (SPORT): a randomized trial. JAMA 2006;296:2441-50.
Birkmeyer NJ, Weinstein JN, Toste-son AN, et al. Design of the Spine Patient Outcomes Research Trial (SPORT). Spine 2002;27:1361-72.
Tunis SR, Stryer DB, Clancy CM. Prac-tical clinical trials: increasing the value of clinical research for decision making in clinical and health policy. JAMA 2003;290: 1624-32.
Cummins J, Lurie JD, Tosteson TD, et al. Descriptive epidemiology and prior healthcare utilization of patients in the Spine Patient Outcomes Research Trial’s (SPORT) three observational cohorts: disc herniation, spinal stenosis, and de-generative spondylolisthesis. Spine 2006; 31:806-14.
Phelan EA, Deyo RA, Cherkin DC, et al. Helping patients decide about back surgery: a randomized trial of an interac-tive video program. Spine 2001;26:206-11. Weinstein JN. Partnership: doctor and patient: advocacy for informed choice vs. informed consent. Spine 2005;30:269-72.
McHorney CA, Ware JE Jr, Lu JF, Sher-bourne CD. The MOS 36-item Short-Form Health Survey (SF-36): III. Tests of data quality, scaling assumptions, and reli-ability across diverse patient groups. Med Care 1994;32:40-66.
Stewart AL, Greenfield S, Hays RD, et al. Functional status and well-being of patients with chronic conditions: results from the Medical Outcomes Study. JAMA 1989;262:907-13. [Erratum, JAMA 1989; 262:2542.]
Ware JE Jr, Sherbourne CD. The MOS 36-item Short-Form Health Survey. I. Conceptual framework and item selec-tion. Med Care 1992;30:473-83.
Ware JE Jr, Snow KK, Kosinski M,
10. 11. 12. 13. 14. 15. 16. 17. 18. 19.
Gandek B. SF-36 Health Survey: manual and interpretation guide. Boston: Nimrod Press, 1993.
Daltroy LH, Cats-Baril WL, Katz JN, Fossel AH, Liang MH. The North Ameri-can Spine Society lumbar spine outcome assessment instrument: reliability and va-lidity tests. Spine 1996;21:741-9.
Deyo RA, Diehl AK. Patient satisfac-tion with medical care for low-back pain. Spine 1986;11:28-30.
Atlas SJ, Deyo RA, Patrick DL, Conv-ery K, Keller RB, Singer DE. The Quebec Task Force classification for spinal disor-ders and the severity, treatment, and out-comes of sciatica and lumbar spinal ste-nosis. Spine 1996;21:2885-92.
Patrick DL, Deyo RA, Atlas SJ, Singer DE, Chapin A, Keller RB. Assessing health-related quality of life in patients with sciatica. Spine 1995;20:1899-908.
Fitzmaurice G, Laird NM, Ware JH. Applied longitudinal analysis. New York: Wiley, 2004.
Morgan FP, King T. Primary instabil-ity of lumbar vertebrae as a common cause of low back pain. J Bone Joint Surg Br 1957;39:6-22.
Yukawa Y, Lenke LG, Tenhula J, Bridwell KH, Riew KD, Blanke K. A com-prehensive study of patients with surgi-cally treated lumbar spinal stenosis with neurogenic claudication. J Bone Joint Surg Am 2002;84:1954-9.
Deyo RA, Ciol MA, Cherkin DC, Lo-eser JD, Bigos SJ. Lumbar spinal fusion: a cohort study of complications, reopera-tions, and resource use in the Medicare population. Spine 1993;18:1463-70.
Acute low back problems in adults: as-sessment and treatment. Bethesda, MD: Department of Health and Human Services, 1994. (AHCPR publication no. 95-0643.)
Degenerative spondylolisthesis. In: North American Spine Society phase III clinical guidelines for multidisciplinary spine care specialists. LaGrange, IL: North American Spine Society; 2000. Copyright © 2007 Massachusetts Medical Society. 20. 21. 22. 23. 24. 25. 26. 27. 28. 29.
The New England Journal of Medicine
Downloaded from nejm.org on August 15, 2016. For personal use only. No other uses without permission. Copyright © 2007 Massachusetts Medical Society. All rights reserved.