Citation: Sun, Yanan, Yen, Gary G., Mao, Hua and Yi, Zhang (2016) Manifold dimension
reduction based clustering for multi-objective evolutionary algorithm. In: CEC 2016 - 2016
IEEE Congress on Evolutionary Computation, 24th - 29th July 2016, Vancouver, Canada.
URL:
http://dx.doi.org/10.1109/CEC.2016.7744269
<http://dx.doi.org/10.1109/CEC.2016.7744269>
This version was downloaded from Northumbria Research Link:
http://nrl.northumbria.ac.uk/39682/
Northumbria University has developed Northumbria Research Link (NRL) to enable users to
access the University’s research output. Copyright
©and moral rights for items on NRL are
retained by the individual author(s) and/or other copyright owners. Single copies of full items
can be reproduced, displayed or performed, and given to third parties in any format or
medium for personal research or study, educational, or not-for-profit purposes without prior
permission or charge, provided the authors, title and full bibliographic details are given, as
well as a hyperlink and/or URL to the original metadata page. The content must not be
changed in any way. Full items must not be sold commercially in any format or medium
without formal permission of the copyright holder. The full policy is available online:
http://nrl.northumbria.ac.uk/policies.html
This document may differ from the final, published version of the research and has been
made available online in accordance with publisher policies. To read and/or cite from the
published version of the research, please visit the publisher’s website (a subscription may be
required.)
Manifold dimension reduction based clustering for
multi-objective evolutionary algorithm
Yanan Sun
College of Computer Science Sichuan University Chengdu, China 610065 [email protected]
Gary G. Yen
School of Electrical and Computer Engineering Oklahoma State University
Stillwater, USA 74075 [email protected]
Hua Mao and Zhang Yi
College of Computer Science Sichuan University Chengdu, China 610065
{huamao, zhangyi}@scu.edu.cn
Abstract—Real world optimization problems always possess multiple objectives which are conflict in nature. Multi-objective evolutionary algorithms (MOEAs), which provide a group of solutions in region of Pareto front, increasingly draw researchers attention for their excellent performance. In this regard, solutions with a wide diversity would be more favored as they give decision makers more choices to evaluate upon their problems. Based on the insight of investigating the evolution, the Pareto front often lies in a manifold space, not Euclidian space. However, most MOEAs utilize Euclidian distance as a sole mechanism to keep a wide range of diversity for solutions, which is not suitable somewhat from this aspect. To this end, manifold dimension reduction algorithm which has the ability to map solutions in the same front of objective space into Euclidian space is adapted in further. And then, general clustering algorithm are utilized. At the end, we use this technology to replace the crowding distance technology in NSGA-II to choose individuals when there is not enough slots in mating selection process. Based on a range of experiments over benchmark problems against state-of-the-art, it is fully expected benefit of performance improvement will be more significant when applied in many objectives optimization problems. This will be pursuit in our future study.
I. INTRODUCTION
Multiobjective Optimization Problems (MOPs) are mainly concerned with a number of simultaneously optimized objec-tives over the decision variables space. These optimization problems, such as traction for DC railway system [1], contain-ership loading design [2], gas turbine engine configuration [3], medical image reconstruction [4], supersonic wing design [5], and cancer chemotherapy [6], are very common under real-world complications. Generally, these objectives are conflict in nature and practitioners cannot obtain one perfect solution that can outperform others over every objective. If the exact trade-off among objective solutions is known, a preference based classical method might be good enough to search for the corresponding solution. However a user is usually not sure of the exact trade-off relationship among objectives. Naturally, a set of Pareto optimal solutions could be made available at first based on the Pareto-optimal principle and then a solution is chosen from the set by introducing some higher level decision-making. Algorithms for this class of problems begin with preference-based approaches if a prior knowledge about the importance of each objective is available. Subsequently, population-based algorithms are developed to
find multiple Pareto-optimal solutions without any assumed knowledge, which are often referred to as multi-objective evolutionary algorithms (MOEAs), and have been utilized in a wide variety of applications. These MOEAs, e.g. elitist non-dominated sorting genetic algorithm (NSGA-II) [7], advanced version of strength Pareto evolutionary algorithm (SPEA2) [8], and multi-objective evolutionary algorithm based on decom-position (MOEA/D) [9], not only provide the convergence needed, but also the diversity of solutions are kept, so as to give decision makers more alternatives to select for their preferences.
Multiple objective genetic algorithms (MOGAs) of Murata et al. [10] improved the diversity of solutions by niche count in which distance is exploited to estimate how far individual
iis away from individualj. In non-dominated sorting genetic
algorithms (NSGAs) [11], diversity is maintained based on the number of neighboring solutions sharing function and
the distance is measured between solutions i and j.
Diver-sity preservation of NSGA-II is named crowding distance (CD) which is composed of two steps. First, CDs of the boundary solutions in objective space are ranked as infinite magnitude. Afterward the values of objectives are sorted in
descending order for each dimension, and CD of solutioniis
computed through its neighbors. Strength Pareto evolutionary algorithm (SPEA) [12] and SPEA2 employ clustering and
k-th nearest neighbor for maintaining diversity, respectively.
Coincidentally, the distance metric for strengthening diversity mentioned above is based on Euclidean distance, which is more suitable for data lied in Euclidean space. Recently, based on the insight of investigating the evolution and the geometric regularity of Pareto front in MOEAs, it reveals that the Pareto
front lies in manifold under mild conditions [13]1.
Manifold is one type of topological spaces whose local geometric regularity is homeomorphic to Euclidean space. Data lies in manifold are ubiquitous in many real-world ap-plications, especially for high-dimensional data. The essential preprocessing step for a large number of further data analysis processes is understanding the intrinsic low-dimensional pat-tern of these high-dimensional data [14]–[17]. Recently,
man-1Strictly specking, Euclidean space is s special instance of manifold. We
distinct these two concept in this context for better following the weakness of Euclidean distance metrics introduced in manifold for MOEAs.
ifold related technologies introduced in MOEAs are mainly concerned with how effectively the MOEAs would interpolate new individuals depending on the basis that the Pareto set
is a piece-wise continuous manifold with dimension m−1
wheremdenotes the number of objectives [18], [19]. Manifold
dimension reduction (MDR) is one approach for non-linear di-mensionality reduction technologies which is comparable with principal component analysis. MDR tries to find the intrinsic representation of the raw data which lies in manifold and maps the data from manifold to Euclidean space. Increasing number of algorithms are proposed for this aspect of data analysis, such as Laplacian eigenmaps (LE) [20], locally linear embedding (LLE) [21], isomap algorithm (ISOMAP) [22], principal curve [23], semi-definite embedding [24], and self-organizing map [25]. In this paper, we focus on making use of MDR technology to map Pareto front lying in manifold into Euclidean space in which traditional clustering technology is then employed for enhancing diversity. As a case study, MDR based clustering NSGA-II is implemented for evaluating the performance of manifold dimension reduction based cluster-ing (MC) based MOEAs.
In the rest of this paper, we first provide the problem formulation in Euclidean distance metric commonly adopted in MOEAs, especially the clustering technology utilized in SPEA2 and NSGA-II in Section II. Then the mathematical description of MDR is presented, and MC based NSGA-II (in short, MC-MSGA-II) for improving the diversity is proposed in Section III. For the purpose of examining the promising performance of MC-NSGA-II, quantitative and qualitative experiments are compared over benchmark problems against a few chosen state-of-the-art MOEAs in Section IV. Finally, Section V concludes this paper and provides directions to some future works.
II. RELATEDWORKS
Convergence and diversity are two critical ingredients in the design of MOEAs. Convergence prefers a better non-dominated set being closer to the true Pareto front of conflict-ing objectives, while diversity favors diversified alternatives for decision makers preference. Most, if not all, existing MOEAs apply Euclidian distance as their basic distance met-ric for improving the efficacy of diversity. On the contrary geodesic distance is more suitable since the Pareto front lies in a manifold. In this paper, our focus will not be emphasized on how the geodesic distance metric can be implemented for the Pareto front, but on more reasonable to take advantage of traditional clustering technology. Consequently, only clus-tering technology utilized in SPEA and Clusclus-tering NSGA-II will be mainly discussed in details. It should be noted that the same treatment can be extended to other MOEA designs.
Crowding distance strategy is replaced by clustering in environmental selection of NSGA-II when there is not enough available slots, which gives birth to the Clustering NSGA-II algorithm for enhancing diversity of solutions. For
conve-nience,Fi(i= 1,2,3,· · ·, n)denotesndifferent Pareto fronts
in the current generation of NSGA-II, and |Fi| denotes the
number of individuals in Fi; N denotes the population size;
j−1
k=1|Fk| < N and
j
k=1|Fk| −N = Q. Consequently,
clustering technology will be adapted inFj to select
represen-tative individuals with the number ofQ, which are organized
in details as follows:
1) Each individualiis clustered into one group gi.G=
{g1, g2, g3,· · ·, gN}, and| · |is a countable operator.
2) dij and dgigj denotes the Euclidean distance between
individuals i and j and groups i and j in objective
space, respectively. Step 3 will be done until|G|=Q,
and then go to Step 4.
3) gi =gi∪gj and gj is removed from G, wheredgigj
is the smallest distance between each two groups inG
anddgigj = (
|gi|
p=1
|gj|
q=1dpq)/(|gi||gj|).
4) One representative individual i is picked from each
group gi ∈ G with the condition that the distance
betweeniand the centroid ofgiis the smallest against
that of other members ingi and the centroid.
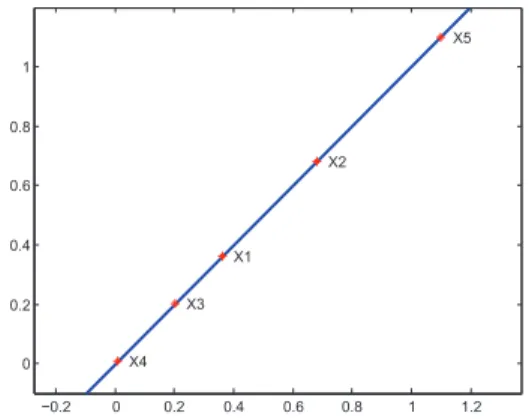
The same clustering technology described above is also em-ployed by SPEA. 0 0.2 0.4 0.6 0.8 1 0 0.1 0.2 0.3 0.4 0.5 0.6 0.7 0.8 0.9 1 X1 X2 X3 X4 X5
Fig. 1. An example of five solutions in the Pareto front.
It is obvious that this clustering algorithm is not reasonable as its distance metrics. For a better understand of this draw-back, an example is designed to demonstrate it. In Figure 1 the solid line denotes the Pareto front, and there are five
solutions (i.e., x1,x2,x3, x4, andx5) while only four slots
are available. With the clustering technology the first step is to measure the distances between each two individuals in the
objective space.x1 andx2 are clustered into the same group
as their Euclidean distance is the smallest. However, it is more
reasonable for enhancing the diversity thatx1 and x3 should
be in the same cluster as the geodesic distance between x1
andx3 is less than others.
MDR technology is utilized in mapping data that lies in manifold to Euclidean space and preserve the neighboring relationship simultaneously by reducing dimension assuming
that all of the data are continuous in manifold2. Figure 2
explains the effectiveness of MDR algorithms utilized over the
example of Figure 13. ISOMAP, LLE, and LE are conventional
MDR algorithms reported in literature.
−0.2 0 0.2 0.4 0.6 0.8 1 1.2 0 0.2 0.4 0.6 0.8 1 X1 X3 X4 X2 X5
Fig. 2. The effectiveness of manifold dimension reduction algorithm utilized over the example in Figure 1.
LE makes use of spectral technologies to perform MDR relying on the theory that Laplacian operator in the graph converges to that in manifold [26]–[28] and eigenvectors of Laplacian matrix converges to Laplacian function [29], [30]. LE presumes that the data lies in a low dimensional manifold
which is embedded in a high dimensional space. Givenmdata
points x1, x2,· · ·, xm in n−dimensional space, LE begins
with formulating a weighted adjacency graphG(V, E)where
V denotes the vertices andE denotes the weighted edges in
graphG which can be introduced by detecting thek nearest
neighbors or by appointing all the points within some fixed
radius (i.e., xi−xj2 < where · is the Euclidean
norm inRn). There are two variations for weighting the edges:
1) each edge is weighted by Wij = e−xi−xj
2/d
, where
dis a parameter for controlling the width of neighbors and
usually chosen with a priori knowledge; 2)Wij is set to0if
verticesiand j are disconnected, otherwise1. Consequently,
the embedding map is given by optimizing Function 1
F(Y) =min m i=1 m j=1 (yi−yj)2Wij, (1)
where Y = {y1, y2,· · ·, ym} denotes the projected points
in low dimensional Euclidean space. Based on the theory proposed in [29], [30] Function 1 can be reformulated as figuring out eigenvalues and eigenvectors for the generalized eigenvector problem:
Lf =λDf, (2)
2The concept continuous is highlighted for theoretically distinguishing
manifold clustering technology which is frequently introduced for data which exists in manifold in the form of few different continuous geometry. In practice, MSR is also suitable for simple discrete manifold data which is favored by ZTD3 benchmark problem in our experiments
3Examples in Figure 1 and Figure 2 are mainly introduced for comparing
method the different behavior of general clustering in Euclidean space and manifold, which will affect the mechanism of improving diversity in real problems.
where L = R − W and R is a diagonal matrix whose
diagonal elementRii =
m
j=1Wij.Lis named the Laplacian
function and is a symmetrical, positive semi-definite matrix. Letf0, f1,· · ·, fm−1be the solutions of Function 2 and sorted
according to their corresponding eigenvalues in a descending
order. Finally, eigenvector f0 corresponding to the smallest
eigenvalue with0is dropped and the nextk eigenvectors for
embedding ink-dimensional Euclidean space:
yi= (f1(i), f2(i),· · ·, fk(i)).
Practically, the similar performance achieved over ISOMAP, LLE, and LE in this context. Because of the higher complexity of ISOMAP and LLE algorithms, LE is employed as a preliminary processing for clustering the solutions lying in the Pareto front of manifold in our proposed MC-NSGA-II.
III. PROPOSEDALGORITHM
In this section, we first propose the general frame-work of manifold dimension reduction based clustering for MOEAs (MC-NSGA-II). In addition, the architecture and pseudo codes of MC-NSGA-II are given.
Before we introduce the clustering algorithm, one fact need to be clarified. The most problem suffered by MDR is the number of dimensions that we should preserve in the projected Euclidean space. This dilemma is also faced by other clustering approaches, because sometimes we do not know exactly the intrinsic dimension of this manifold. Generally
speaking, manifold with dimension k is viewed as being
embedded in Euclidean space with dimension d under the
condition k < d. In this paper, we utilize MDR in
multi-objective evolutionary algorithm with multi-objectives no more than three. Subsequently, it is known that the dimension of the projected data in Euclidean space into which we will map the manifold data is two (for three objectives problems) or one (for two objectives problems). Manifold data with one-dimension in Euclidean space is a line with slope equaling to zero, and with two-dimension in Euclidean space is the line with the slope not equaling to zero.
A. General framework of MDR based clustering for MOEAs
In Algorithm 1,ndenotes the number of individuals needed
to be clustered,ddenotes the number of variables. Moreover,
P only includes all the individuals who lies in the same
Pareto front. | · | is a countable operator. The dimension of
mapped data we kept is two because this clustering algorithm is designed for MOEAs with two or three objectives.
For conveniently measuring the complexity of Algorithm 1, we roughly divide it into three steps: constructing adjacency matrix; performing eigen factorization; and selecting repre-sentative individuals. The time complexity of each step is
O(2n+n∗(n−1)), O(1/3∗n3), and O((n−k)∗n2),
respectively. For this reason the time complexity of the whole
Algorithm 1 isO(n3), andndenotes the number of clustered
individuals.
The difference between MC-NSGA-II and NSGA-II occurs in the environment selection. NSGA-II selects individuals
Algorithm 1Manifold dimension Reduction based Clustering Algorithm for MOEA
Input: 1)the number of clusters k; 2)individuals P ∈Rn×d;
3)all the objective functions F ={f1, f2,· · ·, fm}
Output: krepresentative individuals
1: Evaluate the fitness of P over F(denoted as Y =
[y1, y2,· · ·, yn]T);
2: Construct adjacency matrix W ∈ Rn×n, where Wij =
exp(−yi−yj2
d );
3: ComputeD=L−W, whereLis a Diagonal matrix with
Lii=nj=1Wij;
4: Compute the eigenvalues of D, sort the eigenvalues in
ascending order, and compute the corresponding
eigen-vectorsV = [v1, v2,· · ·, vn]T;
5: Set B = [v2, v3], compute the mapped data X = BTY,
whereX= [x1, x2,· · ·, xn]T;
6: Partition X into group G = g1, g2,· · ·, gn, where gi =
{xi};
7: Find the smallest distance dij between gi and gj by
dij = (|pg=1i| |qg=1j| dgpgq)/(|gi||gj|), set gi = gi ∪gj
and removegj from G;
8: if|G|> k, repeat Step 7, otherwise go to next;
9: Set Q = , for each group gi in G, find the closest
individualp to the centroid ofgi, and setQ=Q∪p;
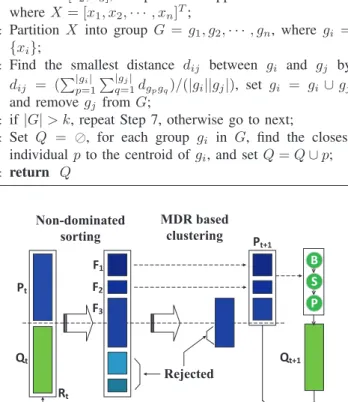
10: return Q Pt Qt F1 F2 F3 Pt+1 5HMHFWHG 1RQGRPLQDWHG VRUWLQJ 0'5EDVHG FOXVWHULQJ Rt B S P Qt+1
Fig. 3. Architecture of MC-NSGA-II algorithm. Circle with alphabet B, S, and P denote binary tournament selection, simulated crossover operator, and polynomial mutation operator, respectively.
with proper number based on crowding distance metric, while MC-NSGA-II chooses individuals by MDR based clustering algorithm. The architecture of MC-NSGA-II is illustrated in Figure 3, and the pseudo codes are listed in Algorithm 2.
IV. EXPERIMENTS
In order to evaluate the performance of MC-NSGA-II, ZTD [31] and DTLZ [32] benchmark problems are employed to simulate experiments upon the proposed algorithm against chosen state-of-the-art peer competitors. In this section, quali-tative experiments are first made over DTLZ test suits by plot-ting the distribution of solutions generated by MC-NSGA-II
Algorithm 2Manifold Dimension Reduction based Clustering NSGA-II
1: Merge populations of parent and offspring to buildPt=
Rt∪Qt. Assign a non-dominated sorting onPtand specify
various fronts:Fi, i= 1,2,· · ·, etc;
2: Set new populationRt+1=. Set a counterj= 1. Until
|Rt+1|+ |Ft| < N, perform Rt+1 = Rt+1 ∪Ft, and
j=j+ 1;
3: Perform Algorithm 1 over individuals inFt+1and include
the most representative solutions with numberN−|Rt+1|;
4: Establish offspring populationQt+1fromRt+1by making
use of the crowded tournament selection, crossover and mutation operators.
to show the obtained non-dominated landscape. Furthermore, two performance metrics for quantitative comparison are also applied over ZTD and DTLZ test suits: 1) spacing metric [33]– [35] is utilized to measure how evenly the solutions of the final non-dominated front are distributed; 2) inverted generational distance (IGD) [36] performance metric is employed for in-vestigating both the diversity and convergence of our proposed algorithm.
A. Test problems
ZDT test suites contain six extensively employed two ob-jectives test problems. Because ZTD5 is a Boolean function which needs binary encoding, it is omitted so as to ZTD1-4 and ZTD6 test problems are included in our study. In addition, DTLZ1-7 test problems with two and three objectives from DTLZ test suites are also utilized. The dimensions, features, and sample size of each test problem in the true Pareto front are described in Table I.
B. Peer Algorithms
For the purpose of justifying the performance of MC based MOEA, MC-NSGA-II is employed to perform comparisons
over NSGA-II4, MOEA/D5, and SPEA26. Furthermore, the
existing MOEA most similar to MC-NSGA-II, clustering NSGA-II, is also included into the list of peer algorithms for comparisons. All the algorithms are performed in Matlab platform except NSGA-II (given the original code of NSGA-II by the authours is implemented by C language), In order to accelerate the speed of clustering, an common extension ver-sion of clustering algorithm for Matlab based on C language
is implemented7.
4The code of NSGA-II is downloaded from: http://www.iitk.ac.in/kangal/
codes.shtml
5The code of MOEA/D is downloaded from: http://dces.essex.ac.uk/staff/
zhang/webofmoead.htm
6The code of SPAE2 is downloaded from: http://delta.cs.cinvestav.mx/
∼ccoello/EMOO/EMOOsoftware.html
7The code is downloaded from: http://legacy.machineilab.org/users/
TABLE I
THE DIMENSIONS,FEATURES,AND SAMPLE SIZE OF EACH TEST PROBLEM IN THE TRUEPARETO FRONT.
Benchmark Dimensions of Feature of PF Sample size in PF Variables Objectives ZTD1 30 2 ii 200 ZTD2 30 2 i 200 ZTD3 30 2 iii,v 200 ZTD4 30 2 ii,v 200 ZTD6 30 2 ii,iii,vii 200 DTLZ1 6 2 iv,v 200 7 3 2000 DTLZ2 11 2 i 200 12 3 2000 DTLZ3 11 2 i,v 200 12 3 2000 DTLZ4 11 2 i,vi 200 12 3 2000 DTLZ5 11 2 vi 200 12 3 2000 DTLZ6 11 2 vi 200 12 3 2000 DTLZ7 21 2 iii,v 200 22 3 2000
The symbols i, ii, iii, iv, v, and vi denote concave, convex, disconnected, linear, multi-modal, and nonuniform regularity of the PF, respsectively.
C. Simulation settings
The size of population for each algorithm is set to500. The
number of function evaluations is fixed at 500. The
perfor-mance on each test problem is obtained from50independent
runs since the test algorithms are stochastic. Besides, simulated
crossover (SBX) rate is fixed at0.9, and polynomial mutation
rate is set to 1/n where n denotes the number of decision
variables. Both Distribution index for polynomial mutation
and SBX are formulated to20. Controlling width of neighbors
in Algorithm 1 is heuristically set to0.2. All the parameters
in MOEA/D are utilized by its default settings given in the original implementation.
D. Qualitative experiments
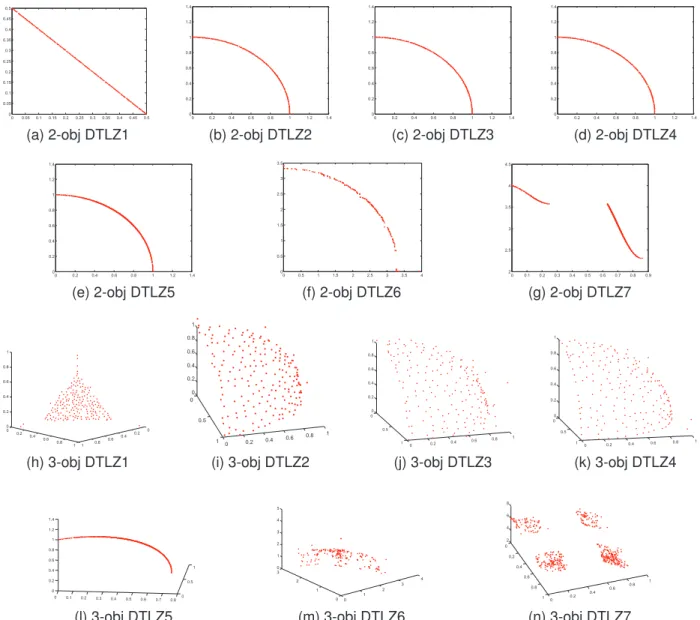
For obtaining an intuitive perception about the performance of our proposed algorithm, the obtained approximate Pareto
fronts by MC-NSGA-II with 500 generations over
DTLZ1-7 test problems with two and three objectives are plotted in Figure 4. Solutions briefly give a landscape of the true Pareto front, which can be viewed as the effectiveness of our proposed algorithm. It is noticed that the landscape of DTLZ6 problem with two and three objectives simulated by MC-NSGA-II is
not as good as expected because of the base function g in
DTLZ6. This deficiency can be viewed as the ineffectiveness of NSGA-II reported in [32] not due to MDR based clustering.
E. Quantitative experiments
Two comprehensive performance metrics, spacing and IGD, are employed to measure the quality of obtained approximate Pareto fronts generated by algorithms mentioned above. S-pacing is a metric estimating how evenly the non-dominated solutions are distributed in the approximation front, the less the better. IGD metric quantifies both convergence and diversity of the approximate Pareto front at the same time. The dimensions, features, and sample size of the true Pareto fronts, which is required for IGD metric to evaluate the performance of given algorithms, are described in Table I. Spacing metric is used by MC-NSGA-II against clustering NSGA-II and NSGA-II while IGD is employed by MC-II against clustering NSGA-II, NSGA-NSGA-II, MOEA/D, and SPEA2.
Experiments results of spacing metric, generated by MC-NSGA-II, clustering MC-NSGA-II, and NSGA-II over 13 test problems with two and three objectives, are plotted in Figure 5. Square markers denote the experimental results of MC-NSGA-II, and it is clear that the result of MC-NSGA-II is superior than others in most benchmark problems. In observing Fig-ure 5, we believe that MC algorithm improves the diversity of solutions in MOEA.
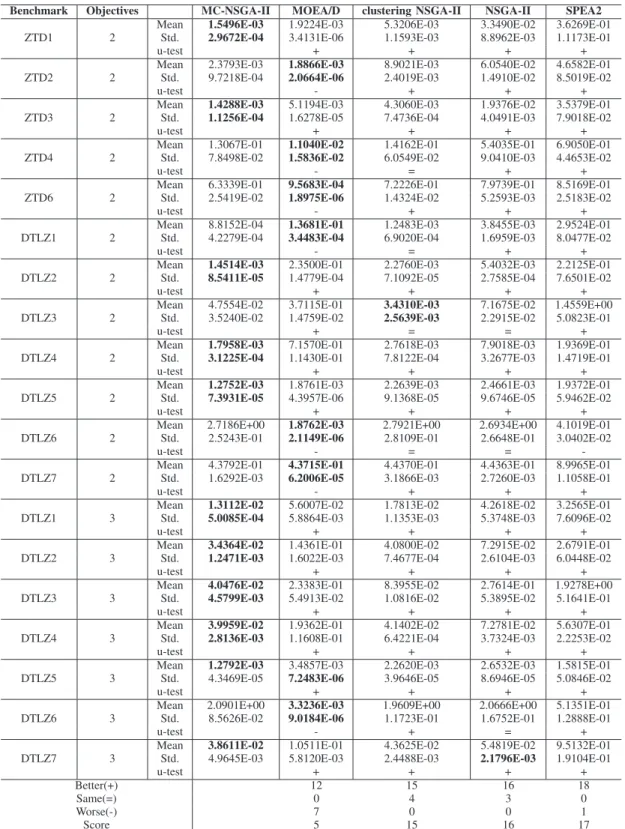
IGD results are descripbed in Table II, and the best results are highlighted in bold face. Besides, Man-Whitney-Wilcoxon rank-sum test [37], a non-parametric statistical hypothesis testing, is also employed for comparing the mean IGD of MC-NSGA-II with that of the other algorithms for highlighting the significance of the findings. Moreover, MC-NSGA-II performs better than other algorithm in ZTD1, DTLZ1 with three objectives, DTLZ2 with two and three objectives, DTLZ3 with three objectives, DTLZ4 with two and three objectives, DTLZ5 with two and three objectives, and DTLZ7 with three objectives over the mean value. MC-NSGA-II and MEOA/D have the similar performance over DTLZ7 with two objectives, and MEOA/D has a better performance over DTLZ6 problem. In summary, MC-NSGA-II wins over most problems of DTLZ. It is highly expected that MC-NSGA-II would perform even better in more complicated problems when Pareto front are most likely in manifold. Moreover, it is also justified that convergence and diversity cannot be treated separately. From the results of IGD, it can be seen that improvement in diversity also enhances the convergence performance. At last, it is concluded from Table II that the proposed algorithm is superior to those chosen MOEAs in terms of IGD.
V. CONCLUSION
Convergence and diversity are two critical ingredients in the design of MOEAs. Based on extended investigation in enhancing diversity employed in most MOEAs and the geometrical regularity of Pareto front, conventional distance metrics, such as Euclidean distance, is not suitable for manifold in which Pareto front often lies. In order to provide a reasonable metric in improving diversity during the evolutionary process, manifold dimension reduction based clustering algorithm for MOEAs is designed in this paper. We first find the intrinsic dimension of this manifold
0 0.05 0.1 0.15 0.2 0.25 0.3 0.35 0.4 0.45 0.5 0 0.05 0.1 0.15 0.2 0.25 0.3 0.35 0.4 0.45 0.5 (a) 2-obj DTLZ1 0 0.2 0.4 0.6 0.8 1 1.2 1.4 0 0.2 0.4 0.6 0.8 1 1.2 1.4 (b) 2-obj DTLZ2 0 0.2 0.4 0.6 0.8 1 1.2 1.4 0 0.2 0.4 0.6 0.8 1 1.2 1.4 (c) 2-obj DTLZ3 0 0.2 0.4 0.6 0.8 1 1.2 1.4 0 0.2 0.4 0.6 0.8 1 1.2 1.4 (d) 2-obj DTLZ4 0 0.2 0.4 0.6 0.8 1 1.2 1.4 0 0.2 0.4 0.6 0.8 1 1.2 1.4 (e) 2-obj DTLZ5 0 0.5 1 1.5 2 2.5 3 3.5 4 0 0.5 1 1.5 2 2.5 3 3.5 (f) 2-obj DTLZ6 0 0.1 0.2 0.3 0.4 0.5 0.6 0.7 0.8 0.9 2 2.5 3 3.5 4 4.5 (g) 2-obj DTLZ7 0 0.2 0.4 0.6 0.8 1 0 0.2 0.4 0.6 0.8 1 0 0.2 0.4 0.6 0.8 1 (h) 3-obj DTLZ1 0 0.5 1 0 0.2 0.4 0.6 0.8 1 0 0.2 0.4 0.6 0.8 1 (i) 3-obj DTLZ2 0 0.5 1 0 0.2 0.4 0.6 0.8 1 0 0.2 0.4 0.6 0.8 1 (j) 3-obj DTLZ3 0 0.5 1 0 0.2 0.4 0.6 0.8 1 0 0.2 0.4 0.6 0.8 1 (k) 3-obj DTLZ4 0 0.1 0.2 0.3 0.4 0.5 0.6 0.7 0.80 0.5 1 0 0.2 0.4 0.6 0.8 1 1.2 1.4 (l) 3-obj DTLZ5 0 1 2 3 4 0 1 2 3 0 1 2 3 4 5 (m) 3-obj DTLZ6 0 0.2 0.4 0.6 0.8 1 0 0.2 0.4 0.6 0.8 1 2 4 6 8 (n) 3-obj DTLZ7
Fig. 4. Solutions of MC-NSGA-II over DTLZ1-7 problems with two and three objectives. Figure 4a-4g are DTLZ1-7 benchmark problems with two objectives, while Figure 4h-4n are DTLZ1-7 benchmark problems with three objectives.
A B C D E F G H I J K L 0 0.005 0.01 0.015 0.02 0.025 clustering NSGA−II MC−NSGA−II NSGA−II
(a) Spacing results over ZTD and DTLZ with two objectives.
A B C D E F G 0 0.02 0.04 0.06 0.08 0.1 0.12 0.14 clustering NSGA−II MC−NSGA−II NSGA−II
(b) Spacing results over DTLZ with three objectives.
Fig. 5. Experimental results of spacing metrics of MC-NSGA-II against clustering NSGA-II, and NSGA-II over ZDT and DTLZ test suits. In Figure 5a, the alphabet A-G, H-K, and L in x axis denote DTLZ1-DTLZ7, ZTD1-ZTD4, and ZTD5 test instances with two objectives, respectively. In Figure 5b, the alphabet A-G in x axis denote DTLZ1-DTLZ7 test instances with three objectives, respectively.
TABLE II
IGDRESULTS OFMC-NSGA-IIAGAINSTMOEA/D,CLUSTERINGNSGA-II, NSGA-II,ANDSPEA2OVERDTLZ1-7, ZTD1-4ANDZTD6
BENCHMARK PROBLEMS,RESPECTIVELY. BEST PERFORMANCE IS HIGHLIGHTED IN BOLD FACE.
Benchmark Objectives MC-NSGA-II MOEA/D clustering NSGA-II NSGA-II SPEA2
ZTD1 2
Mean 1.5496E-03 1.9224E-03 5.3206E-03 3.3490E-02 3.6269E-01 Std. 2.9672E-04 3.4131E-06 1.1593E-03 8.8962E-03 1.1173E-01
u-test + + + +
ZTD2 2
Mean 2.3793E-03 1.8866E-03 8.9021E-03 6.0540E-02 4.6582E-01 Std. 9.7218E-04 2.0664E-06 2.4019E-03 1.4910E-02 8.5019E-02
u-test - + + +
ZTD3 2
Mean 1.4288E-03 5.1194E-03 4.3060E-03 1.9376E-02 3.5379E-01 Std. 1.1256E-04 1.6278E-05 7.4736E-04 4.0491E-03 7.9018E-02
u-test + + + +
ZTD4 2
Mean 1.3067E-01 1.1040E-02 1.4162E-01 5.4035E-01 6.9050E-01 Std. 7.8498E-02 1.5836E-02 6.0549E-02 9.0410E-03 4.4653E-02
u-test - = + +
ZTD6 2
Mean 6.3339E-01 9.5683E-04 7.2226E-01 7.9739E-01 8.5169E-01 Std. 2.5419E-02 1.8975E-06 1.4324E-02 5.2593E-03 2.5183E-02
u-test - + + +
DTLZ1 2
Mean 8.8152E-04 1.3681E-01 1.2483E-03 3.8455E-03 2.9524E-01 Std. 4.2279E-04 3.4483E-04 6.9020E-04 1.6959E-03 8.0477E-02
u-test - = + +
DTLZ2 2
Mean 1.4514E-03 2.3500E-01 2.2760E-03 5.4032E-03 2.2125E-01 Std. 8.5411E-05 1.4779E-04 7.1092E-05 2.7585E-04 7.6501E-02
u-test + + + +
DTLZ3 2
Mean 4.7554E-02 3.7115E-01 3.4310E-03 7.1675E-02 1.4559E+00 Std. 3.5240E-02 1.4759E-02 2.5639E-03 2.2915E-02 5.0823E-01
u-test + = = +
DTLZ4 2
Mean 1.7958E-03 7.1570E-01 2.7618E-03 7.9018E-03 1.9369E-01 Std. 3.1225E-04 1.1430E-01 7.8122E-04 3.2677E-03 1.4719E-01
u-test + + + +
DTLZ5 2
Mean 1.2752E-03 1.8761E-03 2.2639E-03 2.4661E-03 1.9372E-01 Std. 7.3931E-05 4.3957E-06 9.1368E-05 9.6746E-05 5.9462E-02
u-test + + + +
DTLZ6 2
Mean 2.7186E+00 1.8762E-03 2.7921E+00 2.6934E+00 4.1019E-01 Std. 2.5243E-01 2.1149E-06 2.8109E-01 2.6648E-01 3.0402E-02
u-test - = =
-DTLZ7 2
Mean 4.3792E-01 4.3715E-01 4.4370E-01 4.4363E-01 8.9965E-01 Std. 1.6292E-03 6.2006E-05 3.1866E-03 2.7260E-03 1.1058E-01
u-test - + + +
DTLZ1 3
Mean 1.3112E-02 5.6007E-02 1.7813E-02 4.2618E-02 3.2565E-01 Std. 5.0085E-04 5.8864E-03 1.1353E-03 5.3748E-03 7.6096E-02
u-test + + + +
DTLZ2 3
Mean 3.4364E-02 1.4361E-01 4.0800E-02 7.2915E-02 2.6791E-01 Std. 1.2471E-03 1.6022E-03 7.4677E-04 2.6104E-03 6.0448E-02
u-test + + + +
DTLZ3 3
Mean 4.0476E-02 2.3383E-01 8.3955E-02 2.7614E-01 1.9278E+00 Std. 4.5799E-03 5.4913E-02 1.0816E-02 5.3895E-02 5.1641E-01
u-test + + + +
DTLZ4 3
Mean 3.9959E-02 1.9362E-01 4.1402E-02 7.2781E-02 5.6307E-01 Std. 2.8136E-03 1.1608E-01 6.4221E-04 3.7324E-03 2.2253E-02
u-test + + + +
DTLZ5 3
Mean 1.2792E-03 3.4857E-03 2.2620E-03 2.6532E-03 1.5815E-01 Std. 4.3469E-05 7.2483E-06 3.9646E-05 8.6946E-05 5.0846E-02
u-test + + + +
DTLZ6 3
Mean 2.0901E+00 3.3236E-03 1.9609E+00 2.0666E+00 5.1351E-01 Std. 8.5626E-02 9.0184E-06 1.1723E-01 1.6752E-01 1.2888E-01
u-test - + = +
DTLZ7 3
Mean 3.8611E-02 1.0511E-01 4.3625E-02 5.4819E-02 9.5132E-01 Std. 4.9645E-03 5.8120E-03 2.4488E-03 2.1796E-03 1.9104E-01
u-test + + + +
Better(+) 12 15 16 18
Same(=) 0 4 3 0
Worse(-) 7 0 0 1
Score 5 15 16 17
The value of u-test is tested based on its corresponding p-value that is generated by a two-sided Wilcoxon rank sum test upon the results of IGD of independent 50 runs. The marker “-”, “=”, and “+”denotes the performance on the benchmark problem is worse, same, and better than that of others with a significance level of5%.
Pareto front embedd in Euclidean space, and then employ Laplacian eigenmaps technology to map the manifold into the corresponding Euclidean space in which conventional distance metric is properly utilized for clustering solutions within closer neighborhood. For evaluating the performance of our proposed clustering algorithm, manifold dimension reduction based clustering for NSGA-II is implemented by replacing the crowding distance metric in environment selection for preserving diversity. At last, qualitative and quantitative experiments are performed over ZTD and DTLZ test suits against clustering NSGA-II, NSGA-II, MOEA/D, and SPEA2. Results of experiments clearly justify that our proposed algorithm not only improving the diversity, but retaining its convergence performance.
REFERENCES
[1] C. Chang, W. Wang, A. Liew, F. Wen, and D. Srinivasan, “Genetic algorithm based bicriterion optimisation for traction substations in dc railway system,” in Evolutionary Computation, 1995., IEEE Interna-tional Conference on, vol. 1. IEEE, 1995, p. 11.
[2] D. Todd, “Multiple criteria genetic algorithms in engineering design and operation,” Ph.D. dissertation, Citeseer, 1997.
[3] C. M. Fonseca and P. J. Fleming, “Multiobjective optimization and multiple constraint handling with evolutionary algorithms. ii. application example,”Systems, Man and Cybernetics, Part A: Systems and Humans, IEEE Transactions on, vol. 28, no. 1, pp. 38–47, 1998.
[4] R. J.-F. Tsai, L.-M. Li, and J.-K. Chen, “Reconstruction of damaged corneas by transplantation of autologous limbal epithelial cells,” New England Journal of Medicine, vol. 343, no. 2, pp. 86–93, 2000. [5] D. Sasaki, M. Morikawa, S. Obayashi, and K. Nakahashi, “Aerodynamic
shape optimization of supersonic wings by adaptive range multiobjec-tive genetic algorithms,” inEvolutionary Multi-Criterion Optimization. Springer, 2001, pp. 639–652.
[6] A. Petrovski and J. McCall, “Multi-objective optimisation of cancer chemotherapy using evolutionary algorithms,” in Evolutionary multi-criterion optimization. Springer, 2001, pp. 531–545.
[7] K. Deb, A. Pratap, S. Agarwal, and T. Meyarivan, “A fast and elitist multiobjective genetic algorithm: Nsga-ii,”Evolutionary Computation, IEEE Transactions on, vol. 6, no. 2, pp. 182–197, 2002.
[8] E. Zitzler, M. Laumanns, L. Thiele, E. Zitzler, E. Zitzler, L. Thiele, and L. Thiele, “Spea2: Improving the strength pareto evolutionary algorithm,” 2001.
[9] Q. Zhang and H. Li, “Moea/d: A multiobjective evolutionary algorithm based on decomposition,”Evolutionary Computation, IEEE Transactions on, vol. 11, no. 6, pp. 712–731, 2007.
[10] T. Murata, H. Ishibuchi, and H. Tanaka, “Multi-objective genetic al-gorithm and its applications to flowshop scheduling,” Computers & Industrial Engineering, vol. 30, no. 4, pp. 957–968, 1996.
[11] K. Deb, A. Pratap, and S. Moitra, “Mechanical component design for multiple ojectives using elitist non-dominated sorting ga,” in Parallel Problem Solving from Nature PPSN VI. Springer, 2000, pp. 859–868. [12] E. Zitzler and L. Thiele, “Multiobjective evolutionary algorithms: a comparative case study and the strength pareto approach,”evolutionary computation, IEEE transactions on, vol. 3, no. 4, pp. 257–271, 1999. [13] B. Li, J. Li, K. Tang, and X. Yao, “Many-objective evolutionary
algorithms: A survey,”ACM Computing Surveys (CSUR), vol. 48, no. 1, p. 13, 2015.
[14] S. Yang, Z. Yi, X. He, and X. Li, “A class of manifold regularized mul-tiplicative update algorithms for image clustering,” Image Processing, IEEE Transactions on, vol. 24, no. 12, pp. 5302–5314, 2015. [15] D. Huang, Z. Yi, and X. Pu, “Manifold-based learning and synthesis,”
Systems, Man, and Cybernetics, Part B: Cybernetics, IEEE Transactions on, vol. 39, no. 3, pp. 592–606, 2009.
[16] D. Chen, J. C. Lv, and Z. Yi, “A local non-negative pursuit method for intrinsic manifold structure preservation,” in Twenty-Eighth AAAI Conference on Artificial Intelligence, 2014.
[17] X. Li, J. C. Lv, and Z. Yi, “Manifold alignment based on sparse local structures of more corresponding pairs,” inProceedings of the twenty-third international joint conference on Artificial Intelligence. AAAI Press, 2013, pp. 2862–2868.
[18] K. Li and S. Kwong, “A general framework for evolutionary multiob-jective optimization via manifold learning,”Neurocomputing, vol. 146, pp. 65–74, 2014.
[19] Q. Zhang, A. Zhou, and Y. Jin, “Rm-meda: A regularity model-based multiobjective estimation of distribution algorithm,”Evolutionary Computation, IEEE Transactions on, vol. 12, no. 1, pp. 41–63, 2008. [20] M. Belkin and P. Niyogi, “Laplacian eigenmaps for dimensionality
reduction and data representation,”Neural computation, vol. 15, no. 6, pp. 1373–1396, 2003.
[21] S. T. Roweis and L. K. Saul, “Nonlinear dimensionality reduction by locally linear embedding,”Science, vol. 290, no. 5500, pp. 2323–2326, 2000.
[22] M. Balasubramanian and E. L. Schwartz, “The isomap algorithm and topological stability,”Science, vol. 295, no. 5552, pp. 7–7, 2002. [23] U. Ozertem and D. Erdogmus, “Locally defined principal curves and
surfaces,”The Journal of Machine Learning Research, vol. 12, pp. 1249– 1286, 2011.
[24] K. Q. Weinberger and L. K. Saul, “Unsupervised learning of image man-ifolds by semidefinite programming,”International Journal of Computer Vision, vol. 70, no. 1, pp. 77–90, 2006.
[25] H. Yin, “Learning nonlinear principal manifolds by self-organising maps,” in Principal manifolds for data visualization and dimension reduction. Springer, 2008, pp. 68–95.
[26] M. Belkin and P. Niyogi, “Towards a theoretical foundation for laplacian-based manifold methods,” in Learning theory. Springer, 2005, pp. 486–500.
[27] M. Hein, J.-Y. Audibert, and U. Von Luxburg, “From graphs to manifolds–weak and strong pointwise consistency of graph laplacians,” inLearning theory. Springer, 2005, pp. 470–485.
[28] A. Singer, “From graph to manifold laplacian: The convergence rate,”
Applied and Computational Harmonic Analysis, vol. 21, no. 1, pp. 128– 134, 2006.
[29] U. Von Luxburg, M. Belkin, and O. Bousquet, “Consistency of spectral clustering,”The Annals of Statistics, pp. 555–586, 2008.
[30] M. Belkin and P. Niyogi, “Convergence of laplacian eigenmaps,” Ad-vances in Neural Information Processing Systems, vol. 19, p. 129, 2007. [31] E. Zitzler, K. Deb, and L. Thiele, “Comparison of multiobjective evolutionary algorithms: Empirical results,”Evolutionary computation, vol. 8, no. 2, pp. 173–195, 2000.
[32] K. Deb, L. Thiele, M. Laumanns, and E. Zitzler, “Scalable multi-objective optimization test problems,” inProceedings of the Congress on Evolutionary Computation (CEC-2002),(Honolulu, USA). Proceedings of the Congress on Evolutionary Computation (CEC-2002),(Honolulu, USA), 2002, pp. 825–830.
[33] J. R. Schott, “Fault tolerant design using single and multicriteria genetic algorithm optimization.” DTIC Document, Tech. Rep., 1995.
[34] G. G. Yen and Z. He, “Performance metric ensemble for multiobjective evolutionary algorithms,”Evolutionary Computation, IEEE Transactions on, vol. 18, no. 1, pp. 131–144, 2014.
[35] Z. He and G. G. Yen, “Ranking many-objective evolutionary algorithms using performance metrics ensemble,” in Evolutionary Computation (CEC), 2013 IEEE Congress on. IEEE, 2013, pp. 2480–2487. [36] P. Czyz˙zak and A. Jaszkiewicz, “Pareto simulated annealingła
meta-heuristic technique for multiple-objective combinatorial optimization,”
Journal of Multi-Criteria Decision Analysis, vol. 7, no. 1, pp. 34–47, 1998.
[37] R. Stell, J. Torrie, and D. Dickey, “Principles and procedures of statistics: a biometrical approach,”New York: MacGraw-Hill, 1980.