Florida International University
FIU Digital Commons
FIU Electronic Theses and Dissertations University Graduate School
5-12-2017
Analysis of Eye-Tracking Data in Visualization and
Data Space
Sayeed Safayet Alam
Florida International University, [email protected]
DOI:10.25148/etd.FIDC001922
Follow this and additional works at:https://digitalcommons.fiu.edu/etd
Part of theGraphics and Human Computer Interfaces Commons, and theTheory and Algorithms Commons
This work is brought to you for free and open access by the University Graduate School at FIU Digital Commons. It has been accepted for inclusion in FIU Electronic Theses and Dissertations by an authorized administrator of FIU Digital Commons. For more information, please [email protected].
Recommended Citation
Alam, Sayeed Safayet, "Analysis of Eye-Tracking Data in Visualization and Data Space" (2017).FIU Electronic Theses and Dissertations. 3473.
FLORIDA INTERNATIONAL UNIVERSITY Miami, Florida
ANALYSIS OF EYE-TRACKING DATA IN VISUALIZATION AND DATA SPACE
A dissertation submitted in partial fulfillment of the requirements for the degree of
DOCTOR OF PHILOSOPHY in
COMPUTER SCIENCE by
Sayeed Safayet Alam
To: Interim Dean Ranu Jung
College of Engineering and Computing
This dissertation, written by Sayeed Safayet Alam, and entitled Analysis of Eye-Tracking Data in Visualization and Data Space, having been approved in respect to style and intel-lectual content, is referred to you for judgment.
We have read this dissertation and recommend that it be approved.
Mark A. Finlayson
Wei Zeng
Leonardo Bobadilla
B.M. Golam Kibria
Sitharama S. Iyengar, Major Professor Date of Defense: May 12, 2017
The dissertation of Sayeed Safayet Alam is approved.
Interim Dean Ranu Jung College of Engineering and Computing
Andr`es G. Gil Vice President for Research and Economic Development and Dean of the University Graduate School
c
⃝Copyright 2017 by Sayeed Safayet Alam All rights reserved.
DEDICATION
ACKNOWLEDGMENTS
I express my heartiest gratitude to Dr. Radu Jianu who was my supervisor for the first four years. He kept in touch with me even after leaving the university and invariably helped me in completing the ongoing research. Throughout the years, his enthusiasm, assistance, and foresight gave me the necessary strength to proceed through the doctoral program and finish this dissertation.
I would like to express my sincere appreciation to my supervisor Dr. S. S. Iyengar for his help and support during my doctoral program. I am thankful to my committee members, Dr. Finlayson, Dr. Wei Zeng, Dr. Bobadilla, and Dr. Kibria for their valuable recommendations to improve this dissertation. I also thank Dr. Nipesh Pradhananga from the school of construction and Dr. Shahin Vassigh from the department of architecture at FIU for collaborating on two projects which contributed to this dissertation.
I like to thank my family members who supported me over the last five years. My mother Shahin Sultana struggled her whole life to see me successful. This dissertation would not be even possible without her love, patience, and guidance. I could not thank enough my wife, Nahid Ferdous. She always motivated me to complete my dissertation. I am also thankful to my sister Fahrina Alam for her unconditional support over the years. I thank my labmate, Dr. Mershack Okoe. We worked together on many projects, and my discussions with him regarding several research problems greatly benefited me in countless scenarios.
ABSTRACT OF THE DISSERTATION
ANALYSIS OF EYE-TRACKING DATA IN VISUALIZATION AND DATA SPACE by
Sayeed Safayet Alam
Florida International University, 2017 Miami, Florida
Professor Sitharama S. Iyengar, Major Professor
Eye-tracking devices can tell us where on the screen a person is looking. Researchers fre-quently analyze eye-tracking data manually, by examining every frame of a visual stim-ulus used in an eye-tracking experiment so as to match 2D screen-coordinates provided by the eye-tracker to related objects and content within the stimulus. Such task requires significant manual effort and is not feasible for analyzing data collected from many users, long experimental sessions, and heavily interactive and dynamic visual stimuli. In this dissertation, we present a novel analysis method. We would instrument visualizations that have open source code, and leverage real-time information about the layout of the rendered visual content, to automatically relate gaze-samples to visual objects drawn on the screen. Since such visual objects are shown in a visualization stand for data, the method would allow us to necessarily detect data that users focus on or Data of Interest (DOI).
This dissertation has two contributions. First, we demonstrated the feasibility of col-lecting DOI data for real life visualization in a reliable way which is not self-evident. Sec-ond, we formalized the process of collecting and interpreting DOI data and test whether the automated DOI detection can lead to research workflows, and insights not possible with traditional, manual approaches.
TABLE OF CONTENTS
CHAPTER PAGE
1. INTRODUCTION . . . 1
1.1 Motivation . . . 1
1.2 Problem Definition and Contributions . . . 3
1.2.1 Contribution-1:Collecting DOI Data is Feasible . . . 3
1.2.2 Contribution-2: Formalization of DOI Data Collection and Interpretation . 5 1.3 Related Publications . . . 7
1.4 Outline of the Dissertation . . . 7
2. BACKGROUND . . . 9
2.1 Origin of Eye-Tracking . . . 9
2.2 Applications of Eye-Tracking . . . 9
2.2.1 Eye-Tracking as an Interactive Tool . . . 10
2.2.2 Eye-Tracking as a Diagnostic Tool . . . 11
2.3 Analysis of Eye-Tracking Data . . . 11
2.4 Related Work . . . 13
2.4.1 Eye-Tracking Data Collection . . . 13
2.4.2 Eye-Tracking Data Interpretation . . . 14
3. DOI DATA COLLECTION FEASIBILITY INVESTIGATION . . . 16
3.1 Introduction . . . 16
3.2 DOI Data Collection is non-trivial . . . 18
3.3 Methods . . . 22
3.3.1 AOI-Based Viewed Object Detection . . . 25
3.3.2 A Probabilistic Approach to Viewed Object Detection . . . 25
3.3.3 A Predictive Algorithm for Viewed Object Detection . . . 27
3.4 Evaluations . . . 31
3.4.1 Overview . . . 31
3.4.2 Instrumenting a Sample Visualization . . . 33
3.4.3 Study Design . . . 35
3.4.4 Results . . . 36
3.5 Conclusions . . . 47
4. CASE STUDIES . . . 48
4.1 Tracking Data Consumption in Visualization Systems . . . 48
4.2 Understanding Student Learning . . . 49
4.3 Exploring How Workers Detect and Assess Hazardous Situations on Con-struction Scenes . . . 51
5. DOI FORMALIZATION: DATA MODEL AND ANALYTIC QUESTIONS . . 56
5.1 Introduction . . . 56
5.2 General DOI Data Model . . . 58
5.3 Possible and Probable DOI Tasks . . . 62
5.3.1 Related Work . . . 62
5.3.2 Objectives and Probable Data Questions . . . 65
5.4 A Comparison Between AOIs and DOIs . . . 68
5.5 Conclusions . . . 72
6. VISUAL SOLUTIONS FOR DOI INTERPRETATION . . . 73
6.1 Background . . . 73
6.1.1 Heatmap . . . 73
6.1.2 Scanpath . . . 74
6.1.3 Scarfplot . . . 74
6.2 Case Studies . . . 77
6.2.1 DOI-Vis for the Tracking Data Consumption Experiment . . . 77
6.2.2 DOI-Vis for the Student Learning Experiment . . . 79
6.2.3 DOI-Vis for the Construction Hazard Detection Experiment . . . 80
6.3 A Visual Design Space for DOI Analysis . . . 83
6.3.1 Encoding . . . 85 6.3.2 Interaction . . . 87 6.4 Conclusions . . . 91 7. CONCLUSIONS . . . 92 7.1 Summary . . . 92 7.2 Future Work . . . 93 BIBLIOGRAPHY . . . 94 VITA . . . 104
LIST OF TABLES
TABLE PAGE
3.1 Example transition probabilities in our instrumented visualization (assumed). 34
3.2 Transitions from a Movie object. . . 45
3.3 Transitions from Actor objects. . . 45
3.4 Transitions from Director objects . . . 46
3.5 Transitions from Genre objects . . . 46
5.1 Three attributes (isAlive,Gender, and Centrality) for each character in the Les Miserables Data. . . 56
5.2 Example DOIs and attributes collected in each of the three applications de-scribed in Chapter 4. . . 63
5.3 DOI task examples: Indentify (I) and Compare (C). . . 69
LIST OF FIGURES
FIGURE PAGE
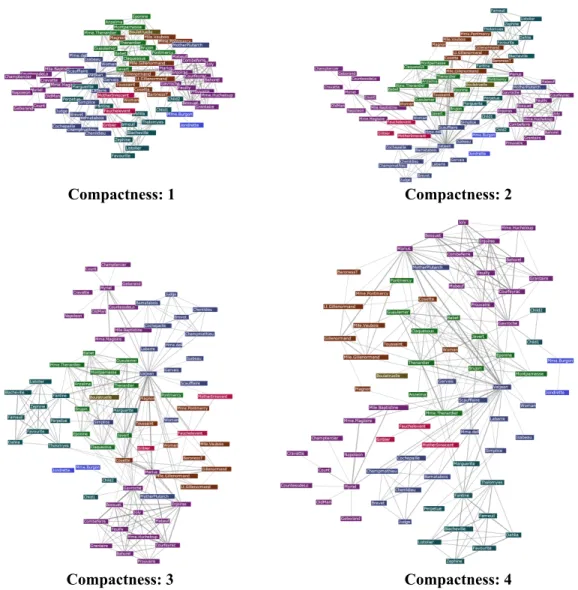
3.1 An interactive network visualization, depicting characters from Les Miserables. 19 3.2 Different layouts of Les Miserables visualization when the compactness is
changed. . . 20
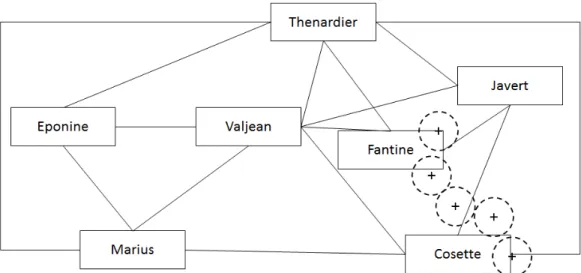
3.3 A network diagram with major characters of Les Miserables. . . 21
3.4 Using proximity to map gazes to visual objects. . . 22
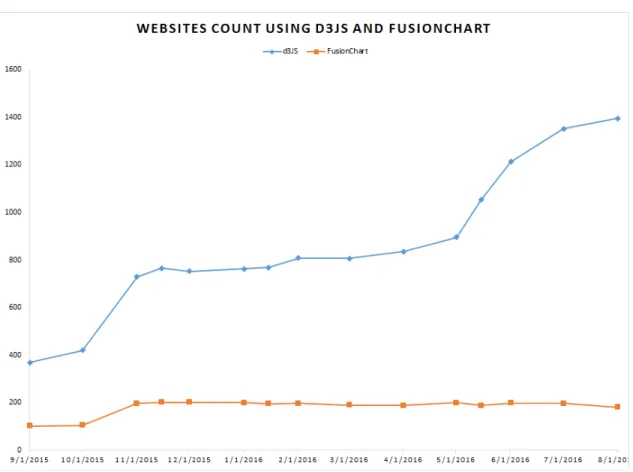
3.5 Comparison of number websites using d3js and FusionChart in their home-pages. Data collected from http://trends.builtwith.com/. . . 23
3.6 Detection of viewed objects in generative visualizations. . . 24
3.7 (a) A real visualization example in which a user fixates in the vicinity of multiple close object groups (red dot). (b) An example of predictive method. . . 26
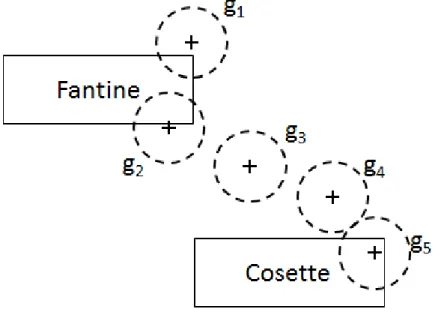
3.8 Calculating gaze scoregsfor a gaze sample landing near an object. . . 27
3.9 A PivotPaths visualization of IMDB data. . . 33
3.10 Comparison between automated and manual viewed object detection. . . 38
3.11 Heatmap views of one subject’s activity on Task 1b. . . 40
3.12 Users’ interest in data objects, in relation to each objects’ relevance to a task, for twelve tasks of four types. . . 42
4.1 A single page of an interactive, HTML environment for learning architecture concepts. . . 51
4.2 A 3D construction scene model (top) instrumented using Bernhard et al.’s color-buffer (bottom) approach [BSHW14]. . . 54
5.1 Two examples of scanpath visualization. Here, (a) displays scanpath with 108 DOIs. (b) displays scanpath with 12 AOIs. . . 57
6.1 Heatmap visualization with three different color schemes: (a) rainbow, (b) gray-scale, and (c) heated object. . . 75
6.2 Scanpath visualization (a) without explicit temporal information, (b) with temporal transitions. . . 76
6.3 An example of Scarfplot visualization. . . 77
6.5 Scanpaths of real DOI data: (Left) Data are shown separately for each user, (Right) Users’ data are shown next to each other for each DOI. . . 80 6.6 A DOI-scarfplot for movie DOI data sketched for two users. . . 81 6.7 An example of interactive heatmap visualization for the student learning
ex-periment (described in Section 4.2). . . 81 6.8 An example of a star-plot glyph. . . 83 6.9 Stacked Glyph plot for Construction . . . 84 6.10 An example of comparison categories by Gleicher et al. [GAW+11]. i)
CHAPTER 1
INTRODUCTION
1.1
Motivation
Eye-tracking is a method of reporting eye activities using specialized hardware called “eye-trackers”. Modern eye-trackers have several capabilities. Primarily, they can locate where a user is looking on a display device (e.g. computer screens, projection screens, hand-held, and wearable displays). Albeit several types of eye-tracking applications exist, we can divide them into two categories: interactive and diagnostic. For the former (inter-active), eye-tracking is used to change an interface based on a user’s visual attention, such as using eye-tracking as an alternate to pointing devices ( e.g. mouse, touch interface) or text inputs. However, the latter (diagnostic) is to describe a user’s visual attention. In this dissertation, we will primarily focus on the diagnostic category of eye-tracking applica-tions.
Usually, a diagnostic eye-tracking study serves the purpose of quantitatively measur-ing people’s attentional process as they solve visual tasks. It plays a major role in research fields such as human-computer interaction, cognitive sciences, and information visualiza-tion. In a typical eye-tracking experiment of this type, an eye-tracker tracks a human subject who sits in front of a computer screen which shows a visual stimulus (i.e. image, video). The eye-tracker reports and records the subject’s gaze-positions on the screen. Experimenters then test their hypotheses by analyzing the collected data using visual and statistical analytic techniques.
Presently, eye-tracking data, accumulated as a stream of 2D gaze-samples, is analyzed by one of two approaches: point-based and area of interests (AOI) -based analysis. In point-based methods, experimenters treat gaze-samples as individual points. Afterward, they relate them to the 2D stimulus shown on the screen during the experiment. In
AOI-based methods, experimenters first define certain regions or areas within the analyzed stimuli. Later, they aggregate recorded gaze samples into those AOIs, which then serve as a higher-level unit of analysis.
A major limitation of these approaches is that both of them involve a significant over-head. That is, experimenters collect gaze samples as pixel coordinates and relate them to visual stimulus by either overlaying gaze-clouds on top of the stimulus image (e.g. heatmap) or by manually defined AOIs. However, if the stimulus is dynamic or inter-active, then experimenters have to repeat these analysis actions for each frame of the stimulus. Such scenario makes these approaches infeasible for dynamic or interactive stimuli.
In data visualization, the arrangement and layout of visual contents are often known at rendering time. Thus, for such case, we can devise a solution for the limitations as men-tioned earlier. For visualizations with open source code, we can instrument visualization so that gaze samples are related to visual contents automatically and in real-time. In other words, we can track what data objects users are viewing at each consecutive moment in time. For example, a network visualization may contain visual representations of nodes and edges. Since we know the locations of these data objects on the screen, we can map gaze samples provided by an eye-tracker to them. To exploit the analogy with the tradi-tional AOI nomenclature, we call such eye-tracked data objects Data of Interest (DOI), and the entire detection and analysis process asDOI eye-tracking analysis.
The particularity of DOI analysis is that we can perform it in data space rather than image space. In other words, we can couple DOIs with visualization data. Thus, DOIs intrinsically contain annotations with data attributes. As a result, we can analyze DOIs on its data-derived properties, independently from visual stimuli. Hence, it will eliminate manually relating gaze samples to visual stimuli process which traditional analysis meth-ods (i.e. point-based and AOI-based) regularly perform. Moreover, DOI analysis will
support experiments of significantly longer sessions than those possible using traditional analysis approaches. Again, operating in data space will leverage DOI analysis to answer many questions that traditional analysis approaches cannot.
1.2
Problem Definition and Contributions
This dissertation makes two contributions. First, we demonstrate that collecting suffi-ciently accurate DOI analysis data is feasible. Second, we seek to create the foundation for DOI eye-tracking analysis (i.e. DOI analysis). We describe the contributions in Sec-tion 1.2.1 and 1.2.2.
1.2.1
Contribution-1:Collecting DOI Data is Feasible
In Section 1.1, we have introduced the idea of relating gazes with data entities in order to produce DOI data. However, we claim that such data collection is feasible. Moreover, we also claim to collect data with our method over long experimental sessions associated with dynamic and interactive stimuli, and open-ended tasks.
We have two assumptions on the eye-tracking experiments which we intend to collect DOI data. First, the experiments must use a visualization that has computer generated visual elements. Second, source codes for generating the visualization must be open source. Hence, experimenters can implement a part of DOI-producing code to the original code.
DOI data will consist collection of DOIs. Albeit DOIs are customizable, we assume they will contain certain information about visualization data entity, screen information, eye-tracking information, and user-specific data. However, for simplicity, we assume DOI data are time-annotated visual elements that participants viewed during such
eye-tracking experiments. We call such visual elements as viewed objects. Thus, viewed objects detection is a critical component of DOI data collection.
For detecting viewed objects, we can adopt a na¨ıve method from AOI analyses. The AOI’s method identifies a visual object as ‘detected’ whenever a gaze point falls on it. However, in AOI analyses, annotated AOIs are usually large and non-overlapping. Albeit the na¨ıve method is sufficient for such scenario, it will not work for complex and dense visualization. For example in a real-life visualization, hundreds of distinct visual objects may occupy the screen at the same time. Again, a human eye can see clearly within a small region (e.g. approximately one inch in diameter) while viewing. Eye-trackers can indicate only the center point of that region, which the user is fixating (i.e., viewing). Since such regions are likely to intersect with multiple visual objects, mapping gazes to individual objects are compelled to be an imprecise process. Moreover, DOI instrumentation should produce data that are sufficiently accurate for meaningful analyses in the context of real-life visualizations.
In our first contribution, we will demonstrate that DOI instrumentation is feasible. We developed a novel DOI detection algorithm. In this algorithm, we have improved upon the na¨ıve AOI detection approach. We implemented it based on the hypothesis that users are more likely to view objects that are visually appealing (e.g. highlighted), or connected (physically or semantically) to previously viewed objects. If these were true, it would allow us to distinguish between potentially viewed objects, when eye-trackers detect gaze points in the vicinity of multiple objects. We have tested this hypothesis. Moreover, we have formalized the idea into our DOI detection algorithm, and evaluated its performance over the na¨ıve AOI detection approach.
In summary, we have developed a DOI detection algorithm. Moreover, we instru-mented and applied the algorithm to collect DOI data from users solving real tasks in
real-life visualization. Afterward, we will evaluate the reliability and effectiveness of the collected DOI data.
1.2.2
Contribution-2: Formalization of DOI Data Collection and
In-terpretation
We claim that using DOI analysis will significantly reduce the human effort on analyzing eye-tracking data. However, to harness its maximum potential, we need to formalize the process of DOI analysis. We can divide the DOI analysis process into two parts: collect-ing data and interpretcollect-ing data. We have contributed by formalizcollect-ing both of the processes above. For formalizing the former, we have developed guidelines to experimenters about instrumentation methods and DOI data model. Again, formalizing the latter part would require two steps. First, we will compile a list of questions that DOI data can answer. Second, we will create novel visual analytics support to answer them.
DOIs are closely related to AOIs. Moreover, using AOIs to analyze eye-tracking is well understood, and a plethora of visualization techniques exist to support such analyses. However, we claim that using these established AOI analysis methods to understand DOI data will not be effective due to two major challenges. First, we have observed that DOI is significantly more granular and larger than data collected in traditional eye-tracking experiments. For example, using the DOI approach, we could track hundreds or thousands of DOIs over hour-long experimental sessions. Such scenarios contrast with traditional AOI methods which typically track tens of AOIs over one or two minutes. AOI methods are unlikely to handle the significantly larger volumes of DOI data. Second, DOI data can be more useful in getting insights about the semantics of the data a user explores since DOIs couple them with data attributes. Such attributes are unavailable in AOI data, and
AOI methods have not been designed to explore them. Thus, AOI methods will not be sufficiently flexible to answer the new questions that DOIs can answer.
We divide this contribution into three sub-contributions. The first sub-contribution addresses the formalization of collecting DOI data process. The latter two address the two steps of interpreting DOI data.
Sub-contribution 2.1: We have contributed to the formalization of DOI data col-lection process by providing guidelines to experimenters about how to instrument visu-alizations and collect DOI data. We claim that DOI data can be difficult to analyze if collected data are in a clumsy format. We also provided a DOI data model to enable experimenters to produce adequately formatted DOI data. For example, in a network vi-sualization, DOIs may be individual nodes or clusters of nodes. Usually, links represent a single relationship among nodes. Thus, simple links are unable to represent multiple semantic relationships among DOIs. Hence, a representation of all essential relationships among DOIs to test intricate hypotheses afterward. On the other hand, testing hypotheses may become infeasible if collected DOI data is without any data model. Thus, we would need a DOI data model to facilitate experimenters.
Sub-contribution 2.2:Generally, analyzers test their hypotheses by questioning their experimental data. We have compiled the type and range of analysis queries that are askable to DOI data. Such questions will allow researchers to understand the classes of scientific queries that the DOI methodology can support. Methodologically, we started from the formal data model devised as part of contribution2.1and exhaustively identified the types of questions that the data model can support, an approach used with reliable results in the past to generate tasks-requirements for other categories of data (e.g. geo-graphical data, temporal data).
Sub-contribution 2.3: Presently, visualization is an essential tool for data analysis. For this sub-contribution, we have explored designs of visual solutions that could
fa-cilitate DOI data analyses. We explored existing visual techniques for analyzing AOI data. Moreover, we implemented new visualizations based on them to support the inter-pretation of the larger and richer DOI data. We also explored these methods and their effectiveness while collaborating with real-life researchers to answer real-life scientific questions. Specifically, we asked design requirements and feedback from collaborators at FIU and incrementally modified our designs according to their suggestions.
1.3
Related Publications
For the accomplishment of this dissertation, we have published the following articles:
• R. Jianu and S. S. Alam. A data model and task space for data of interest (doi) eye-tracking analyses. IEEE Transactions on Visualization and Computer Graphics, PP(99):1–1, 2017.
•S. Alam and R. Jianu. Analyzing eye-tracking information in visualization and data space: from where on the screen to what on the screen. IEEE Transactions on Visualiza-tion and Computer Graphics, PP(99):1–1, 2016.
• Mershack Okoe, Sayeed Safayet Alam, and Radu Jianu. A gaze-enabled graph visualization to improve graph reading tasks. InComputer Graphics Forum, volume 33, pages 251–260. Wiley Online Library, 2014.
1.4
Outline of the Dissertation
We discuss the background of the research of this dissertation in Chapter 2. Next, we discuss feasibility and effectiveness of collecting DOI data in Chapter 3. In Chapter 4, we described three experiments where we collected DOI data. Again, in Chapter 5, we described a data model for DOI. Moreover, we also described analysis questions that are
applicable for DOI data. Next, in Chapter 6, we described visual solutions to interpret DOI data. Finally, we conclude our discussion of this dissertation in Chapter 7.
CHAPTER 2
BACKGROUND
2.1
Origin of Eye-Tracking
Eye-trackers provide a stream of gaze points based on the subtle positions changes of eye-pupils. However, the pattern of human perception reveals that stream of gaze points are not smooth trajectories. Earlier, in the 1800s, eye movements were interests affiliated to know how people read. Javal [Jav78], Lamare [Lam93], and Hering [Her79] first discovered that people make stops while scanning through words while reading. Thus, eye-movements yield two types of gaze points: fixations, and saccades. Fixations are the points where eye stops moving for a while. On the other hand, saccades are intermediate points where eye stops for a small amount of time during switching fixations from one object to another. Edmund Huey was the first to build an eye-tracking device to track eye movement in reading [Hue08]. He used lenses with small openings attached to a pointer. Later, Judd and Buswell developed an eye movement camera to capture eye motions [JB22].
With the progress of eye-trackers, it opened paths for more research in different disciplines. In 1967, Yarbus correlated eye-movements with user study tasks [Yar67]. Presently, Eye-tracking is a popular tool in many research domains such as psychology, neuroscience, Marketing, human-computer interaction, data visualization [Duc02]. The applications of eye-tracking technology are discussed in Section 2.2.
2.2
Applications of Eye-Tracking
Eye-tracking technology is gradually getting more accurate, faster, and cheaper [Duc07]. Due to its availability, more research studies are adopting it as a utility. We can divide
the applications of eye-tracking technology into two categories: Interactive, and Diagnos-tic [Duc02]. This dissertation primarily focuses on eye tracking’s diagnosDiagnos-tic role. How-ever, we briefly discuss its interactive applications in Section 2.2.1. Later, we discuss the use of eye-tracking as a diagnostic application in Section 2.2.2.
2.2.1
Eye-Tracking as an Interactive Tool
Eye movement is significantly faster than hand movements [SJ00]. Thus, many computer-based systems have used tracking as an interactive tool. Examples include using eye-tracking as an alternative to pointing devices (e.g. mouse, touch-interface) in 2D [Jac91] and 3D [Bol90, TJ00], and even as a text-input device [MR02]. However, eye-tracking is proved as ineffective compared to traditional selective devices (e.g. mouse, touch, and keyboard) due to the difficulty of differentiating between view-gazes and interaction-gazes. Such case is known as the “Midas Touch Problem” [Jac91]. For example, a Graphic User Interface (GUI)-based system uses eye-tracking as a selective system. The system’s screen contains two icons: ‘A’ and ‘B’. If a user wants to select ‘B’ but looks at ‘A’ (view gaze) then looks at ‘B’ (interaction gaze) then the system may find it ambiguous to decide which icon the user wants to select. To overcome this problem, Jacob proposed several solutions such as use blinks or dwell time. However, using such solutions make eye-tracking interaction slower than traditional interaction methods [Jac91].
Despite being fast, eyes are not effective to control interactions. Moreover, it cannot fully serve the selective system purpose [ZMI99]. However, gaze points can indicate user’s intentions and displays can alter in gradual and unobtrusive nature [Jac91, JK03]. Such interactive displays are labeled as “Gaze-Contingent Displays” (GCD) [Duc07]. Researchers developed GCDs by changing either screen contents [RLMS03, PN02] or underlying model before rendering [DDGM00, OD01, ODH02, OAJ14].
2.2.2
Eye-Tracking as a Diagnostic Tool
Computer vision has a profound impact on artificial intelligence, medical diagnostics, and visual perception [FP11, Hua96]. Examples of computer vision applications in-clude facial recognition [SK87], video scene detection [YL95, GJL+06], and disease
detection such as Alzheimer’s disease [CRA+04], glaucoma [BZB+09], and
retinopa-thy [CBKI11, CBT+08]. Eye tracking technology uses similar methods to computer
vi-sion for diagnostic purposes. Many research user studies use eye-tracking as a diagnostic tool. The most common form of a diagnostic eye-tracking study is a user solving visual tasks by observing visual stimuli on a computer screen while an eye-tracker records the user’s gaze positions. Then, analyzers process the gaze data offline to understand how the user observed the stimuli and solved the tasks [Duc07]. In this way, researchers used eye-tracking to understand how people recognize faces [GS+14, SSP14], how attention
changes with emotion [VTPM13], how diseases may affect perception [KLCA14], and how students learn from visual contents [ZAB14, May10, vGS10, CAM13].
The use of eye-tracking in data visualization research has increased with the growing popularity, accuracy, and affordability of the technology. For example, major contribu-tions building on eye-tracking technology include the network readability study by Pohl et al. [PSD09] and Huang et al. [HEH08,HE05]. Moreover, the study on tree drawing per-ception by Burch et al. [BKH+11, BAA+13]. As well as, the study on decision-making
visualization by Kim et al. [KDX+12].
2.3
Analysis of Eye-Tracking Data
Research studies using diagnostic eye-tracking heavily depend on analyzing eye-tracking data. Studying from the literature, we divide the analysis methods for eye-tracking data into two paradigms: point-based methods and area of interests (AOI)-based methods [BKR+14].
Point-Based analysis methods treat each gaze sample as a discrete point. As such, point-based analyses usually report overall gaze patterns as spatial or temporal distributions of 2D gaze coordinates over visual stimuli. The major weaknesses of this approach include the requirement to show the same set of stimuli to the human subjects (i.e. users) to be comparable, and the obligation to always analyze the collected gaze data in conjunction with the 2D screen capture. Analyzing each stimulus will result in longer analysis time for larger numbers of stimuli. Moreover, analyzers have to relate gazes with the semantic contents of stimuli manually. This approach is highly ineffective in the case of interactive and dynamic stimuli.
Alternatively, analyzers often define AOIs that are relevant to their hypotheses onto a stimulus [BKR+14]. The number of gaze points landing into an AOI can then be
com-puted automatically as a proxy for users’ interest in that AOI. Higher level analyses are thus possible. Examples include but are not limited to investigating reading patterns where each word is an AOI [BR05, SD04], to observe where and how long users look at visual regions [Coc09, KDX+12], and to compare interfaces utilizing AOI fixation counts and frequencies [C¸ HGF09]. Usually, analyzers define AOIs over stimuli manually, and the process is significantly time-consuming. Thus, the analysis process takes prolonged time with the increasing count of stimuli and visual contents within those. Moreover, the process becomes prohibitively inefficient for interactive and dynamic stimuli (e.g. video) since analyzers have to define AOIs for each frame of a video.
Several solutions are proposed to overcome this weakness. One example is the au-tomatic AOI annotations using gaze clustering algorithms [PS00, SD04, DBP14]. How-ever, an increase of complexity of visual contents in stimuli may increase the difficulty of the AOI annotation process. Stellmach et al. proposed the object of interests (OOI) concept for 3D stimuli where eye-trackers collect gaze points on the surface of 3D ob-jects available in a scene [SND10]. Additionally, Steichen et al. [SCC13] and Kurzhal
et al. [KHW14] suggested the possibilities of dynamic AOI annotations in the case of computer generated visual contents. However, this concept is still unexplored. This dis-sertation leverages this concept of dynamic AOI and OOI into developing DOIs. We discuss related works about DOIs in Section 2.4.
2.4
Related Work
Our contributions in this dissertation explore analyses of eye-tracking data in two aspects: collection and interpretation. We discuss related work about them in the following sec-tions.
2.4.1
Eye-Tracking Data Collection
In Section 1.2, we have mentioned that the Data of Interests (DOI) is an improved solution for eye-tracking data analysis. The idea of DOI originates from the objective of automat-ically detecting which data objects a user of a visualization views. As such, DOI is the mapping of gaze samples to data objects rather than pixel positions. Recently, Sundstedt et al. [SBS+13] and Bernhard et al. [BSHW14] introduced a process called gaze to object mapping (GTOM) for identifying objects which are targets of users’ attentions in 3D vir-tual environments. This dissertation contributes a similar approach albeit in the context of relating gaze points with semantic contents of network diagram [OAJ14]. However, relating gaze points with semantic contents of any visualization is non-existent. Salvucci et al. presented a probabilistic approach to predict viewed objects on a computer screen using eye-tracking [SA00]. Moreover, Salvucci et al. alongside with Okoe et al. [OAJ14] indicated that leveraging semantics of visual contents can significantly improve viewed-object predictions. However, both Salvucci et al.’s and Okoe et al.’s contributions were limited to simple visualizations. Salvucci et al. tested their methods over a simple
gaze-added WIMP (i.e. Window, Icon, Menu, and Pointer) interface. On the other hand, Okoe et al. explored only network visualization [OAJ14]. The idea of OOI and GTOM sig-nificantly influenced our first contribution. Moreover, One of our methods innovates on existing techniques for mapping gazes to objects by adopting the probabilistic method by leveraging semantic contents of visualizations.
2.4.2
Eye-Tracking Data Interpretation
Many methods exist to interpret eye-tracking data visually. Blascheck et al. catego-rized several existing visualization techniques for point-based and AOI-based visualiza-tions [BKR+14]. More complex visual analytics software systems and solutions include those by Andrienko et al. [AABW12], Weibel et al. [WFE+12], Kurzhal et al. [KHW14], and Blascheck et al. [BJK+16].
However, DOI data can be significantly more granular and larger than AOI data. Moreover, we can associate DOIs with a wealth of directly-derived data attributes from the tracked data. Hence, we have hypothesized that DOI data can answer questions that AOI cannot. Moreover, data interpretations using traditional AOI analysis methods are ineffective for DOI data. This shortcoming motivated our second contribution, with its two sub-goals: determining what questions DOI data can answer that AOI cannot, and creating support for theses questions.
To accomplish the former, we formalized the DOI specific analytical tasks. Any spe-cific categorizations of analysis tasks for eye-tracking data are currently non-existent. However, task categorizations, task taxonomies, and task frameworks do exist for other types of data and analyses. For example, Wehrend and Lewis [WL90], Shneiderman [Shn96] discussed general features of task taxonomies in the context of data visualization. Re-cently, Brehmer et al. [BM13], Schulz et al. [SNHS13], and Rind et al. [RAW+15]
pro-posed a multilevel typology that can be applicable for creating complete task descrip-tions regardless of domain specificadescrip-tions. Amar et al. provided a comprehensive cat-egorization of low-level tasks [AES05]. Moreover, task taxonomies exist for several specific types of data visualizations such as for graph visualizations [LPP+06], group
level graphs [SSK14], multidimensional data visualizations [War02], and geo-temporal data [AAG03, Rot13]. Hence, as a part of our second contribution, we draw inspiration from these studies for an attempt to categorize DOI analysis tasks.
To achieve the interpretation part of our second contribution 1.2.2, we explored the designs of visualizations to perform analysis tasks for DOI. Moreover, we employed ex-isting visual techniques available for AOI analyses. We also adopted interaction tech-niques from Yi et al.’s taxonomy for information visualization [YaKSJ07] to support DOI analysis tasks.
CHAPTER 3
DOI DATA COLLECTION FEASIBILITY INVESTIGATION
3.1
Introduction
The motivation of using DOI analyses over traditional methods (i.e. point-based and AOI-based) is that it will significantly reduce human interventions for analysis processes. We claim that using DOI analyses over traditional AOI analysis will have four major advantages. First, experimenters will be able to analyze a user study with longer sessions. A traditional eye-tracker reports data in 60Hz to 120Hz. Hence, for an hour-long session, experimenters may have to examine60×1×60×60 = 216,000gaze points for a single user. Although, automated interpretation visualization tools exist with contemporary eye-tracker software packages. However, such analysis tools can only create visualizations for the entire experimental sessions and can identify only screen locations. For example, in an eye-tracking experiment, a user was looking at a diagram for one hour would have produced gaze points recorded all over the given stimulus. It cannot identify which visual elements the user was viewing. For that, experimenters would have to go over every gaze points over time manually. DOI analyses data would contain time annotated data elements. Hence, it will be possible to analyze eye-tracking data for longer sessions.
Second, DOI analyses can handle eye-tracking data from more users than traditional methods can handle. DOI analyses eliminate the process of manually relating gaze points with semantic contents of given stimuli. For example, data interpretation of a user of an eye-tracking study may take 5-6 hours. Thus, a user study with ten subjects will require analysis for 50-60 hours. DOI analyses automatically relate gaze points with semantic contents which eliminate such exhaustive process. Hence, DOI analyses enable experimenters to conduct user studies with more subjects than it was possible.
Third, DOI analyses enable experimenters to use complex, interactive, and dynamic visualizations for eye-tracking user studies. We discussed that experimenters have to spend a significant amount to time to relate gaze points with given stimulus. However, if a stimulus is interactive and dynamic, then experimenters have to repeat the same task for each frame. Moreover, the process is even more difficult for dense and complicated visualization layout. DOI analyses facilitate experimenters by providing data elements that users were interested in real-time.
Fourth, experimenters can test users with more open-ended tasks in eye-tracking stud-ies with DOI-based analysis. Traditional eye-tracking analysis methods can provide a relatively small amount of analysis data compared to DOI data. Thus, they compel exper-imenters tends to use small close ended tasks. However, DOI analyses can provide detail reports of elements that users tend to see. Thus, more behavioral analyses are possible with DOI-based analysis.
Again, DOI data collection is the process of relating gaze points to data elements. With the open-source code for generating visualizations, we know layouts of all visual elements and their corresponding data elements. However, eye-trackers report data with low-resolution and inaccuracy. Due to peripheral vision, a human can view an area rather than a precise pixel. Thus, identifying objects a user viewed is challenging. We discuss the difficulty of DOI data collection in Section 3.2.
We implemented a method of fuzzy interpretation of gaze data. The method reports a likelihood of viewing an object rather than certainty. Using this approach, we imple-mented a novel viewed-object-detection algorithm. We discuss the incremental develop-ment of this algorithm and instrudevelop-mentation to visualization code process in Section 3.3.
To test our algorithm, we have conducted an eye-tracking experiment with instru-mented DOI data collection code. Details of the experimental setup and results are dis-cussed in Section 3.4. Finally, we provide our conclusion remarks in Section 3.5.
3.2
DOI Data Collection is non-trivial
Many eye-tracking related studies generate visual stimuli using computer programs coded by visualization researchers. In such cases, since the structure and layout of the visual content in the stimuli is accessible at runtime, we can relate gaze positions supplied on the fly by an eye-tracker to the visual content of such visualizations.
For example, in Figure 3.1, a network diagram depicts the characters from the novel Les Miserables. Each rectangle node represents a character. Links between two characters are present if they co-occurred in the same chapter. The colors indicate different clusters of characters. The visualization has interactions such as dragging nodes (i.e. rectangles). Moreover, users can input a ‘compactness’ value to change the layout of the visualization. The lower value of compactness indicates a more compact arrangement of the network. Figure 3.2 shows the same visualization with four different compactness values.
Figure 3.3 is a smaller version of the original network diagram with the major charac-ters only. The dashed circles represent a user’s gaze points in it. This figure also depicts collected gaze points from a user looking at Fantine and Cosette. It is evident that we can match the positions of these gaze samples to the two rectangles closest to them (i.e. the visual content). Hence, we label this eye-tracking analysis as being in ‘visualization space’ (i.e., relating gazes to visual objects shown on the screen) rather than ’image space’ (i.e., relating gazes to pixels in a stimulus).
Moreover, the visual objects in the Les Miserables visualization stand for actual data: the characters in the novel. So, mapping gazes to the visual objects let us in turn map the user’s interest to data elements, such as Fantine and Cosette. Moreover, by looking at the properties of the data that users are viewing, we can relate visual interest to semantic data subsets or perspectives. For example, Fantine and Cosette are both female characters and, based solely on the few gaze samples depicted in our example. We could conclude that the
Figure 3.1: An interactive network visualization, depicting characters from Les Miser-ables.
Figure 3.2: Different layouts of Les Miserables visualization when the compactness is changed.
Figure 3.3: A network diagram with major characters of Les Miserables.
user is viewing female characters. In other words, we can track the user’s interest in data subsets defined based on gender. Similar data subsets could be identified based on central or secondary characters, or positive or negative characters. We call this eye-tracking data analysis in “data space” or data of interest (DOI) analysis.
We hypothesize that this is a compelling alternative to traditional analysis methods, primarily AOI (area of interest) analyses. Using conventional AOI-based approaches, analyzers would be required to define AOIs over already rendered 2D stimuli. In our example, and most real-life visualizations, this would be time-consuming because of the many visual objects displayed on the screen. Moreover, the 2D layout of the visualization may change in response to user interactions (e.g., users move node), in which case the AOI annotations would need to change. Moreover, AOIs are not annotated by any attributes so defining AOIs on characters wouldn’t implicitly mean that we could also track other data subsets such as based on gender.
However, as described in Chapter 1, mapping gazes to individual data objects can be imprecise since eye-trackers produce noisy, low-resolution data. Figure 3.4 illustrates this. We have 2 rectangles Fontaine and Cosette, and five gazes g1, g2, g3, g4, g5. The
na¨ıve approach of maps gazes to the nearest visual object. Using this approach, we can confidently mapg1, g2 to Fontaine, andg4, g5to Cosette. However, it is unclear what we
should do aboutg3since it is squarely between the two nodes.
Figure 3.4: Using proximity to map gazes to visual objects.
3.3
Methods
Initially, we assume that our eye-tracking experiments will use visualizations which are accessible for instrumentation to programmers. Thus, graphical information (e.g. posi-tion, size, shape) of internal visualization primitives (e.g. circles representing nodes in a graph) are available at rendering time.
Our methods only operate over visualizations with open source code. Such scenario is a limitation of our work. However, we claim that open source code libraries are gaining popularity over proprietary applications. Figure 3.5 shows a comparison between two
popular visualization libraries: d3JS (open source code) and FusionChart (proprietary application).
Figure 3.5: Comparison of number websites using d3js and FusionChart in their home-pages. Data collected from http://trends.builtwith.com/.
We have mapped gazes to visualization primitives using our viewed-object-detection algorithm. Our algorithm computes “object viewing scores” that express the likelihood that an object is perceived given a particular gaze sample. The viewed-object-detection algorithm outputs object viewing scores from which we can construct DOI data. We developed viewed-object-detection algorithm incrementally in three stages. First, we de-tected objects using the na¨ıve approach of AOI binning. We considered each visual object as an AOI. In this method, we consider the objects as ‘viewed’ where most recent gaze points land. Second, we developed a method for calculating a probabilistic fuzzy score for each object based on the proximity of gaze landing to the object. Third, we developed
an algorithm based on Salvucci’s method [SA00] to calculate the object-viewing-score based on the probabilistic score and an additional prediction score. The algorithm calcu-lates prediction scores based on the semantic contents of data.
Figure 3.6: Detection of viewed objects in generative visualizations.
We depict our general approach for collecting DOI data in Figure 3.6. Eye-trackers supply gaze samples in screen space. The ‘Screen to Model Transformation’ module (Fig-ure 3.6) transforms these gaze samples to the visualization model space. The ‘Renderer’ module renders the visualization, and supply information regarding shapes and positions of visual objects, and model transform information. Afterward, our algorithm combines gaze samples and visual object positions to detect viewed objects by calculating object-viewing-scores. A prediction module uses information about what a user has seen in the
Figure 3.6, we observe that the eye-tracker and the visualization model pass the gaze po-sitions and visualization information respectively to the viewed object detection module. We hypothesized that this would reduce the inaccuracies previously illustrated, by allow-ing us to discriminate which visual object is users is likely to be lookallow-ing at when gazes land near multiple objects. We provide more details about the three stages of developing viewed-object-detection algorithm in following subsections.
3.3.1
AOI-Based Viewed Object Detection
A na¨ıve approach to detect viewed objects, is to treat object shapes as dynamic AOIs and determine that a viewed object is that with the most recent fixation landing in its AOI. Analysts use manually drawn AOIs are in the same manner in offline eye-tracking data analysis, and the similar concept of objects of interest (OOIs) has been proposed already by Stellmach et al. [SND10] for generative 3D content.
The problem with this approach is that for highly granular visual content, such as individual nodes or labels, users often fixate in the vicinity of the object rather than on the object itself. A potential solution is to pad object AOIs to be slightly larger than the objects. However, larger AOIs may lead to overlaps in cluttered visualizations. We demonstrate and quantify these observations in Section 3.4. Ultimately, the problem lies with an inability to determine with absolute certainty what a user is observing. We de-scribe it in more detail in the next section.
3.3.2
A Probabilistic Approach to Viewed Object Detection
Human eyes do not fixate on a single pixel point. Instead, they can view a small region with high definition. Typically, such regions are about one inch in diameter, though spe-cific values depend on viewing conditions. Thus, eye-trackers cannot indicate particular
pixel points, unlike mouse input. As such, it is impossible to tell with certainty which objects a user is viewing, if the user is fixating in the vicinity of multiple close objects (Figure 3.7(a)). Such situation is not a significant problem for traditional AOI analy-ses, which use large AOIs. Conversely, we aim to detect the viewing of granular visual content, such as network nodes or glyphs, in cluttered visualizations.
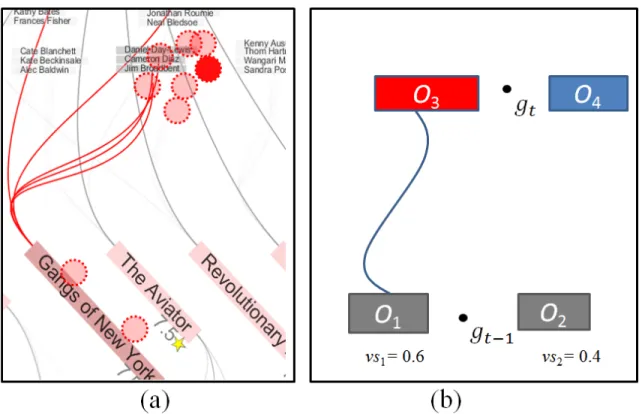
Figure 3.7: (a) A real visualization example in which a user fixates in the vicinity of multiple close object groups (red dot). (b) An example of predictive method.
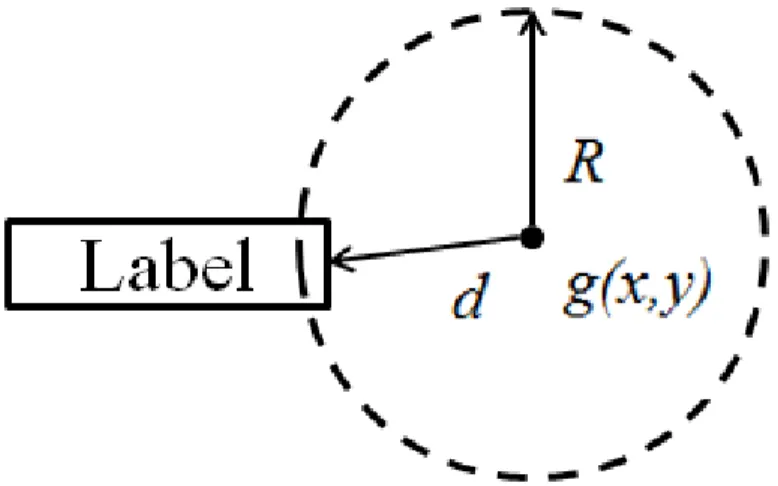
We advocate for a fuzzy interpretation (i.e. finding a partial truth value instead of absolute true or false) continuous of gaze data and detect likelihoods that objects are viewed rather than certainties. To this end, we can compute object gaze scores gs (for all objects iin a visualization, and at all timest). The gaze scores range between zero-user did not view the object, and one-zero-user certainly viewed the object. We show them in Figure 3.8 and Formula 3.1. In Figure 3.8, d is the distance from the object to the gaze
Figure 3.8: Calculating gaze scoregsfor a gaze sample landing near an object. gsi,t = 1−min ( 1,(d R) ) (3.1) The region of radiusRused in the formula is analog to the user’s foveated region, and as such needs to be constant in screen space. Thus, if we zoom the view in or out,Rneeds to be scaled accordingly in model space to remain constant in screen space. Salvucci et al. [SA00] and Okoe et al. [OAJ14] used similar approaches.
Finally, we note that the object scores (gs) do not directly equate to probabilities. The distinction is important because our implementation can detect two objects as being viewed simultaneously (gs1 = 1andgs2 = 1). We think this is appropriate since a person
can in fact visually parse multiple objects at the same time if they fall within the user’s foveated region, and even think of multiple objects as a unit for specific task purposes.
3.3.3
A Predictive Algorithm for Viewed Object Detection
Salvucci and Anderson described the concept of “intelligent gaze interpretation” in the context of a gaze-activated interface [SA00]. They more accurately detected which in-terface control a user was gazing at, by integrating both the proximity of the gaze to the control, and the likelihood that the control was the target of a gaze-interaction, based on
the current state and context of the interface. Formally, their algorithm identified the most likely currently viewed itemiviewedby solving Equation 3.2.
iviewed= argmax i∈I
[P r(g|i)·P r(i)] (3.2) In Equation 3.2,P r(g|i)is the conditional probability of producing a gaze at location
ggiven the intention of viewing itemi, andP r(i)is the prior probability of an itemibeing the target of a gaze interaction. Salvucci and Anderson based these prior probabilities on assumptions about how we may use an interface, and hard code them into their system.
We adapt Salvucci and Anderson’s paradigm to solve the ambiguous case when a gaze sample lands close to multiple objects (e.g., Figure 3.7(a)). For example, in a network vi-sualization, we may assume that a user who has just viewed a node n, will more likely view one of n’s neighbors than another random node, perhaps especially if the user pre-viously highlighted nodenand its outgoing edges. In Section 3.4 we show quantitatively that this assumption holds for one tested visualization.
We consider the simplified scenario in Figure 3.7(b): four visual objects (O1...4), two
of which are connected (O1 andO3), and one of which is highlighted (O3), are shown on the screen. A new gaze sample registers between O3 and O4 at time t. Intuitively, it is
more likely that the user viewedO3 since it is highlighted. Moreover, if we knew thatO1
was seen just before the current moment and assume that users view neighboring nodes together, then this likelihood becomes stronger.
Formally, we computevsi,t(i.e., the viewing scorevsof objectiat timet) by weighing
the gaze scoregsi,t described in Section 3.3.2 by a prediction scorepsi,tthat objectiis a
viewing target at timet:
vsi,t =gsi,t×psi,t (3.3)
from a viewing transition function T between objects: T(j, i) gives the likelihood that objectiis viewed after object j is perceived. We will assume thatT(j, i)is input to our algorithm. Concrete examples of what T(j, i) could be linked to are whether objects i
andjare somehow connected or related, or whether they are part of a special group (e.g., highlighted elements). Moreover, connections could be either visual, such as an explicit edge or leader line or an implicit sharing of similar visual attributes (e.g., color, shape), or semantic (e.g., both nodes are actors). More examples ofT(j, i)functions, and means of defining them are described throughout this chapter.
To computeps, we could considerpsi,t = T(j, i)but that would involve knowingj,
the previously viewed object, with absolute certainty. As exemplified in Figure 3.7(b), we often cannot unequivocally determine which item was viewed at a given time: O1’s
previous viewing score (vs1,t−1 = 0.6), is just slightly larger than O2’s viewing score
(vs2,t−1 = 0.4), and thus an absolute choice ofO1 overO2as previously viewed element
would be rather arbitrary. In other words, we cannot say with absolute certainty which of the two objects was viewed before because the user fixated between them.
In more general terms, our computation ofpsi,tmust account for multiple itemsj that
may have been viewed before. These itemsjare those with a previous visual scorevsj,t−1
that is greater than 0. As such, we compute psi,t as a weighted average of all transition
probabilities from objects j with vsj,t−1 > 0 , to our current item i. The weights are
given by the likelihood that an objectjwas viewed before - in other words by its previous viewing scorevsj,t−1. This computation is provided in Formula 3.4.
psi,t = ∑ j vsj,t−1×T(j, i) ∑ j vsj,t−1 , where 0≤i≤nandgsi,t >0 0≤j ≤nandvsj,t−1 >0 0≤j ≤nandgsj,t = 0 (3.4)
Finally, Formula 3.4 needs to add a significant constraint. Intuitively, our approach means that previously viewed objectsj act as referees with varying degrees of influence (i.e., previous visual scores) in a competition between currently viewed items i. This analogy provides the intuition for the important constraint: an object should not referee a competition that it is part of. For example, in our simplified scenario, using O3 as a
previous element in a competition between itself andO4would result in an open feedback
loop and should be avoided. Formula 3.4 reflects this restriction by the 3rd inequality. We provide the algorithm pseudocode in Algorithm 1.
Algorithm 1Viewed Object Detection Algorithm
1: Inputs:
Oi,...,n= tracked visualization objects (shapes, positions)
g(x, y) =gaze sample in model space (timet)
T(i, j) =viewing transition function (T(i, j)∈[0,1])
2: Outputs:
vsi,t =momentary viewing scores of all objects (i= 1, . . . , n). 3: fori←1tondo
4: Computegsi,t using Formula 3.1 5: max←0
6: fori←1tondo 7: ifgsi,t >0then
8: Computeps′i,t using Formula 3.4
9: ifps′i,t > maxthen
10: max←ps′i,t
11: fori←1tondo 12: vsi,t ←gsi,t×
ps′i,t max
Last, we note that to optimize for speed, we only compute prediction scores for ob-jects with non-zero gazes (Algorithm 1, line 7). Also, we compute viewing scores for every gaze sample, rather than every fixation. We believe that doing so leads to results that are less dependent on how fixations are computed and more robust. Since our eye tracker’s sampling rate is 120Hz, the scoresvsj,t−1 were calculated just 8ms ago, an
in-such, instead of using the rawvsj,t−1score, we use an average of the last several viewing
scores. Moreover, for all practical purposes, the term vsj,t−1 should be replaced in the
previous formulas by W1
W
∑
k=1
vsj,t−1−k, where we consider recentW gaze samples.
How-ever, we note that our algorithm can take as input fixations rather than individual gaze samples, in which case this step would not be necessary. Moreover, additional smoothing and filtering such as those summarized by Kumar et al. [KKP+08] could be used to clean gazes before feeding them into our algorithm. We tried removing gaze samples with high velocity as they are likely to be part of saccades but observed no discernable improvement in our algorithm’s output.
Performance analysis: The algorithm traverse through all objects (n) to find those in the proximity of a gaze sample or fixation (kt). Then, to compute psfor each of the
kt potentially viewed elements, the algorithm iterates over kt−1 objects with non-zero
viewing scores from the previous iteration. The run-time of the algorithm is O(n) (i.e. linear) if we consider the number of objects that a user can view at any time to be a constant. Such case is not true for example if the visualization is zoomed out too much and falls entirely within the algorithm’s R radius. However, in such cases, the output of the algorithm would be meaningless, and we should abort the algorithm.
3.4
Evaluations
3.4.1
Overview
We instrumented D¨ork’s interactive PivotPaths visualization of multifaceted data [DRRD12]. Figure 3.9 shows the visualization which links to the popular internet movie database (IMDB). In this figure, movies are displayed in the center of the screen, actors at the top, and directors and genres share the bottom space. Actors, directors, and genres associated
to movies are connected through curves. Users can highlight objects and their connected neighbors by hovering over them. We collected data from9subjects, each using our in-strumented visualization for 50minutes on a series of structured and unstructured tasks. We used these data to test the validity and effectiveness of our approach in two ways.
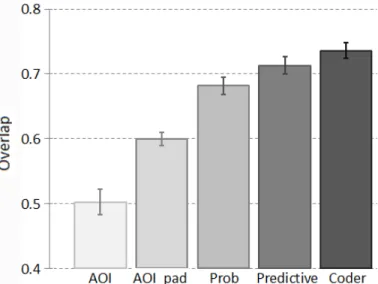
First, we compared the output of the predictive algorithm to human annotations. We found that data collected automatically were on average as similar to human annotations, as human annotations were analogous to each other. We conducted this analysis for all three viewed detection algorithms described in Sections 3.3.1 to 3.3.3 and found that the AOI algorithm performs poorly compared to the other two and that the predictive algorithm improves detection accuracy by about5%(Figure 3.10).
Second, we showed that our instrumentation method provides relevant information that we can leverage in novel ways. We showed both qualitatively and quantitatively that viewed objects detected automatically were closely correlated to tasks people were asked to do, and those data collected automatically from many users could answer novel questions about how people use visualizations (Figures 3.11 and 3.12). We also demon-strated quantitatively that the viewing-biases our predictive algorithm exploits exist and are significant: our users were much more likely to look at objects that were highlighted and connected to each other (Table 3.2, 3.3, 3.4, and 3.5). Each table shows data for a movie element (e.g. movie, actor, director) to a target object divided by: (i) type of source and target; (ii) whether the target was highlighted (H); (iii) whether the target was highlighted and connected to the source (HC); (iv) and whether source and target were neither highlighted nor connected. Columns show: (i) the number of direct transitions for the source/target combination; (ii) the observed transition probability from the source to that target; (iii) the (unbiased) probability of transition between source and target if all elements had equal probability to be viewed; (iv) the ratio between observed and unbiased transition probabilities.
3.4.2
Instrumenting a Sample Visualization
Figure 3.9: A PivotPaths visualization of IMDB data.
Our PivotPaths visualization of IMDB data renders movies in the center of the screen, actors on top, and genres and directors at the bottom (Figure 3.9). The visualization con-nects actors, directors, and genres by curves to the associated movies. Moreover, the elements are larger, and their connections more salient, if they associate with multiple movies. Actors, genres, and directors are colored distinctively, which is particularly im-portant for genres and directors since they occupy the same visual space. Such views are created in response to users’ searches for specific movies, actors, and directors, and show only data that are most relevant to the search. As shown in Figure 3.9, users can hover over visual elements to highlight them and their connections. Users can also click
on visual elements to transition the view to one centered on the select element. Finally, users can freely zoom and pan.
We opted to instrument this visualization for three reasons. First, it is highly interac-tive and would be significantly difficult to analyze using traditional analyses. Second, it contains visual metaphors, graphic primitives, and interactions typical of a wide range of visualizations. Third, movie data are familiar to a wide variety of users.
To choose transitions functionsT underlying our predictive algorithm, we made sim-ple assumptions about how the visualization is used, an approach also employed by Salvucci [SA00]. We assumed that transitions between connected items would occur more often than between unconnected objects. We also assumed that highlighted ele-ments are more likely to be viewed than those that are not. We translated these assump-tions into specific weights, as exemplified in Table 3.1. We show in Section 3.4.4 that these assumptions hold for the instrumented visualization and the subjects that used it in our study.
Table 3.1: Example transition probabilities in our instrumented visualization (assumed). Assumed visual and transition weights
Movie to unconnected actor 1 Movie to connected actor 3 Movie to unconnected genre 1 Movie to connected genre 3 Movie to unconnected director 1 Movie to connected director 3
Finally, as part of the instrumentation, our system collected screen shots, interactive events (e.g., zooming, panning), raw gaze samples captured at a rate of120Hz, and visual elements that users viewed. For each viewed element we recorded the type (i.e., movie, actor, director, genre), its label, its gaze score (gs), its prediction score (ps), and the aggregated viewing score (vs). All recorded data were time stamped.
3.4.3
Study Design
Setup: We used the IMDB visualization described above, and an SMI RED-120Hz con-nected to a 17” monitor. Subjects were seated approximately30′′away from the display.
Subjects: We collected data from 9graduate and undergraduate students aged between
20and 30years. Six subjects were male, and three were female. All were paid$10 for their participation.
Protocol: At first, we gave the subjects a description of the study’s purpose and proto-col. Next, we introduced them to the visualization and asked to perform a few training tasks. This introductory part lasted on average10minutes. The main section of the study followed, involved multiple instances of four types of tasks, and lasted approximately50
minutes.
Tasks: Subjects completed four types of structured and unstructured tasks. To solve struc-tured tasks, subjects had to consider data that were better defined and with fewer variables than in unstructured tasks. This made it easier for us to test the degree to which object-detection was aligned with the task associated data. On the other hand, data collected in unstructured tasks may be more ecologically valid. We limited the time we allowed subjects to spend on each task for two reasons: to manage the total duration of the study and to make results comparable across users.
• Task1 (structured): Finding four commonalities between pairs of movies. The tasks were limited at three minutes each, and subjects solved the following four instances of this task: (a) Goodfellas and Raging Bull; (b) Raiders of the Lost Ark and Indiana Jones and the Last Crusade; (c) Invictus and Million Dollar Baby; (d) Inception and The Dark Knight Rises.
• Task2 (structured): Ranking collaborations between a director and three actors (2
minutes,4instances): (a) Ang Lee; (b) Tim Burton; (c) James Cameron; (d) David Fincher.
• Task3 (semi-structured): Given three movies, subjects were asked to recom-mend a fourth (5minutes, 3 instances): (a) Catch Me If You Can, E.T. the Extra-Terrestrial, and Captain Phillips; (b) To Kill a Mockingbird, The Big Country, and Ben-Hur; (c) Inglourious Basterds, The Avengers, and Django Unchained.
• Task4 (unstructured):Given a brief and incomplete description of the “Brat Pack”, a group of young actors popular in the 80’s, subjects were asked to find additional members and movies they acted in. Subjects solved one such task, in approximately
5minutes.
3.4.4
Results
Data Collected Automatically are Similar to that of Human Annotators
We tested whether the outputs of the three algorithms described in Sections 3.3.1 to 3.3.3 (AOI, probabilistic, and predictive) are comparable to annotation data obtained from human coders who inspected screen-captures with overlaid gaze samples and manually recorded what subjects viewed. We included in our analysis the AOI algorithm version which uses padded AOIs (Section 3.3.1). As shown in Figure 3.10, we found that the overlap between human annotations and the predictive algorithm’s output is similar to the overlap within the set of human annotations and that the predictive algorithm outperforms the others.
We enlisted the help of five coders and asked them to annotate eye-tracking data cor-responding to one task of approximately three minutes, for each of six subjects. The task
the same for all five coders. Coders spend approximately one hour per subject completing their annotation. This long duration meant it was unfeasible to code data from more users or more tasks. Four coders completed all six assigned annotation tasks, while one was able to annotate the data of only three subjects.
Coders used an application that allowed them to browse through screen captures of a users’ activity with overlaid gaze coordinates. We asked coders to advance through the videos in 100ms time-steps, determine what visual objects their assigned subjects were viewing, and record those objects along with the start time and the end time of their viewing. If unsure which of multiple viewed objects, coders were allowed to record all of them.
We transformed each coder’s annotation into temporal vectors with100ms resolution. These vectors contained at each position one or several objects that were likely viewed by the subject during each 100ms time-step. We then created similar representations from our automatically collected data. Finally, we defined a similarity measure between two such vectors as the percentage of temporally aligned cells from each vector that were equal. We defined equality between vector cells as a non-empty intersection between their contents.
For each algorithm, we computed the similarity of its output for each subject’s data to all available human annotations of the same data. This yielded4coders×6subjects+ 1
coder×3subject= 27similarities per algorithm. We averaged these similarities and plot-ted them as the first four bars in Figure 3.10. Then, we compared each coder’s annotation of a subject’s data to all other available annotations of the same data. Since we had five annotations for three subjects, yielding3subjects×10annotation pairs= 30similarities. Moreover, four annotations for the remaining subjects, yielding 3 subjects× 6 annota-tion pairs= 18similarities. Finally, we obtained48similarities, which we averaged and plotted as the last bar of Figure 3.10. The first four bars show the overlap between the
outputs of the three algorithms described in Section 3.3 (padded-AOI approach included), and annotation results of human coders. The last bar shows the overlap within the set of human annotations. Values correspond to averages over multiple tasks, multiple subject data sets, and multiple annotators, and are computed as described in Section 3.4.4. Error bars extend by one standard error.
Our collected data allowed us to perform this analysis for all three algorithms de-scribed in Section 3.3, as well as for the padded version of the AOI method. If we only consider gaze scoresgsthat are equal to one (Section 3.3.1) and no predictive component, we essentially have the output of the AOI algorithm. If we limit the analysis togsscores alone, without the prediction component described in Section 3.3.3, we have the output of the probabilistic approach described in Section 3.3.2.
Figure 3.10: Comparison between automated and manual viewed object detection.
Data Collected Automatically are Relevant and Useful
We used two analyses to show that data collected automatically are tightly correlated with the tasks that users had to do. We chose this evaluation for two reasons. First, it provides
observer or analyst who is unfamiliar with a subject’s intentions can determine what these are by looking at the subject’s visual interest data.
Second, it demonstrates how the automated collection of eye-tracking data can facil-itate novel insights into how we use visualizations. Our approach allowed us to quantify that a users’ interest in a visual item present on the screen decays exponentially with a decrease in the items’ relevance to a task. It is a well-known fact in visualization com-munity that users follow “information scent” when solving tasks visually [Nie03]. Thus, from this fact, we were able to quantify this effect.