Essays on the Economics of Higher Education and Employment
Seung Eun Park
Submitted in partial fulfillment of the requirements for the degree of
Doctor of Philosophy under the Executive Committee of the Graduate School of Arts and Sciences
COLUMBIA UNIVERSITY 2019
c
2019
Seung Eun Park All Rights Reserved
ABSTRACT
Essays on the Economics of Higher Education and Employment Seung Eun Park
This dissertation studies legal and institutional policies that help to reduce the barriers to educational attainment and employment. The first chapter examines the effect of availability of juvenile record laws on education attainment and employment using state statue revisions after the passage of the federal Second Chance Act. The second chapter examines enrollment patterns of students who drop out from community colleges and identify four typologies of college dropouts and important factors that contribute to college success. The third chapter estimates the impact of federal Pell Grant eligibility on financial aid packages, labor supply while in schools, and academic outcomes for community college students. The three chapters together shed light on how federal, state, and institutional policies can help reduce the academic and employment barriers for the marginalized population in the United States.
Contents
List of Figures . . . iv
List of Tables . . . vii
Acknowledgements . . . ix
Dedication . . . xi
Preface . . . xii
1 The Effects of Revisions to Juvenile Record Laws on Education Out-comes and Employment after the Second Chance Act of 2007 1 I Introduction . . . 2
II Juvenile Record Laws . . . 7
III Data and Sample . . . 12
IV Empirical Methodology . . . 14 V Results . . . 16 VI Sensitivity Checks . . . 20 VII Discussion . . . 25 VIII Figures . . . 28 IX Tables . . . 40 Bibliography . . . 46
2 Understanding Dropouts Among Community College Students: Using Cluster Analysis and Data Mining 51 I Introduction . . . 52
II Dropouts at Community College . . . 55
III Research Questions . . . 57
IV Data and Sample . . . 58
V Cluster Analysis . . . 59 VI Classification . . . 66 VII Conclusion . . . 78 VIII Figures . . . 82 IX Tables . . . 93 Bibliography . . . 102
3 The Impact of Pell Grant Eligibility on Community College Students’ Financial Aid Packages, Labor Supply, and Academic Outcomes 108 I Introduction . . . 109
II Financial Aid at Community Colleges . . . 113
III Data and Sample . . . 116
IV Empirical methodology . . . 117 V Results . . . 122 VI Discussion . . . 130 VII Figures . . . 132 VIII Tables . . . 140 Bibliography . . . 146 Appendices 151 I The Effects of Revisions to Juvenile Record Laws on Education Outcomes and Employment after the Second Chance Act of 2007 . . . 152
II Understanding Dropouts Among Community College Students: Using Cluster Analysis and Data Mining . . . 156
III The Impact of Pell Grant Eligibility on Community College Students’ Finan-cial Aid Packages, Labor Supply, and Academic Outcomes . . . 168
List of Figures
Figure 1.1 Historical juvenile arrest rates per 100,000 persons aged 10–17 (1980– 2016) . . . 28 Figure 1.2 Enacted revisions to juvenile record laws: Expand information sharing
to youth-serving systems, 2008–2015 (11 states) . . . 29 Figure 1.3 Enacted revisions to juvenile record laws: Expand interagency
infor-mation sharing, 2008–2015 (16 states) . . . 29 Figure 1.4 Enacted revisions to juvenile record laws: Limiting public access to
records, 2008–2015 (9 states) . . . 30 Figure 1.5 Enacted revisions to juvenile record laws: Expand eligibility for sealing
and expungement, 2008–2015 (23 states) . . . 30 Figure 1.6 Treatment assignment: Expand information sharing with youth-serving
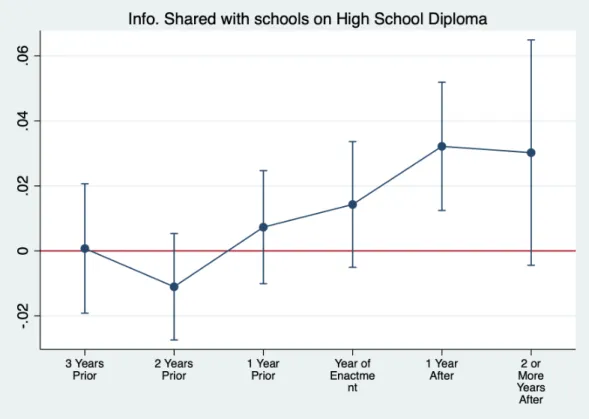
systems . . . 31 Figure 1.7 Treatment assignment: Expand interagency information sharing . . . 32 Figure 1.8 Treatment assignment: Limit public access to records . . . 33 Figure 1.9 Treatment assignment: Expand eligibility for sealing and expungement 34 Figure 1.10 Common trends assumption check: Probability of high school graduation 35 Figure 1.11 Common trends assumption check: Probability of ever attending college 36 Figure 1.12 Common trends assumption check: Employment . . . 37 Figure 1.13 Leads and Lag of Information Sharing with Schools on High School
Figure 1.14 Leads and Lag of Information Sharing with Schools on Ever Attending
College . . . 39
Figure 2.1 Dropouts Proportion (51.7%) . . . 82
Figure 2.2 HCA Cluster Dendrogram . . . 83
Figure 2.3 HCA Heatmap (Cluster Row Only) . . . 84
Figure 2.4 HCA Heatmap excluding Summer Semester (Cluster Row Only) . . . 85
Figure 2.5 Matched Completers . . . 86
Figure 2.6 Variable Importance Plot for Trials . . . 87
Figure 2.7 Variable Importance Plot for Low-Credit Medium Dropouts . . . 87
Figure 2.8 Variable Importance Plot for High-Credit Medium Dropouts (bottom) 88 Figure 2.9 Variable Importance Plot for Late Dropouts . . . 88
Figure 2.10 ROC Curves for Trials . . . 89
Figure 2.11 ROC Curves for Low-Credit Medium Dropouts . . . 90
Figure 2.12 ROC Curves for High-Credit Medium Dropouts . . . 91
Figure 2.13 ROC Curves for Late Dropouts . . . 92
Figure 3.1 Estimated Pell Grant by EFC (2008-10 Cohort) . . . 132
Figure 3.2 Density Plot for All Schools . . . 133
Figure 3.3 Grant Amounts ($) for Loan and No-Loan Schools . . . 134
Figure 3.4 Loan and Total Aid Amounts ($) for Loan and No-Loan Schools . . . 135
Figure 3.5 Density Plot for Loan Schools (Top) and No-Loan Schools (Bottom) . 136 Figure 3.6 Density Plot for Continuous Schools (Top) and Non-Continuous Schools (Bottom) . . . 137
Figure 3.7 Grant Amounts ($) for Continuous and Non-Continuous Schools . . . 138
Figure 3.8 Loan and Total Aid Amounts ($) for Continuous and Non-Continuous Schools . . . 139 Figure A1.1 Un-Adjusted Outcome Trend: Probability of high school graduation . 153
Figure A1.2 Un-Adjusted Outcome Trend: Probability of ever attending college . 154 Figure A1.3 Un-Adjusted Outcome Trend: Employment . . . 155 Figure A2.1 Number of Clusters using Elbow Method (top) and Silhouette Width
(bottom) . . . 161 Figure A2.2 Clara Goodness of Fit: Silhouette Plot . . . 162 Figure A2.3 Comparison between HCA cluster (top) and CLARA cluster (bottom) 164 Figure A2.4 HCA Heatmap (Cluster Row and Columns Only) . . . 166 Figure A2.5 Matched Completers using Euclidean Distance . . . 167
List of Tables
Table 1.1 Descriptive Statistics: 2004–2007 . . . 41
Table 1.2 Difference-in-Differences Estimates of Revisions to Record Laws on Ed-ucational Attainment and Employment, 2004–2016 . . . 42
Table 1.3 Difference-in-differences Estimates of revisions to Record Laws on Ed-ucation Attainment and Employment, Y2004-2016: Contrasting Any Record Laws versus Specific Record Laws . . . 43
Table 1.4 Difference-in-differences Aggregated States Estimates on Education At-tainment and Employment, Y2004-2016s . . . 44
Table 1.5 Difference-in-differences Heterogeneous Estimates Education Attain-ment and EmployAttain-ment, Y2004-2016 . . . 45
Table 2.1 Sample Characteristics of 2002-2004 Cohort by Dropout Indicator . . . 94
Table 2.2 HCA Clustering Distribution . . . 95
Table 2.3 HCA Demographic Characteristics . . . 95
Table 2.4 HCA Enrollment History . . . 96
Table 2.5 HCA Financial Aid . . . 97
Table 2.6 Distribution of Cluster Assignment for Completers . . . 98
Table 2.7 10-fold Cross Validation Performance Metrics . . . 99
Table 2.8 Out-of-Sample Prediction Performance: AUC values . . . 100
Table 2.9 Cross Validation Performance Metrics using Relative Year Variables as Predictors . . . 101
Table 3.2 RD Estimates of Effect of Pell Eligibility on Composition of Financial Aid Packages . . . 141 Table 3.3 RD Estimates of Effect of Pell Eligibility on Academic Outcomes and
Student Labor Supply (Loan Schools) . . . 142 Table 3.4 RD Estimates of Effect of Pell Eligibility on Academic Outcomes and
Student Labor Supply (Loan Schools) . . . 143 Table 3.5 RD Estimates of Effect of Pell Eligibility on Academic Outcomes and
Student Labor Supply (Loan Schools) . . . 144 Table 3.6 GRR Bounds on RD Estimates (2008-2010 Cohort, Loan Schools Only) 145 Table A2.1 CLARA Clustering Distribution . . . 160 Table A2.2 Logistic Regression with Elastic Net Regularization: Grid Search Results165
Acknowledgements
This work would not have been completed without the help and support from my dis-sertation committee members, colleagues and friends, and my family. First and foremost, I would like to express my deepest gratitude to my academic advisor, Judith Scott-Clayton. Judy gave me the opportunity to work with her as a research assistant at the Community College Research Center (CCRC) and co-authoring one of my dissertation chapters. She has been an amazing professor, academic mentor, and advisor. I have benefited tremendously from her guidance and unconditional support in every step of my Ph.D. journey.
I am deeply grateful for Peter Bergman, my second reader, who has motivated my research interests from the beginning of my dissertation. His insightful feedback and methodological advice gave me the strength to pursue deeper into my research. I am thankful for Jordan Matsudaira and Bryan Keller for their very helpful comments that significantly contributed to advancing my papers. I also benefited greatly from Dan O’Flaherty, who introduced me to the field in the economics of crime, which fueled my motivation, excitement, and enjoyment in the research topic.
I have benefited enormously from conversations from other faculty members and CCRC staffs. I am grateful to Thomas Bailey, Alex Bowers, Clive Belfield, Alex Eble, Joydeep Roy, Nikki Edgecombe, Young Sun Lee, Ilja Cornelisz, and Susana Loeb for sharing their comments. I would also like to thank my research assistants, Adnan Moussa, Casey Nguyen, and Omar Rodriguez-Esparza, who went through various legal documents and helped me in categorizing different laws in my job market paper.
friend. We have exchanged many conversations about research, life, and values. I can not imagine my Ph.D. life without him being involved. He gave me strength through my turmoils and supported me through technical conversations while developing my research papers.
I also thank my Ph.D. and CCRC colleagues Florence Ran, Veronica Minaya, Beth Kopko, Rachel Yang, Yilan Pan, Amy Brown, and Vivian Liu, who shared their support and encouragement. Many thanks to my former colleagues and friends who trusted in me, valued my life decisions, and encouraged persistence throughout. To name a few, Jihoon Hyun, Hannah Lee, Rachel Yoo, Dawhe Park, Albert No, Hyechang Lee, and Erica Chung.
I am very lucky to have met my friends at Milal, New York. They shared their happiness and love that encouraged me throughout my Ph.D. journey. I hope our society becomes a better world by appreciating and loving persons with intellectual disabilities.
Lastly, words can not describe the support and love of my parents, aunt, and uncle. I am indebted to their support and love emotionally, financially, and maturity.
This dissertation is dedicated to my parents, family, and Milal Mission in New York,
who shared their endless love, strength, and laugh through the hills and valleys of my Ph.D. journey
Preface
The United States continues to face achievement and employment gaps by race. In 2015-2016, the adjusted cohort graduation rate among white, public high school students was 88% while black, public high school students graduated at a rate of 76% (Digest of Education Statistics, 2017, table 219.46). At the college level, white students achieved six-year com-pletion rates that were 1.5 times higher than those observed for black students (62 percent versus 37 percent) (Shapiro, et al., 2017). Similarly, despite historically low national un-employment levels (Bureau of Labor Statistics, 2018, Report 1076), the unun-employment rate for blacks is about two times higher than the unemployment rate for whites (7.5 versus 3.8 percent). In my dissertation, I focus on three marginalized populations who are predomi-nantly comprised of racial minorities, ex-juvenile offenders, community college dropouts, and low-income students. I examine legal and institutional policies that can help reduce the bar-riers for these populations. In particular, I provide empirical evidence that (1) information sharing with the justice system and schools can help improve educational attainment in the aggregate, (2) separating out by dropout typologies can help better identify specific factors that contribute to completion, and (3) a modest Pell grant can help reduce the need to work while enrolled in college and thereby increase enrollment intensity.
Chapter one examines the effect of availability of juvenile records on high school gradu-ation, the probability of ever attending college, and employment. In this chapter I evaluate state revisions to juvenile record laws (39 states) after the passage of the federal Second Chance Act (Y2008-2015) (39 states), which were intended to help re-entry of ex-juvenile offenders. After categorizing the laws into four types - information sharing with schools,
information sharing across interagency, limiting information sharing with the public, and expanding sealing and expungement eligibility - I utilize a difference-in-difference strategy to estimate the effects of each four types on educational outcomes and employment. I find significant and positive impacts of school notification laws on both educational outcomes. In addition, I find suggestive positive effects of expanding sealing and expungement eligibility on employment. By contrast, I find no robust impact from reforms that shared information across interagency and limited public access to juvenile records. This study contributes to the economic debate on information sharing and confidentiality in the justice system.
In chapter two, I use cluster analysis to identify four typologies of community college dropouts using enrollment patterns: college trials (dropouts after one semester of trials), high credit attempting medium dropouts, low credit attempting medium dropouts, and late dropouts. Matching students who complete to students who dropout with similar enrollment patterns, I identify different sets of variables that are important to predicting completion. Specifically, using gradient boosting algorithm, I find third-year enrollment variables (i.e., credits withdrawn, full-time status, and remedial credits attempted) largely contribute to predictions of completion among late dropouts. On the contrary, math and science credits earned in the first and second year are most predictive of completion among high credit attempted medium dropouts.
Chapter three, co-authored paper with Judith Scott-Clayton, examines the effects of receiving modest Pell Grant ($500) aid on financial aid packages, labor supply while in school, and academic outcomes for community college students. The federal Pell grant program is the nation’s largest source of grant aid for students from lower income families. We compare community college students just above and below the expected family contribution (EFC) cutoff for receiving a Pell Grant and find that other financial aid adjusts in ways that vary by institution: students at schools that offer federal loans borrowed more if they just missed the Pell eligibility threshold, but at other schools, students who just missed the cutoff for Pell were compensated with higher state grants. Focusing on the loan-offering
schools where students face a discontinuity in total grant aid, we find suggestive evidence that receiving a modest Pell Grant instead of additional loans leads students to reduce labor supply and increase enrollment intensity. We also provide indirect evidence that students’ initial enrollment choices are influenced by an offer of Pell Grants versus loans.
To summarize, together these three chapters provide empirical evidence for legal and institutional policies that can help reduce barriers in educational attainment and employment for marginalized populations. The findings of my dissertation recommend that (i) states and institutions collaboratively build an information sharing system between the justice and school systems to better aid students for successful re-entry, (ii) institutions create standard practices in identifying at-risk dropout types and employ specific interventions for completion, and (iii) institutions promote need-based grant aid over additional loans.
Chapter 1
The Effects of Revisions to Juvenile
Record Laws on Education Outcomes
and Employment after the Second
Chance Act of 2007
I
Introduction
On April 9, 2008, the Second Chance Act of 2007 (H.R. 1593) was signed into law under the title “to reauthorize the grant program for reentry of offenders into the Omnibus Crime Control and Safe Streets Act of 1968, to improve reentry planning and implementation, and for other purposes.” The Second Chance Act authorized up to $165 million in federal grants to state and local government agencies under the stated goal of reducing recidivism, increasing public safety, and promoting successful re-integration (The Council of State Government Justice Center, 2018). Since then, the majority of states have made significant changes to their criminal laws, including those related to juvenile justice.
During the years between 2008 and 2015, 39 states made revisions to their juvenile records legislation.1 These revisions include strengthening protections of juvenile records from the
public, expanding eligibility and modifying procedures needed for sealing and expungement, expanding interagency2 information sharing, and expanding information sharing to schools.3 Protecting juvenile records from being accessed by the general public is one way to mitigate unnecessary collateral damage a juvenile might face after being released and transitioning to adulthood. Similarly, sealing and expungement procedures offer another layer of protection by sealing or erasing one’s youthful criminal history from the public (Shah, Fine, & Gullen, 2014). On the other hand, information sharing between agencies that serve and arrest juvenile offenders has been promoted as means to identify at-risk students, provide early
1 Author’s calculation using the National Conference of State Legislature’s Juvenile
Jus-tice Bills Tracking Database, available at http://www.ncsl.org/research/civil-and-criminal-justice/
ncsls-juvenile-justice-bill-tracking-database.aspx. The sample included 51 states, including the District of Columbia.
2 Interagency refers to any individual or institution that can provide information in the juvenile justice
process. For example, interagency information sharing includes interactions between social workers and probation officers, law enforcement and the Bureau of Immigration and Customs Enforcement, and Juvenile and Domestic Relations District Court Records and the Department of Motor Vehicles.
3During the time period of this study, six states (Arizona, Florida, Louisiana, Minnesota, New Hampshire,
and Virginia) allowed law enforcement to collect personal information such as photographs and fingerprints. The majority of these laws were enacted in 2008. As there is no obvious mechanism between these laws and
supervision and treatment, avoid juvenile court involvement, and make informed decisions with more information (Griffin, 2000; Teske, 2011; Wachter, 2017).
A large body of research demonstrates that having a juvenile record and sharing that information can have negative consequences on high school graduation, college enrollment, and employment. For an example, conviction (incarceration) while in high school can double (quadruple) the odds of dropping out from high school (Aizer & Doyle Jr, 2015; Hjalmarsson, 2008; Sweeten, 2006). College and financial aid applications that ask about the applicant’s criminal history can limit college access for those with a criminal record (Lovenheim & Owens, 2014; Pierce, Runyan, & Bangdiwala, 2014; Stewart & Uggen, 2018). And a handful of research finds that juvenile offenders have high unemployment rates, short job tenures, and low wages after confinement and incarceration (Beckett & Western, 2001; Gottfredson & Barton, 1993; Nagin & Waldfogel, 1995; Tanner, Davies, & O’Grady, 1999).
Prior research indicates that both labeling effects and behavioral effects are the under-lying mechanisms behind these negative consequences. High school students with juvenile records are often stigmatized and re-classified as special education students, segregated into specialized programs, or referred to alternative schools under exclusionary polices (Aizer & Doyle Jr, 2015; Kirk & Sampson, 2013). At the college level, one study found that applica-tions with felony convicapplica-tions had a 12 percentage point higher rejection rate than matched pair applications without felony convictions at four-year colleges (Stewart & Uggen, 2018). Another study found that when the Free Application for Federal Student Aid (FAFSA) introduced a question about drug convictions in 2001, immediate college enrollments with drug convictions fell by 12 to 22 percentage points for high school graduates (Lovenheim & Owens, 2014). However, another strand of research finds stronger evidence for behav-ioral effects being a major barrier to progress in schooling and employment. For example, one study found that students with a felony conviction were more likely (62 percent) to leave college applications unfinished when asked about their criminal history compared with those without a conviction (21 percent) (Rosenthal, NaPier, Warth, & Weissman, 2015).
Another study finds that among first-time convicted young adults, incarceration reduced employment mainly through labor non-participation rather than through unemployment (5– 12 percentage points of a total 9–15 percentage point decrease in employment was due to labor non-participation) (Apel & Sweeten, 2010).
In contrast, we know much less about how information sharing can affect education and employment outcomes in the context of juvenile offenses. Economic theory of information sharing indicates that information sharing from the justice system to schools can benefit by allowing schools to make better informed decisions and more efficiently allocate resources (e.g., school counselors, parent/guardian, parole/probation officer, and/or assigned school mentors) to those who need it the most (Bennett, 2010). There has long been a positive view of information sharing, when the federal government included building infrastructure for information sharing as one program of the Juvenile Accountability Incentive Block Grant (JAIGB) Act in 1997, a $250 million federal block grant to local governments. Information sharing started to receive more attention when the Second Chance Act included improving information sharing capabilities as one of its goals. In addition, at the K-12 level, multi-agency information sharing is viewed as an alternative strategy to a zero tolerance policy to promote campus safety, as zero tolerance policies increase referral and suspension rates (Marsh, 2014). Under the premise that information sharing will allow schools to improve their capacity to identify at-risk students at a early period, schools can provide early support and prevent at-risk students from engaging in serious criminal activities. As the literature has increasingly reflected evidence of the negative consequences of a zero tolerance policy, Teske recommended using a multi-disciplinary integrated system as an alternative to zero tolerance policy and demonstrated a 67.4% reduction in school referrals, a 20% increase in graduation rates, and a 51% reduction in felony rates (Teske, 2011; Teske, Huff, & Graves, 2013).
There is far less, if any, empirical research that provides causal estimates of information sharing in the juvenile justice context. A few early studies questioned the existence of
negative labeling effect among juveniles after being arrested. For an example, one study found that boys did not experience any change in their relationship with family or teachers after being in contact with law enforcement agencies. Two recent studies report that arrest is so common that students find little to no stigmatizing effects from family, teachers, or friends (Adams, Robertson, Gray-Ray, & Ray, 2003; Hirschfield, 2008). Alternatively, a handful of re-entry literature finds some evidence of better allocating in-need support (e.g., health services) to juveniles whose information is shared between the justice system and health services (Bai, Wells, & Hillemeier,2009; Chuang & Wells, 2010). There are a few descriptive studies that identified a lack of collaboration, communication, and data sharing capabilities between schools and juvenile justice agencies as a major barrier to successful re-entry into schools (Feierman, Levick, & Mody, 2009; Leone & Weinberg, 2010; Richardson, DiPaola, & Gable, 2012; Seigle, Walsh, & Weber, 2014; Wojcik, Schmetterer, & Naar, 2008). It is less obvious how policies can play an adequate role to reduce the barriers and pro-mote reintegration for ex-offenders, in the aggregate. Past efforts have focused primarily on restricting access to criminal information; however, simply restricting access has had unin-tended social consequences. Litwok (2014)’s dissertation compared states that allowed auto-matic expungement with states that accept petitions for expungement and found that those who had been through the juvenile justice system and were living in states with automatic expungement had higher college attendance and graduation rates as well as higher aver-age earnings. However, “ban-the-box” policies, which prevent job applications from asking about prior criminal involvement, caused an unintended increase in statistical discrimination against young, low-skilled black man by 3.4 percentage points (Doleac & Hansen, 2017).
In this paper, I implement a difference-in-differences design that examines the impact of the availability of juvenile records on educational attainment and employment through revi-sions in record laws since the Second Chance Act (2007). The period of this study is between 2008 and 2015; during this period, the public shifted away from a tough-on-crime position and focused on rehabilitating youth who were in contact with the justice system. This is
referred to as the “Fourth Wave reform to juvenile justice.” I focus on revisions to records legislation and code them into four categories: laws that (1) expand information shared with youth-serving systems (e.g., schools), (2) expand interagency information sharing, (3) limit public access, and (4) expand sealing and expungement eligibility.
As a preview of the results, using October Current Population Survey (CPS) data among ages 18 to 24, I find that states that expanded information sharing to schools has an av-erage increase of 1.1 to 2.5 percentage points in their high school graduation rates and an increase of 2.0 to 3.5 percent points on the likelihood of ever attending college. In addition, I find suggestive evidence that states that expanded eligibility for sealing and expungement experienced an increase employment; however, this finding is not significant across specifica-tions. Similarly, I find suggestive evidence for the negative effects of interagency information sharing (excluding schools) on ever attending college; however, this is not significant across specifications. In contrast, I find no robust impact on educational attainment and employ-ment from states that enacted laws limiting public access to juvenile records.
This paper contributes to the literature in two ways. First, this paper is unique that it explores policy changes regarding the availability of juvenile records and how such changes affect education and employment outcomes in the aggregate.4 Furthermore, this paper brings
in new aspect on the benefits of some information sharing, an area that is very understudied. By examining both information sharing and protecting aspects of record policy, the findings of this study can provide clear guidance to practitioners and policy makers in identifying
4 Much prior work has focused on identifying the negative consequences and underlying mechanisms
between involvement in the justice system and educational attainment or employment rates. For example, a handful of studies convincingly demonstrated the negative consequences of having a criminal record on one’s education and employment prospects. Arrest while in high school, adjudication, and confinement can increase the odds of dropping out of high school (Aizer & Doyle Jr, 2015; Hjalmarsson, 2008; Kirk & Sampson, 2013; Sweeten, 2006). Having a felony conviction increases one’s probability of receiving a rejection from a college application by 12–13 percentage points (Stewart & Uggen, 2018), and 62% of individuals with prior felony conviction failed to complete the application process (Rosenthal et al., 2015). Introducing a question about drug convictions on the FAFSA in 2001 decreased college enrollment by 12–22 percentage points for high school graduates with drug convictions (Lovenheim & Owens, 2014). Other claims regarding collateral consequences included limited housing opportunities, driving privileges, and social welfare (Shah & Strout, 2016).
areas where information sharing or protecting can be beneficial or harmful.
The remainder of the paper proceeds as follows: Section 2 provides background on juvenile records legislation. Section 3 describes data and sample for the analysis and section 4 describes the differences strategy. Section 6 presents the basic difference-in-differences results and section 7 presents the heterogeneous treatment effects. Section 8 provides sensitivity checks. Lastly, section 9 discusses policy implications and remaining questions.
II
Juvenile Record Laws
A
Background
In 2016, more than 850,000 people under age of 18 were arrested (8% of total arrests). Among juvenile arrests, 7% were arrested for offenses on the violent crime index, 21% for property crime, and 11.5% for drug abuse. The demographic characteristics for juvenile arrests (under age of 18) are predominately male (71%), late teens (78% are older than the age of 15), and white (62%) (Puzzanchera & Kang, 2017). Although national crime statistics for any given year are available, what is less clear is the population size of a cumulative arrest, which is the population affected by changes in records legislation. One recent study using the National Longitudinal Study of Youth 1997 estimates about 15.9–26.8% of youth have ever been arrested by age 18 and 25.3–41.4% by age 23 (Brame, Turner, Paternoster, & Bushway, 2012). A follow-up study finds that males are two times more likely than females and blacks are slightly more likely (30%) than whites (22%) to have ever been arrested by age 18 (Brame, Bushway, Paternoster, & Turner, 2014).
The US juvenile justice system was initially established to distinguish youth from adults and to focus on rehabilitation and child welfare (Sickmund & Puzzanchera, 2014). Conse-quently, the juvenile justice system was very different from the criminal justice system in handling cases and court hearings informally and keeping records confidential unless, for
the purpose to help rehabilitation (Juvenile Law Center, 2014). However, during the 1980s and 1990s when serious juvenile crime rate reached a peak in 1994 (see Figure 1.1), public sentiment began to favor a stricter justice system. This led to significant changes in state legislation on juvenile crime. These changes include transferring provisions from the juvenile to the criminal justice system, expanding sentencing options, and modifying the confiden-tiality of juvenile records and proceedings. Between 1992 and 1997, 45 states made changes in transfer provisions, 31 states in sentencing authority, and 47 states in confidentiality laws (Sickmund & Puzzanchera, 2014). Related to record laws, the changes allowed more excep-tions to record confidentiality (sealing, expungement, or deletion), expansion in the ability to collect personal information such as DNA or fingerprints, and more information sharing between justice agencies and youth-serving systems (Sickmund & Puzzanchera, 2014; Tor-bet, Gable, Montgomery, & Hurst, 1996; Willison, Mears, Shollenberger, Owens, & Butts, 2010). Ever since, the confidentiality level of juvenile records has varied across states. For an example, in 2009, 31 states had exceptions for sealing or expungement in subsequent offenses, 41 states had no age restrictions for taking fingerprints of an offender, and 46 states had school notification laws (Sickmund & Puzzanchera, 2014).
In contrast to the 1990s, the past fifteen years have been the lowest era for juvenile crimes. Juvenile arrest and confinement rates have continue to drop reaching the lowest since the 1980s. In 2016, about 850,000 youths under age 18 were arrested, which is about half of what it was in 1997 (OJJDP Statistical Briefing Book, 2018). Similarly, confinement rates in juvenile detention and correctional facilities fell by about half in the corresponding years with less than 50,000 youth arrests in 2015 (OJJDP Statistical Briefing Book, 2018).5
The decline in juvenile arrests outweighed that of adults in nearly all offenses (Sickmund & Puzzanchera, 2014). As the juvenile crime rate has trended down and with Congress passing
5In 2010, the violent crime arrest rate reached the lowest level since the 1980s, with a decline to less than
250 arrests of juveniles under age of 18 per 100,0000 juveniles between ages of 10 and 17 (this is 55% fewer arrests than during the peak at 1994). Juvenile arrests are about 10% of all arrests and 20% of all property crime index offenses, liquor law violations, and disorderly conduct.
the Second Chance Act, most states have once again shifted their focus to rehabilitation in the juvenile justice system. Between 2008 and 2015, 39 state legislatures enacted statutes that revised legislation related to juvenile records, which is the main focus of this paper.
B
Mechanisms of Availability of Juvenile Record to Education
and Labor Market
It is quite common for schools and employers to have access to juvenile criminal records in a slightly different way. At high schools, the most common mechanism is through di-rect conversation with either local law enforcement agencies or from the court under school notification law. Additionally, it is quite frequent to have offense take place in schools.
School notification laws are quite common across the United States. In 2008, 46 states had some form of school notification laws (Sickmund & Puzzanchera, 2014), though there is less guidance on protection and access policies on these information (Shah et al., 2014). In contrast, the most common way for colleges to find out about a student’s criminal history is through a question on the college application that asks applicants to identify their previous criminal history (Shah & Strout, 2016). One national survey found that 60–80% of private colleges and 55% of public colleges include a question about the applicant’s criminal history in their undergraduate applications (The Center for Community Change & National Em-ployment Law Project, 2014; Pierce et al., 2014; Stewart, 2015). For employers, the most common mechanism is to ask consumer reporting agencies. Consumer Reporting Agencies (CRAs) have a large dataset gathered from internet searches, court storage centers, or pur-chased from subcontractors who gather arrest and conviction data from various resources (e.g., state systems or issue reports).6
Prior studies have identified two theoretical frameworks for understanding the negative consequences of a criminal record on educational attainment or employment: the stigma
6 There are some accuracy concerns about these data and how frequently they are updated regarding
hypothesis and the behavioral hypothesis. The stigma hypothesis follows the labeling theory where institutions, teachers, peers, college administrators, or employers change their way of thinking about a student/applicant when they learn about the person’s prior criminal involvement (Aizer & Doyle Jr, 2015; Kirk & Sampson, 2013; Lemert, 1951).. The behavioral hypothesis suggests that their experiences in the justice system can have a negative impact on youth’s behavior or skills such as, lowering self-esteem, creating detachment to schools, or have less accumulation of human capital (Lambie & Randell, 2013; Nye, Short Jr, & Olson, 1958; Stewart & Uggen, 2018).
Alternatively, a far less studied mechanism is where information sharing can benefit in allocating the resources to the population who needs it most (Bennett, 2010). That is, information shared about a youth can help society efficiently allocate scarce resources (e.g., school counselors, parent advocate, parole/probation officer, and/or assigned school mentors) to those students who need it the most.
This paper explores state changes in juvenile record policy that alters these underlying mechanisms.
C
Four Categories of Juvenile Record Laws
A juvenile record can refer one of two types of records: a law enforcement record or a court record. The law enforcement record is created at the time of arrest and includes detailed information about the arrest, police reports, detention and charging documents, witness and victim statements, and if applicable, photographs, fingerprints, and DNA samples. These records are primarily stored in the law enforcement agency’s record system (Shah & Strout, 2016). Second, the court record is created after law enforcement agencies decide to send an arrest to the juvenile system.7 These court records include information such as fam-ily background, behavioral and health history, education, and prior interactions with law enforcement.
Between 2008 and 2015, 39 state legislatures enacted statutes revising laws related to juvenile records. I divide these laws into four categories:8
• Type 1: Expand information sharing to youth-serving systems - 11 states
• Type 2: Expand interagency information sharing (excluding youthserving systems) -16 states
• Type 3: Restrict public access to juvenile records - 9 states
• Type 4: Expand eligibility and modify procedures for sealing and expungement9 - 23
states
Figures 1.2–1.5 show the years that states enacted a revision law, separately by category. The control states are those that did not make any changes to their juvenile record record laws during the time period of this study, 2008 to 2015. There are 12 control states in this study: Arizona, Arkansas, Georgia, Idaho, Massachusetts, Michigan, Missouri, Montana, New Jersey, New Mexico, Rhode Island, and Vermont. These four types of record laws are indicated separately into my difference-in-differences estimate to estimate individual impacts on education and employment outcomes.
8 This categorization is adapted and modified from (Willison et al., 2010). Willison et al. (2010) makes
four categorizations: information sharing with youth serving systems, interagency information sharing, lim-iting public access, and data collection on personal information (e.g. DNA, fingerprints, photographs, etc). As mentioned before, I exclude the fourth category and consider laws related to sealing and expungement instead.
9 Juvenile records are generally confidential. The termconfidentiality means protected during or right
after juvenile proceedings. States have varying specifics of which records is confidential and not. For an example, these vary in who has access, what information is accessible, and what type of offense. Also, most states have exceptions to confidentiality by offense type, offender age, and repeatability of crime. Law enforcement and court personnel are generally exceptions from confidentiality. In formal definition, confidentiality refers to “preventing access to, dissemination or use of juvenile record outside of juvenile court unless it is intended for youth’s case planning (Shah et al., 2014).” Confidentiality is different from sealing in that sealing refers to protecting records after the case is closed. Although some states uses the term sealing and expungement interchangeably, the two terms differ by whether it is access closure or physical destruction of the record. In formal definition, sealing refers to “a record that is unavailable to the public, but accessible to select individuals or agencies” and expungement refers to “actual physical destruction and erasure of juvenile record (Shah et al., 2014).” In this paper, I use sealing and expungement terminology interchangeably. Similar to confidentiality, sealing and expungement laws can vary in many dimensions across states. States can choose which record is eligible (law enforcement and/or court), which procedure is needed
III
Data and Sample
The main dataset used in this study is the Current Population Survey (CPS) for October. CPS data are collected monthly with a particular focus on labor force statistics. I selected the October CPS in order to align with the academic year (starting in the fall and ending in the spring), as two of the outcomes of interest are education outcomes. In addition, the October CPS has a supplemental survey that allows me to separate out those who received GEDs from those who received high school diplomas. However, using CPS data for my main analysis has several limitations. One limitation is the sample coverage; CPS only collects data from non-institutionalized individuals. Since I am interested in youth in contact with the juvenile justice system, it would have been helpful to have the same information for institutionalized individuals as well. This raises the question of how much of the sample is missing as a result of this restriction. Fortunately, unlike the adult criminal system, the juvenile justice system typically has relatively short stay in juvenile residential placement facilities. The median stay among committed juvenile offenders ranges between 103 to 113 days. Less than 11% of committed and 2% of detained offenders remain in residential placement more than a year since admission (OJJDP Statistics Briefing Book).10 The short length of stay results in
only a small fraction of the sample missing from the data for any given year. Between 2003 and 2015, only 0.152 – 0.303 percent of the juvenile population aged 10 to the upper age of juvenile court jurisdiction were in residential placement (Sickmund, et al., 2017). The second limitation of using CPS is that it does not have a questionnaire asking about cumulative arrest. Exclusion of prior criminal involvement limits my analysis to only able to estimate a general effect of changes to record laws on the entire non-institutionalized population. In other words, I am not able to disentangle the direct effect on ex-offenders with a juvenile record from spill-over effects on non-offenders. In addition, without knowledge on how
10 Data is retrieved from OJJDP Statistical Briefing Book. Online.
https://www.ojjdp.gov/ojstatbb/ corrections/qa08401.asp?qaDate=2015. Released on June 01, 2017.
large the affected population is by these law changes can raise concern on sample coverage. Fortunately, since a juvenile record is created as early as at the time of arrest and the policy change can affect anyone even with one arrest, coverage from the non-institutionalized sample should provide reasonable sample coverage. Using National Longitudinal Survey of Youth 97, Brame, et al. (2012) calculates approximately 15.9 - 26.8% of the national representative sample had more than one cumulative arrest by age of 18.
In order to gather record laws that were enacted during 2008–2015, I use the National Conference of State Legislatures (NCSL) juvenile justice bills tracking database. This database gathers all introduced or enacted juvenile justice statutes starting from 2008 to the current date. From this database, I extracted only enacted legislation between 2008 to 2015 that fell under the category of ”Records and Information.”
Additional state-specific time varying variables are gathered from different sources. The Bureau of Labor Statistics provides monthly, seasonally-adjusted unemployment rates for each state. I take the average unemployment rate from the previous October to September to align with CPS October calendar years. In addition, annual state specific juvenile arrest rates including the violent crime index, the property crime index, and drug abuse is collected from the Office of Juvenile Justice and Delinquency Prevention Statistical Briefing Book, which are calculated using the FBI’s Uniform Crime Reporting (UCR) data.11 Lastly, log
juvenile population by state and year is gathered from the Easy Access to Juvenile Population database from the Office of Juvenile Justice and Delinquency Prevention.
I restrict the sample to ages 18–24, which is the population most likely to be affected by these legislative changes. Table 1.1 provides the descriptive characteristics of the sample using CPS data for October during pre-treatment periods between 2004 and 2007. Columns 2 through 12 group individuals who lives in treated states by type of legislation. For each category, three columns show sample mean, standard deviation, and p-values from a
t-11 The annual juvenile arrest rate is calculated using the number of arrests for a particular offense among
test comparing average differences between control group (columns 13–14). The legislation categories are listed left to right from type 1 to type 4, as listed above. The two rightmost columns present the mean and standard deviation for individuals in the control states.
In terms of outcomes, Table 1.1 shows that there is no significant difference in outcome averages between the treated states and the control group. In contrast, the next rows pre-senting individual demographic data demonstrate a few noticeable demographic differences between treated states and control states. In particular, treated states are generally less white (except for states that limit public access to juvenile records), less black, have larger populations of other races, and are more metropolitan (except Type 3 states). Also, treated states generally have higher juvenile crime rates, lower unemployment rates, and a high ju-venile population. Particularly, states that reformed information sharing with schools stands out with higher juvenile arrest rates than the control group.12The bottom panel of Table 1.1
shows that treated states and control states are spread out across regions throughout the country.
IV
Empirical Methodology
The main design of the study is a difference-in-differences (DD) strategy, where the model compares trends in outcomes with control states before and after juvenile record reforms. The simplest form of DD specification is:
yist =β1T reatP ostst−1 +γs+δt+Xist+Xst+εist (1.1)
where, yist is an outcome variable for personi, in state s, during year t. Outcome variables are whether or not one has received a high school diploma (excluding those with GEDs),
12 Similarly, I find higher rate of juveniles placed in residential facility for states that revised laws on
information sharing with schools. On average, 331 out of 100,000 juvenile population were in residential facilities between years 2003 and 2007 (Sickmund, et al., 2017). On the contrary, 226 out of 100,000 juvenile
ever attended college, and employment status. T reatP ostst−1 is an indicator with value 1 for
treated states in post-treatment years. I have a lag of one year to capture the gap between enactment and implementation of the laws.13 The coefficient of interest isβ
1, an estimate of
pre-post change in outcomes among individuals in states that revised a law type compared with those in control states. γs is a state fixed effect and δt is a year fixed effect. Xist are individual controls and include indicators for living in a metropolitan area, gender, age, race, and marital status. Xst are state-specific time-varying controls such as the unemployment rate, annual juvenile arrest rates (violent crime index, property crime index, drug abuse violations), and the log of the juvenile population (age< 18).
I enrich this basic model by first adding a state linear time trend to allow for differential cross-state trends and second by adding an interaction of regional dummies and year dummies to control for regional common shocks. I cluster standard error by state to address serial correlation (Bertrand, Duflo, & Mullainathan, 2004). Lastly, in order to allow for at least one year of pre-treatment period for laws enacted in 2009, I examine outcomes from 2008 to 2016.
A
Defining Treatment Dummies
Using the NCSL Juvenile Justice Bills Tracking database, a total of 165 records and infor-mation laws were enacted between 2008 and 2015. Eleven laws (from six states) related to allowing the collection of personal data (e.g., fingerprints or photographs) were excluded from the analysis. The remaining 154 laws were assigned year t if the enacted date lies between October of yeart−1 and September of year t. For each law typej,treatedstatesj is defined as those states that ever enacted a type j law during the study period. controlstaterefers to states that did not experience any amendment activity during the study time period. This study uses a total of 12 states as control states: Arizona, Arkansas, Georgia, Idaho,
13 the enacted law yeart was calculated using both the year and month of the enactment date. That is,
to align with the data cycle of October, I assign laws that were enacted between the previous October to this year September as belonging to the current year.
Massachusetts, Michigan, Missouri, Montana, New Jersey, New Mexico, Rhode Island, and Vermont. The T reatP ost variable is coded as 0 prior to enactment and 1 after enactment only among treated states.14 Within each law type, the majority of laws were enacted in
a monotone direction.15 However, if an enacted law is in the opposite direction to existing
law, then that state will have a missing value for T reatP ostfor all subsequent years.16
Figures 1.6–1.9 graphT reatP ostvalues by year (one-year lag) along the x-axis, separately by legislation type. Missing values indicate the year a contrasting law was enacted. For type 1 laws (Figure 1.6), there are no missing values, indicating that all enacted laws had a monotone direction. For type 2 laws (Figure 1.7), Maryland has missing values starting from 2014, meaning that a law was enacted in the opposite direction in 2013. Overall, Figure 1.8 confirms that the majority of laws were enacted in a monotone direction. In addition, Figure 1.9 shows that majority of revisions to records legislation occurred prior to 2013.
V
Results
A
Basic Difference-in-Differences Results
Table 1.2 provides results from the difference-in-differences regressions. Columns 1 to 5 contain the estimated impact of each law type on the likelihood of earning a high school diploma (excluding GED earners), columns 6 to 10 on the likelihood of ever attending college, and columns 11 to 15 on employment. For each outcome, the first column presents a simple regression coefficient with state and fixed effects, the second column adds individual controls, and the third column adds state-specific controls and are estimated using equation (1.1). The
14 Because I add a one year lag, theT reatP ost
st−1indicate as 1 one year after the enactment year.
15Here, direction is defined as protection versus sharing. For example, for type 1 laws (information sharing
with schools), laws that limit sharing with schools are regarded as being in the opposite direction of laws that expand sharing with schools.
16 In cases where a state had multiple amendments within the same year t that were all in the same
fourth column adds linear state trend and the fifth column adds region × year dummies in addition to equation (1.1).
States that revised laws on information sharing with schools have, on average, a 1.7 to 2.5 percentage point higher high-school graduation rate (this is about a 2.0 to 3.1 percent increase from the baseline of 80.5%) than the control states. Similarly, these states also have 2.0 to 3.5 percentage point higher rates on ever attending college (about a 4 to 7 percent increase from a baseline of 50%) than control states. The coefficients are significant and robust across all specifications. If approximately 16–27% of the general population had at least one cumulative arrest (Brame, et al., 2012) and if the information sharing with schools only effected directly on the population with a juvenile record, I would expect the treatment effect size to be larger (about four to six times larger) in magnitude to those with a juvenile record. On the other hand, Teske (2011) finds some evidence of positive spill-over effects from multi-integrated systems through reduction in the number of students who are detained on school offenses by 86%, reduction on school offense referral to the court by 43%, and reduction in the number of serious weapons on campus by 73%. This suggests that it is possible that information sharing with schools may have non-direct positive effects on non-offenders through the mechanism of increasing safety of schools.
I find a suggestive increase in employment by 0.9 to 2 percentage points (about 1.4 to 3.2 percent increase from a baseline of 80.5%) for states that expanded sealing and expungement eligibility compared with no-change states. The coefficients are positive across all specifi-cations; however, two specification are not significant. Including state-specific or regional trends reduced the magnitude of the coefficients on employment, suggesting that treated states were already experiencing an upward trend in employment rates. In contrast, I do not find any robust effects for states that revised laws regarding interagency information sharing or public access to records.
Including linear state trends or region interacted year dummies generally doesn’t change the direction of coefficients. However, the coefficients on ever attended college becomes
slightly larger and less stable after including both specification. To take the conservative estimate, I choose the simpler model, as specified in Equation (1.1), with state and year fixed effects, individual controls, and time-varying state controls as preferred model for my sub sequent analyses.
B
Effects of all four laws simultaneously
Given that a mixture of law types were enacted during the study period, it may be worth exploring the joint effect of the four laws. In order to do so, I fit the following equation:
yist=
X
j∈lawtypes
βj(T reat×P ostLawtypej)st−1+γs+δt+Xist+Xst+εist (1.2)
Furthermore, it may be worth exploring whether it is necessary to separate the data according to type of legislation. To examine this issue, I create an indicatoranylawst−1 that has a value
of 1 for periods subsequent to when any of the four type laws were enacted and 0 otherwise.17
This anylawst−1 is replaced fromT reatP ostst indicator from equation (1.1) above.
Table 1.3 presents regression coefficients from equation (1.2). The first four columns estimate the joint impact of the four laws or any law indicator on the likelihood of receiving a high school diploma (excluding GED), columns 5 to 8 on the likelihood of ever attending college, and columns 9 to 12 on employment. The first column of each outcome is the regression coefficient of equation (1.2), the second column adds a linear state trend, and the third column adds region × year dummies. The fourth column indicates the regression coefficient when replacing equation (1.1) with any law indicator, which equals 1 after any juvenile record law revisions were made in a given state and year and 0 otherwise.
The significant and robust positive coefficients of information sharing with schools on high school graduation rates and ever attending college is consistent with the findings in the previous section. The estimation magnitudes in columns 1 to 3, between 1.1 to 1.4 percentage
points, are slightly smaller than the separate estimations shown in Table 1.2, which indicates that separating out one type of legislation partially captures effects from other the types of legislative changes. However, no coefficients from other laws are significantly affecting high school diploma attainment rates. On the other hand, the estimation magnitudes for columns 5 to 7, between 2.2 to 3.3 percentage points, are very similar to estimations that do not include other record laws. This suggests that the educational benefits of information sharing with schools remains positive regardless of the other types of laws that were enacted in the same year.
I observe three patterns that deserve a mention. First, I find a suggestive negative impact by 0.7 to 2.2 percentage points from states that enacted legislation regarding interagency information sharing on ever attending college, which was not observable in previous sepa-rate estimations. The significance level is not achieved across all three model specifications (columns 5–7); however, the coefficients are consistently in a negative direction. It appears that those states that made revisions to laws regarding interagency information sharing may be correlated with another law with positive impact, which negated the negative effect on ever attending college from Table 1.2. This finding suggests that subsequent analyses should examining the joint effect of any enacted legislation. Second, the suggestive positive coef-ficient of expanded sealing and expungement eligibility laws on employment still holds and still, is marginally significant in only one specification after including other laws. Lastly, columns 4, 8, and 12 indeed suggest that separating out the individual effects of each types of juvenile record laws can provide better interpretations. Unlike the few significant estima-tions from separating into four types of laws, none of the coefficients on any law indicator is significant.
The results in Tables 1.2 and 1.3 suggest that information sharing with schools have robust and significant positive benefits on both attaining a high school diploma and ever attending college. The magnitude of the impact on earning a high school diploma is between 1.1 to 2.4 percentage points (a 1.3 to 2.9 percent increase from a baseline of 80.5%) and
the magnitude impact on ever attending college is between 2.0 to 3.5 percentage points (a 4 to 7 percent increase from a baseline of 50%). In addition, I find a suggestive positive im-pact from legislation that expanded sealing and expungement eligibility upon employment; however, the findings are not robust across specifications. Using joint effect estimation, the coefficients on interagency information sharing suggest a negative impact on ever attend-ing college; however, this is not significant across specifications. In order for difference-in-differences estimations to be valid, a critical assumption is the common trends assumption. The following section provides assumption and sensitivity checks on these basic results.
VI
Sensitivity Checks
A
Pre-trends
Difference-in-differences estimates rely on the common trends assumption. The common trends assumption requires that treated states and control states have comparable trends without treatment. One way to check for parallel trends is to visualize outcome changes by year in the pre-treatment period. Figures 1.10–1.12 show residualized outcome changes between years 2004 to 2016.18 The residualized outcome is estimated using a regression
of state and year fixed effects, individual controls, and state-specific controls on outcomes and plotting the residuals by each year. Year 2008 is excluded as a baseline. The red line divides pre-treatment years and post-treatment years. Because my treatment is multi-year law changes starting from 2008 to 2016, I am only able to plot the first year of the treatment period. In order for the common trends assumption to hold, treated and control states should have roughly similar trends prior to the first year of treatment, between 2004 and 2008. Note that the common trends assumption is valid even the lines are at different levels, as long as the pre-treatment slope changes are roughly the same. Reassuringly, Figure 1.10 indicates
that the common treatment assumption holds; treated and control states appear to have roughly similar pre-treatment trends. In addition, for significant regression estimators, one may be able to detect trend differences between treated states versus control states during the post-treatment period. Figures 1.10 and 1.11, which indicate the post-treatment trends for high school graduation rates and ever attending college, show visible differences in trends for control states from trends from states that made revisions on information sharing with schools.
B
Lags and Leads
An alternative way to check for the common trends assumption is to pool all years of data and augment the data with beads of treatment indicator. If coefficients on leads have a non-zero coefficient, the previous main results may be obscured from a reverse causality interpretation. In addition, adding lags of treatment indicator would provide the dynamics of treatment effects. To explore common trends assumption and the dynamics of treatment effect, I regress my outcomes with three years of leads and two year of lags as below:
Yist=
q
X
τ=−m
βj(DLawtypej)st−1+τ +γs+δt+Xist+Xst+εist (1.3)
where,DLawtypet refers to indicators for 1–3 years before the enacted legislation, 1 year after
the enacted legislation, and 2 years or more years since the enacted legislation. I include leads and lags for all four law types simultaneously, because there was correlation among states that implement more than one type of record law as seen from the previous result. Because I have states that enacted the same type of record laws multiple times between years 2008 to 2016, I use all years between the earliest and latest legislation as the years of enactment. For example, if state s enacted legislation expanding information sharing with schools in both 2009 and 2012, the indicator for τ =−1 will have be 1 in 2008 for states, 1 for τ = 0 in all years between 2009 and 2012, and one for τ = 1 in 2013.
If the common trends assumption holds, the coefficients on the leads should be no different from zero. The beta estimations on the lags will identify the dynamic nature of the treatment spell. Figures 1.13 and 1.14 present coefficient plots for βj for information sharing with schools on high school graduation and ever attending college, respectively. Figure 1.13 confirms that there is no evidence for reverse causality and that the positive impact appears immediate after one year of enactment. However, from Figure 1.14, I find negative coefficients for indicators 3 years prior to enacting legislation expanding information sharing with schools on ever attending college. That said, it is quite hard to make reverse causality interpretation; states made revisions to information sharing with schools laws as a result of low rates of ever attending college. Figure 1.14 may indicate instead that my common trends assumption only holds within a relatively short pre-treatment period.
C
Aggregation Results
So far, my regression estimates use individual level data. An alternative model specification is to aggregate individuals up to the state level and explore aggregated estimations on the effect of juvenile record law revisions. The coefficients on state-level aggregate difference-in-differences regressions should have similar point estimates with but different standard errors from the main results. In order to align with the models using individual data, outcome variables are residualized on individual covariates prior to aggregation in order to control for individual differences. The state-level aggregated regression is modeled as follows:
f
yst =β1T reatP ostst−1+γs+δt+Xst+εst (1.4)
where yfst is a residualized outcome from regressing individual controls. Table 1.4 presents
the regression results of equation (1.4). Reassuringly, the magnitude of the coefficients across all specifications resembles that of the main results from Table 1.2. This confirms that my aggregated model is equivalent to individual models. Even with state-level aggregated model,
general finding still holds: information sharing with schools on earning a high school diploma and on ever attending college is positive and significant. In addition, I still find significant positive effects (three out of four specifications) from legislation that expanded sealing and expungement eligibility upon employment. Thus the overall findings hold even with using state-level aggregated data.
D
Heterogeneous Treatment Effects
The findings in the previous sections consistently demonstrate the positive impact of ex-panding information sharing with schools on educational outcomes. However, the underlying mechanism of how information sharing with schools benefits educational attainment is not as clear. Prior research has suggested that in sharing information on students’ involvement with the juvenile justice system, schools are able to identify at-risk students and allocate resources to taking preventative measures. This creates a more stable educational environ-ment. To explore this hypothesis, I run a subgroup analysis on various demographic and regional characteristics using equation (1.2). As changes in juvenile record legislation only directly impact those who have ever been arrested, I would expect these legislative changes to have the largest effect on the subgroup that most closely resembles juvenile offender characteristics.
Table 1.5 presents regression coefficients on various subgroups. The coefficients only show impact estimations from the states that made revisions on information sharing with schools, although the actual regression includes all four types of record legislation simultaneously. Columns 1–3 show difference-in-differences estimations on earning a high school diploma (excluding GED earners), columns 4–6 on ever attending college, and columns 7–9 on em-ployment, respectively. Column 1 reflects regression results from equation (1.2), column 2 adds linear state trends, and column 3 adds region and year dummies from equation (1.2). The table separates the estimates by gender (males or females only), by race (black, white, or other race), by age (traditional college-age, between 18 to 21, and older, between 22 to
24), and by state indexes for drug abuse, violent crime, and property crime.
Across all subgroups, information sharing with schools has positive effects on high school attainment and ever attending college. Given the larger magnitude on ever attending col-lege, I find more coefficients reaching significance levels in columns 4–6. The male population group and black population group have the largest significant effect sizes on both education outcomes, which resembles the demographic characteristics of juvenile offenders. In partic-ular, when looking at the male-only population, I find a 0.5 to 2.1 percentage point increase on high school attainment and a 2.6 to 3.5 percentage point increase on ever attending col-lege, which is slightly larger in magnitude than the general findings from Table 1.2. When I restrict the estimate to the black population, the magnitude becomes even larger, between a 1.9–4.8 percentage point increase on high school attainment and 2.0–5.8 percentage point increase on ever attending college. The positive impacts of sharing information with schools on education attainment and particularly on ever attending college are spread out across gender and race. This suggest that there might be positive spill over effects from increasing campus safety.
In terms of age, I find increased information sharing to have larger effects on the older student population. One possible explanation is that students who have been in contact with the justice system are less likely to graduate high school on time. It is possible that a subgroup of young potential college students may still be in high school and that the benefits might be as readily apparent for the younger population. Alternatively, the benefits may take some time to reflect as an increase in outcome. For an example, additional resources from information sharing with schools (e.g., counselors or mentors) may have behavioral benefits (e.g., less detachment from school or less self-discouragement), which may appear in the later life span.
The last three panels show regression estimates after restricting to states that have high rates of juvenile crime and drug abuse, and high violent crime and property crime indexes. Table 1.5 shows that the benefits of sharing juvenile records with schools are significant in
states with high violent crime and property crime indexes. The heterogeneous treatment effects by offense type reveals that records legislation may have a differential impact by offense type.
VII
Discussion
This paper looks at the impact of revisions to juvenile records legislation on education and employment outcomes after the Second Chance Act of 2007. I identify four types of legis-lation that address juvenile records: (1) expanding information sharing with youth-serving systems (e.g., schools), (2) expanding interagency information sharing, (3) restricting public access, and (4) expanding sealing and expungement eligibility. My difference-in-differences estimates find increases in high school attainment and probability of ever attending college for states that revised their statues to expand information sharing with schools. In particu-lar, I find a 1.1 to 2.4 percentage points increase (1.3 to 2.9 percent increase from a baseline of 80.5%) in high school diploma attainment and a 2.0 to 3.5 percentage points increase (4 to 7 percent increase from baseline of 50%) on the rate of ever attending college. My het-erogeneous estimates indicate that treatment effects are largest among the Black and male sub populations, which aligns with the demographic characteristics of juvenile offenders.
While the effects of juvenile records legislation have not been empirically studied, prior research found similar trends. One case study that implemented a multi-integrated protocol in Clayton County Juvenile experienced a 20% increase in graduation rates (from a baseline of 60%) after implementation. However, this study did not control for any secular trends or confounding factors, which makes it less compelling to compare with my causal estimations. From Litwok (2014)’s paper, the model that is comparable with my analysis is the interaction coefficient of juvenile arrest from living in automatic expungement states compared to non-automatic(application) states, which finds a non-significant 0.3 percentage point decrease on ever attended college and a non-significant 2.9 percentage point increase in log of average
income. Although my suggestive positive outcome is on employment and not average income, Litwok (2014)’s finding of positive labor market outcomes aligns well with my study.
The findings of this paper have several policy implications. First, information sharing between schools and the justice system can help improve educational attainment rates in the aggregate. Information sharing theory sheds some guidance on the possible mechanisms behind this: improved detection of at-risk students and allocation of resources to take preven-tative steps before at-risk students engage in more serious activities. This is consistent with the findings in re-entry literature which shows that collaboration is key to successful re-entry (Leone & Weinb