Global motion compensated visual
attention-based video watermarking
Matthew Oakes
Deepayan Bhowmik
Charith Abhayaratne
Global motion compensated visual attention-based video
watermarking
Matthew Oakes,aDeepayan Bhowmik,b,*and Charith Abhayaratnec
aUniversity of Buckingham, Department of Applied Computing, Buckingham MK18 1EG, United Kingdom bSheffield Hallam University, Department of Computing, Sheffield S1 1WB, United Kingdom.
cUniversity of Sheffield, Department of Electronic and Electrical Engineering, Sheffield S1 3JD, United Kingdom
Abstract. Imperceptibility and robustness are two key but complementary requirements of any watermarking algorithm. Low-strength watermarking yields high imperceptibility but exhibits poor robustness. High-strength watermarking schemes achieve good robustness but often suffer from embedding distortions resulting in poor visual quality in host media. This paper proposes a unique video watermarking algorithm that offers a fine balance between imperceptibility and robustness using motion compensated wavelet-based visual attention model (VAM). The proposed VAM includes spatial cues for visual saliency as well as temporal cues. The spatial modeling uses the spatial wavelet coefficients while the temporal modeling accounts for both local and global motion to arrive at the spatiotemporal VAM for video. The model is then used to develop a video watermarking algorithm, where a two-level watermarking weighting parameter map is generated from the VAM saliency maps using the saliency model and data are embedded into the host image according to the visual attentiveness of each region. By avoiding higher strength watermarking in the visually attentive region, the resulting watermarked video achieves high perceived visual quality while preserving high robustness. The proposed VAM outperforms the state-of-the-art video visual attention methods in joint saliency detection and low computational complexity performance. For the same embedding distortion, the proposed visual attention-based watermarking achieves up to 39% (nonblind) and 22% (blind) improvement in robustness against H.264/AVC compression, compared to existing watermarking methodology that does not use the VAM. The proposed visual attention-based video watermarking results in visual quality similar to that of low-strength watermarking and a robustness similar to those of high-strength watermarking. © The Authors. Published by SPIE under a Creative Commons Attribution 3.0 Unported License. Distribution or reproduction of this work in whole or in part requires full attribution of the original publication, includ-ing its DOI.[DOI:10.1117/1.JEI.25.6.061624]
Keywords: video visual attention model; motion compensation; video watermarking; robustness; subjective visual quality evaluation. Paper 16380SS received May 1, 2016; accepted for publication Nov. 29, 2016; published online Dec. 20, 2016.
1 Introduction
With the recent rapid growth of digital technologies, content protection now plays a major role within content manage-ment systems. Of the current systems, digital watermarking provides a robust and maintainable solution to enhance media security. The visual quality of the host media (often known as imperceptibility) and robustness are widely consid-ered as the two main properties vital for a good digital water-marking system. They are complimentary to each other, hence it is challenging to attain the right balance between them. This paper proposes a new approach to achieve high robustness in watermarking while not affecting the perceived visual quality of the host media by exploiting the concepts of visual attention (VA).
The human visual system (HVS) is sensitive to many fea-tures which lead to attention being drawn toward specific regions in a scene and is a well-studied topic in psychology and biology.1,2 VA is an important and complex biological process that helps to identify potential danger, e.g., prey, predators quickly in a cluttered visual world3 as attention to one target leaves other targets less available.4 Recently, a considerable effort was noticed in the literature in modeling
VA3that has applications in many related domains including media quality evaluation. Areas of visual interest stimulate neural nerve cells, causing the human gaze to fixate toward a particular scene area. The visual attention model (VAM) highlights these visually sensitive regions, which stimulates a neural response within the primary visual cortex.5Whether that neural vitalization be from contrast in intensity, a distinc-tive face, unorthodox motion, or a dominant color, these stimulative regions diverge human attention providing highly useful saliency maps within the media processing domain. Human vision behavioral studies6and feature integration theory1 have prioritized the combination of three visually stimulating low level features: intensity, color, and orienta-tion which comprise the concrete foundaorienta-tions for numerous image domain saliency models.3,7,8 Most saliency models often use multiresolution analysis.9–11 Temporal features must be considered as moving objects and are more eye-catching than most static locations.12 Work has seldom been directed toward video saliency estimation, in compari-son to the image domain counterpart, as temporal feature consideration dramatically increases the overall VA frame-work complexity. Most typical video saliency estimation methodologies3,13–18 exist as a supplementary extension from their image domain algorithms. Research estimating VA within video can also be derived from exploiting spatio-temporal cues,19,20 structural tensors,21and optical flow.22 *Address all correspondence to: Deepayan Bhowmik, E-mail: deepayan.
However, none of these algorithms explicitly captures the spatiotemporal cues that consider object motion between frames as well as the motion caused by camera movements. Motion within a video sequence can come from two catego-ries namely, local motion and global motion. Local motion is the result of object movement within frames, which com-prises all salient temporal data. One major feature associated with local motion is independence, so no single transforma-tion can capture all local movement for the entire frame. Local motion can only be captured from successive frames differences if the camera remains motionless. On the con-trary, global motion describes all motion in a scene based on a single affine transform from the previous frame and usually is a result of camera movement during a scene. The transform consists of three components, i.e., camera pan-ning, tilting, and zooming or in image processing terms translation, rotation, and scaling. Figure1shows three causes for global motion. This paper proposes a new video VAM that accounts for local and global motions using a wave-let-based motion compensated temporal filtering framework. Compensating for any perceived camera movement reduces the overall effect of global movement so salient local object motion can be captured during scenes involving dynamic camera action.
A region of interest (ROI) dictates the most important vis-ible aspects within media, so distortion within these areas will be highly noticeable to any viewer. The VAM computes such regions. This paper proposes a unique video watermark-ing algorithm exploitwatermark-ing the new video VAM. In frequency domain watermarking, the robustness of the watermarking is usually achieved by increasing the embedding strength. However, this results in visual distortions in the host media, thus a low imperceptibility of embedding. In the proposed method in this work, high watermark robustness without compromising the visual quality of the host media is achieved by embedding greater watermark strength within the less visually attentive regions within the media, as iden-tified by the video VAM (in Sec. 2).
Related work includes defining an ROI23–28and increas-ing the watermark strength in the ROI to address croppincreas-ing attacks. However, in these works, the ROI extraction was only based on foreground-background models rather than VAM. There are major drawbacks of such solutions: (a) increasing the watermark strength within eye catching frame regions is perceptually unpleasant as human attention will naturally be drawn toward any additional embedding artifacts, and (b) scenes exhibiting sparse salience will potentially contain extensively fragile or no watermark data. Sur et al.29proposed a pixel domain algorithm to improve embedding distortion using an existing visual saliency
model described in Ref.3. However, the algorithm only dis-cusses its limited observation on perceptual quality without considering any robustness.
Our previous work30,31 shows the exploitation of image saliency in achieving image watermarking robustness. It is infeasible to simply extend the VA-based image domain algorithm into a frame-by-frame video watermarking scheme, as temporal factors must first be considered within the video watermarking framework. A viewer has unlimited time to absorb all information within an image, so potentially could view all conspicuous and visually uninteresting aspects in a scene. However, in a video sequence, the visual cortex has very limited processing time to analyze each individual frame. Human attention will naturally be drawn toward temporally active visually attentive regions. Thus the proposed motion compensated VAM is a suitable choice for VA-based video watermarking. By employing VA concepts within the digital watermarking, an increased overall robustness against adversary attacks can be achieved, while subjectively limiting any perceived visual distortions by the human eye. The concept of VA-based image and video watermarking was first introduced in our early work.30,32 Recent work following this concept can be found in water-marking H.264 video33and application on cryptography.34 On the contrary, in this paper, we propose a video watermark embedding strategy based on VA modeling that uses the same spatiotemporal decomposition used in the video watermarking scheme. In addition, the VAM compensates global motion in order to capture local motion into the saliency model.
Performances of our saliency model and the watermark-ing algorithms are separately evaluated by comparisons with existing schemes. Subjective tests for media quality assess-ment recommended by the International Telecommunication Union (ITU),35largely missing in the watermarking litera-ture, are also conducted to complement the objective mea-surements. Major contributions of this paper are:
• A new motion compensated spatiotemporal video VAM that considers object motion between frames as well as global motions due to camera movement.
• New blind and nonblind video watermarking algo-rithms that are highly imperceptible and robust against compression attacks.
• Subjective tests that evaluate visual quality of the pro-posed watermarking algorithms.
The saliency model and the watermarking algorithms are evaluated using the existing video datasets described in Sec. 4.1. The initial concept of the motion compensated video attention model was reported earlier in the form of Fig. 1 The three causes of global motion: camera panning, tilting, and zooming.
a conference publication36while this paper discusses the pro-posed scheme in detail with an exhaustive evaluation and proposes a case study describing a new video watermarking scheme that uses the attention model.
2 Motion Compensated Video Visual Attention Model
The most attentive regions within media can be captured by exploiting and imposing characteristics from within the HVS. In this section, a method is proposed to detect any saliency information within a video. The proposed methods incorporate motion compensated spatiotemporal wavelet decomposition combined with HVS modeling to capture any saliency information. A unique approach combining salient temporal, intensity, color, and orientation contrasts formulate the essential video saliency methodology.
Physiological and psychophysical evidence demonstrates that visually stimulating regions occur at different scales within media37 and the object motion within the scene.12 Consequently, models proposed in this work exploit the identifiable multiresolution property of the wavelet trans-form that incorporates a motion compensation algorithm to generate the model. By exploiting the multiresolution spatiotemporal representation of the wavelet transform, VA is estimated directly from within the wavelet domain. The video saliency model is divided into three subsections. First, Sec. 2.1 describes the global motion compensation following the description of the spatial saliency model in Secs.2.2and2.3that illustrates the temporal saliency feature map generation. Finally, Sec.2.4combines the spatiotempo-ral model to estimate video visual saliency. An ovespatiotempo-rall functional block diagram of our proposed model is shown in Fig. 2. For the spatial saliency model in this work, we adopted our image VAM proposed in Refs. 30and31.
2.1 Global Motion Compensated Frame Difference
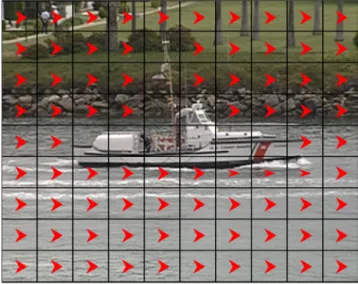
Compensation for global motion is dependent upon homo-geneous motion vector (MV) detection, consistent through-out the frame. Figure 3 considers the motion estimation between two consecutive frames, taken from the coastguard sequence. A fixed block size based on the frame resolution determines the number of MV blocks. The magnitude and phase of the MVs are represented by the size and direction of the arrows, respectively, whereas the absence of an arrow portrays an MV of zero. First, it is assumed there is a greater percentage of pixels within moving objects than in the back-ground, so large densities of comparative MVs are the result of dynamic camera action. To compensate for camera pan-ning, the entire reference frame is spatially translated by the most frequent MV, the global camera MV, Mglobal~ . This
process is applied prior to the2-Dþtwavelet decomposi-tion to deduce global modecomposi-tion compensated saliency estima-tion. The global motion compensation is described in Eq. (1)
EQ-TARGET;temp:intralink-;e001;326;494~
Mobject ¼Mtotal~ −Mglobal;~ (1)
whereMobject~ is the local object MV andMtotal~ is the com-plete combined MV.
Compensating for other camera movement can be achieved by searching for a particular pattern of MVs. For example, a circular MV pattern will determine camera rota-tion and all MVs converging or diverging from a particular point will govern camera zooming. An iterative search over all possible MV patterns can cover each type of global cam-era action.38Speeded up robust features detection39could be used to directly align key feature points between consecutive frames, but this would be very computationally exhaustive. This model only requires a fast rough global motion estimate to neglect the effect of global camera motion on the overall saliency map.
2.2 Spatial Saliency Model
As the starting point in generating the saliency map from a color image/frame, RGB color space is converted to YUV color spectral space as the latter exhibits prominent intensity variations through its luminance channel Y. First, the two-dimensional (2-D) forward discrete wavelet transform (FDWT) is applied on each Y, U, and V channel to decom-pose them in multiple levels. The 2-D FDWT decomdecom-poses an image in frequency domain expressing coarse grain approxi-mation of the original signal along with three fine grain orientated edge information at multiple resolutions. Discrete wavelet transform (DWT) captures horizontal, vertical, and diagonal contrasts within an image portraying prominent edges in various orientations. Due to the dyadic nature of the multiresolution wavelet transform, the image resolutions are decreased after each wavelet decomposition iteration. This is useful in capturing both short and long structural information at different scales and useful for saliency com-putation. The absolute values of the wavelet coefficients are normalized so that the overall saliency contributions come Fig. 2Proposed video VAM functional block diagram.
from each subband and prevent biasing toward the finer scale subbands. An average filter is also applied to remove unnec-essary finer details. To provide full resolution output maps, each of the high frequency subbands is consequently inter-polated up to full frame resolution. The interinter-polated subband feature maps, LHi (horizontal), HLi (vertical), and HHi (diagonal),i∈N1, for all decomposition levelsLare com-bined by a weighted linear summation as
EQ-TARGET;temp:intralink-;e002;63;418 LH1· · ·LX ¼ XL i¼1 LHiτi; HL1· · ·LX ¼ XL i¼1 HLiτi; HH1· · ·LX ¼ XL i¼1 HHiτi; (2)
whereτi is the subband weighting parameter andLH1· · ·LX, HL1· · ·LX, and HH1· · ·LX are the subband feature maps for a given spectral channelX, whereX∈fY; U; Vg.
A feature map promotion and suppression steps follow next as shown in Eq. (3). Ifm¯ is the average of local maxima present within the feature map and M is the global maxi-mum, the promotion and suppression normalization is achieved by
EQ-TARGET;temp:intralink-;e003;63;213
LHX¼LH1· · ·LX ðM−m¯Þ2; HLX¼HL1· · ·LX ðM−m¯Þ2;
HHX¼HH1· · ·LX ðM−m¯Þ2; (3)
wherelhX,hlX, andhhXare the normalized set of subband feature maps.
Finally, the overall saliency map,S, is generated by
EQ-TARGET;temp:intralink-;e004;63;113
S¼ X
∀X∈fY;U;Vg
wXSX; (4)
wherewXis the weight given to each spectral component and SX is the saliency map for each spectral channelðY; U; VÞ, which is computed as follows:
EQ-TARGET;temp:intralink-;e005;326;473
SX¼LHXþHLXþHHX: (5)
Finally, the overall map is generated by using a weight summation of all color channels as shown in Fig.4.
2.3 Temporal Saliency Model
2.3.1 2-D + t wavelet domain
We extend our spatial saliency model toward video domain saliency logically by utilizing a three-dimensional wavelet transform. Video coding research provides evidence that dif-fering texture and motion characteristics occur after wavelet decomposition from thetþ2-Ddomain40and incorporating its alternative technique, the 2-Dþt transform.41,42 The tþ2-Ddomain decomposition compacts most of the trans-form coefficient energy within the low frequency temporal subband and provides efficient compression within the tem-poral high frequency subbands. Vast quantities of the high frequency coefficients have zero magnitude, or very close, which is unnecessary for the transforms’usefulness within this framework. Alternatively,2-Dþtdecomposition produ-ces greater transform energy within the higher frequency components, i.e., a greater amount of larger and nonzero coefficients and reduces computational complexity to a great extent. A description of reduced computational com-plexity by using 2-Dþt compared to tþ2-D can be found in Ref. 42. Therefore, in this work we have used a 2-Dþtdecomposition as shown in Fig.5 (for three levels of spatial followed by one level of temporal Haar wavelet decomposition).
2.3.2 Temporal saliency feature map
To acquire accurate video saliency estimation, both spatial and temporal features within the wavelet transform are con-sidered. The wavelet-based spatial saliency model, described in Sec. 2.2, constitutes the spatial element for the video Fig. 4Overall functional diagram of the spatial visual saliency model.
saliency model, whereas this section concentrates upon establishing temporal saliency maps,STemp.
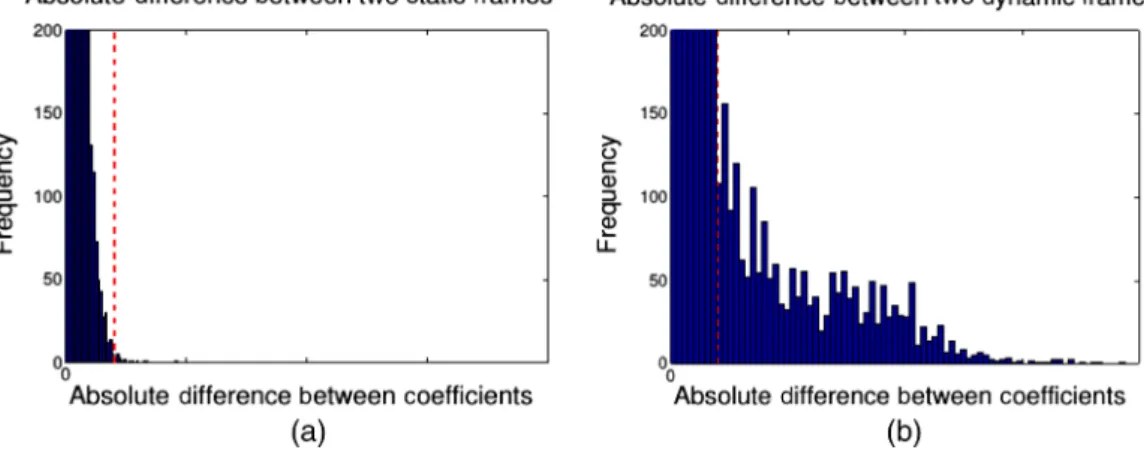
Similar methodology to expose temporal conspicuous-ness is implemented in comparison to the spatial model in Sec. 2.2. First, the existence of any palpable local object motion is determined within the sequence. Figure 6 shows the histograms of two globally motion compensated frames. Global motion is any frame motion due to camera move-ment, whether that be panning, zooming, or rotation (see Sec.2.1). Change within lighting, noise, and global motion compensation error account for the peaks present within Fig. 6(a), whereas the contribution from object movement is also present within Fig. 6(b). A local threshold,T, seg-ments frames containing sufficiently noticeable local motion, M, from an entire sequence. IfF1 and F2 are consecutive 8-bit luma frames within the same sequence, Eq. (6) classi-fies temporal frame dynamics using frame difference D
EQ-TARGET;temp:intralink-;e006;326;452
Dðx; yÞ ¼ jF1ðx; yÞ−F2ðx; yÞj: (6) From the histograms shown within Figs.6(a) and 6(b), a local threshold value ofT¼Dmax∕10determines motion classification, where Dmax is the maximum possible frame pixel difference, andT is highlighted by a red dashed line within both figures. A 0.5 percent error ratio of coefficients representing local motion M must be greater than T to reduce frame misclassification. For each temporally active frame, the Y channel renders sufficient information to esti-mate salient object movement without considering the U and V components.
TheSTempmethodology bears a distinct similarity to the spatial domain approach as the high pass temporal subbands: LHti,HLti, andHHti, forilevels of spatial decomposition, combine after full2-Dþtwavelet decomposition, which is shown in Fig. 5. The decomposed data are forged using Fig. 5 2-Dþt wavelet decomposition.
Fig. 6 Difference frames after global motion compensation: a sequence (a) without local motion and (b) containing local motion.
comparable logic as Eq. (2), as all transformed coefficients are segregated into 1 of 3 temporal subband feature maps. This process is described as
EQ-TARGET;temp:intralink-;e007;63;719 LHtt¼Xn i¼1 ðjLHtij↑2iτ iÞ; HLtt¼ Xn i¼1 ðjHLtij↑2iτiÞ; HHtt¼Xn i¼1 ðjHHtij↑2iτ iÞ; (7)
whereLHtt,HLtt, andHHttare the temporalLH,HL, and HH combined feature maps, respectively. The method cap-tures any subtle conspicuous object motion in horizontal, vertical, and diagonal directions. This subsequently fuses the coefficients into a meaningful visual saliency approximation by merging the data across multiple scales. STemp is finally generated from
EQ-TARGET;temp:intralink-;e008;63;529
STemp¼LHttþHLttþHHtt: (8)
2.4 Spatial-Temporal Saliency Map Combination
The spatial and temporal maps are combined to form an overall saliency map. The primary visual cortex is extremely sensitive to object movement so if enough local motion is detected within a frame, the overall saliency estimation is dominated by any temporal contribution with respect to local motionM. Hence, the temporal weightage parameter, γ, determined from Eq. (6) is calculated as
EQ-TARGET;temp:intralink-;e009;63;394
γ¼
1 if M> T;
0 otherwise: (9)
If significant motion is detected within a frame, the complete final saliency map comprises solely from the temporal fea-ture. Previous studies support this theory, providing evidence that local motion is the most dominant feature within low level VA.43 Consequently, if no local motion is detected with a frame, the spatial model contributes toward the final saliency map in its entirety, henceγis a binary variable. The equation forging the overall saliency map is
EQ-TARGET;temp:intralink-;e010;63;261
SFinal¼STempγþSSpat ð1−γÞ; (10)
where SSpat,STemp, andSFinal are the spatial, temporal, and combined overall saliency maps, respectively. An overall diagram for the entire proposed system is shown in Fig. 2. 3 Visual Attention-Based Video Watermarking We propose an algorithm that provides a solution toward blind and nonblind VA-based video watermarking. The video saliency model described in Sec. 2is utilized within the video watermarking framework to determine the water-marking embedding strength. Coinciding with the previous video VA model, watermark data are embedded within the 2-Dþt wavelet domain as outlined in Sec. 2.3.1. The VAM identifies the ROI most perceptive to human vision, which is a highly exploitable property when designing
watermarking systems. The subjective effect of watermark embedding distortion can be greatly reduced if any artifacts occur within inattentive regions. By incorporating VA-based characteristics within the watermarking framework, algo-rithms can provide a retained media visual quality and increased overall watermark robustness, compared with the methodologies that do not exploit the VA. This section proposes two (blind and nonblind) new video watermarking approaches that incorporate the VAM. In both scenarios, a content-dependent saliency map is generated which is used to calculate the region adaptive watermarking strength parameter alpha,α∈½0;1. A lower and higher value ofαin salient regions and nonsalient regions, respectively, ensures higher imperceptibility of the watermarked image distortions while keeping greater robustness.
3.1 Watermarking Algorithms
At this point, we describe the classical wavelet-based water-marking schemes without considering the VAM and sub-sequently propose the new approach that incorporates the saliency model. Frequency-based watermarking, more precisely wavelet domain watermarking, methodologies are highly favored in the current research era. The wavelet domain is also compliant within many image coding, e.g., JPEG200044 and video coding, e.g., motion JPEG2000, motion-compensated embedded zeroblock coding (MC-EZBC),45 schemes, leading to smooth adaptability within modern frameworks. Due to the multiresolution decomposi-tion and the property to retain spatial synchronizadecomposi-tion, which are not provided by other transforms (the discrete cosine transform for example), the DWT provides an ideal choice for robust watermarking.46–55
The FDWT is applied on the host image before watermark data are embedded within the selected subband coefficients. The inverse discrete wavelet transform reconstructs the watermarked image. The extraction operation is performed after the FDWT. The extracted watermark data are compared to the original embedded data sequence before an authenti-cation decision verifies the watermark presence. A wide vari-ety of potential adversary attacks, including compression and filtering, can occur in an attempt to distort or remove any embedded watermark data. A detailed discussion of such watermarking schemes can be found in Ref.56.
3.1.1 Nonblind watermarking
Magnitude-based multiplicative watermarking34,51,53,57–59is a popular choice when using a nonblind watermarking system due to its simplicity. Wavelet coefficients are modified based on the watermark strength parameter,α, the magnitude of the original coefficient,Cðm; nÞ, and the watermark information, Wðm; nÞ. The watermarked coefficients, C0ðm; nÞ, are obtained as follows:
EQ-TARGET;temp:intralink-;e011;326;172
C0ðm; nÞ ¼Cðm; nÞ þαWðm; nÞCðm; nÞ: (11)
Wðm; nÞis derived from a pseudorandom binary sequence,b, using weighting parameters,W1 andW2 (whereW2> W1), which are assigned as follows:
EQ-TARGET;temp:intralink-;e012;326;108
Wðm; nÞ ¼
W2 if b¼1
To obtain the extracted watermark, W0ðm; nÞ, Eq. (11) is rearranged as
EQ-TARGET;temp:intralink-;e013;63;591
W0ðm; nÞ ¼C0ðm; nÞ−Cðm; nÞ
αCðm; nÞ : (13)
Since the nonwatermarked coefficients,Cðm; nÞ, are needed for comparison, this results in nonblind extraction. A thresh-old limit ofTw¼W1þW2
2 is used to determine the extracted binary watermarkb0 as follows:
EQ-TARGET;temp:intralink-;e014;63;500 b0¼ 1 ifW0ðm; nÞ≥Tw 0 ifW0ðm; nÞ<Tw: (14) 3.1.2 Blind watermarking
Quantization-based watermarking52,54–63 is a blind scheme which relies on modifying various coefficients toward a spe-cific quantization step. As proposed in Ref.52, the algorithm is based on modifying the median coefficient toward the step size,δ, by using a running nonoverlapping3×1 pixels win-dow. The altered coefficient must retain the median value of the three coefficients within the window after the modifica-tion. The equation calculatingδis described as follows:
EQ-TARGET;temp:intralink-;e015;63;340
δ¼αðCminÞ þ ðCmaxÞ
2 ; (15)
where Cmin and Cmax are the minimum and maximum coefficients, respectively. The median coefficient, Cmed, is quantized towards the nearest step, depending on the binary watermark,b. The extracted watermark,b0, for a given win-dow position, is extracted by
EQ-TARGET;temp:intralink-;e016;63;243 b0¼ Cmax−Cmed δ %2; (16)
where % denotes the modulo operator to detect an odd or even number andCmedis the median coefficient value within the 3×1 pixels window.
3.1.3 Authentication of extracted watermarks
Authentication is performed by comparison of the extracted watermark with the original watermark information and computing closeness between the two in a vector space. Common authentication methods are defined by calculating the similarity correlation or Hamming distance,H, between the original embedded and extracted watermark as follows:
EQ-TARGET;temp:intralink-;e017;326;613
Hðb; b0Þ ¼ 1
N
X
bb0; (17)
where N represents the length of the watermark sequence and; is the XOR logical operation between the respective bits.
3.2 Saliency Map Segmentation
This section presents the threshold-based saliency map segmentation which is used for adapting the watermarking algorithms described in Sec.3.1in order to change the water-mark strength according to the underlying VA properties. Figures7(a)and7(b)show an example original host frame and its corresponding saliency map, respectively, generated from the proposed methodology in Sec.2. In Fig.7(b), the light and dark regions within the saliency map represent the visually attentive and nonattentive areas, respectively. At this point, we employ thresholding to quantize the saliency map into coarse saliency levels as fine granular saliency lev-els are not important in the proposed application. In addition, that may also lead to reducing errors in saliency map regen-eration during watermark extraction as follows. Recalling blind and nonblind watermarking schemes in Sec. 3.1, the host media source is only available within nonblind algorithms. However in blind algorithms, identical saliency reconstruction might not be possible within the watermark extraction process due to the coefficient values changed by watermark embedding as well as potential attacks. Thus, the saliency map is quantized using thresholds leading to regions of similar visual attentiveness. The employment of a threshold reduces saliency map reconstruction errors, which may occur as a result of any watermark embedding distortion, as justified further in Sec.3.4.
The thresholding strategy relies upon a histogram analysis approach. Histogram analysis depicts automatic segmenta-tion of the saliency map into two independent levels by employing the saliency threshold,Ts, wheres∈Srepresents the saliency values in the saliency map,S. In order to seg-ment highly conspicuous locations within a scene, first, the cumulative frequency function, f, of the ordered saliency values,s, (from 0 to the maximum saliency value,smax) is considered. ThenTs is chosen as
EQ-TARGET;temp:intralink-;e018;326;148
Ts¼f−1ðpfmaxÞ; (18)
wherepcorresponds to the percentage of the pixels that can be set as the least attentive pixels andfmax¼fðsmaxÞ corre-sponds to the cumulative frequency corresponding to the maximum saliency value,smax. An example of a cumulative Fig. 7(a) Example host image, (b) VAM saliency map (saliency is proportional to the gray scale),
(c) cumulative saliency histogram, (d)αstep graph, and (e)αstrength map (dark corresponds to low strength).
frequency plot of a saliency map and findingTsforp¼0.75 is shown in Fig. 7(c).
Saliency-based thresholding enables determining the coefficients’ eligibility for a low- or high-strength water-marking. To ensure VA-based embedding, the watermark weighting parameter strength, α, in Eqs. (11) and (15), is made variable αðj; kÞ, dependent upon Ts, as follows:
EQ-TARGET;temp:intralink-;e019;63;675 αðj; kÞ ¼ αmax if sðj; kÞ<Ts; αmin if sðj; kÞ≥Ts; (19)
whereαðj; kÞis the adaptive watermark strength map giving the αvalue for the corresponding saliency at a given pixel coordinate ðj; kÞ. The watermark weighting parameters, αmin and αmax, correspond to the high and low strength values, respectively, and their typical values are determined from the analysis within Sec. 3.3. As shown in Fig. 7(d), the most and the least salient regions are given watermark weighting parameters of αmin and αmax, respectively. An example of the final VA-based alpha watermarking strength map is shown in Fig.7(e), where a brighter intensity repre-sents an increase in α.
3.3 Watermark Embedding Strength Calculation
The watermark weighting parameter strengths, αmax and αmin, can be calculated from the visible artifact peak sig-nal-to-noise ratio (PSNR) limitations within the image. Visual distortion becomes gradually noticeable as the over-all PSNR drops below 40∼35 dB,64 so minimum and maximum PSNR requirements are set to approximate 35 and 40 dB, respectively, for both the blind and nonblind watermarking schemes. These PSNR limits ensure a maxi-mum amount of data can be embedded into any host image to enhance watermark robustness without substantially distorting the media quality. Therefore, it is sensible to incorporate PSNR in determining the watermark strength parameterα.
Recall that PSNR, which measures the error between two images with dimensions X×Y, is expressed on the pixel domain as follows: EQ-TARGET;temp:intralink-;e020;63;308 PSNRðI; I0Þ ¼10 log M2 1 XY PX j¼1 PY k¼1½I0ðj; kÞ−Iðj; kÞ 2 ; (20) whereMis the maximum coefficient value of the data, and Iðj; kÞandI0ðj; kÞare the original and watermarked image pixel values at ðj; kÞ indices, respectively. Considering the use of orthogonal wavelet kernels and the Parseval’s theo-rem, the mean square error in the wavelet domain due to watermarking is equal to the mean square error in the spatial domain.48Therefore, Eq. (20) can be redefined on the trans-form domain for nonblind magnitude-based multiplicative watermarking, shown in Eq. (11), as follows:
EQ-TARGET;temp:intralink-;e021;63;148 PSNRðI;I0Þ ¼10 log M2 1 XY PX m¼1 PY n¼1½αWðm;nÞCðm;nÞ2 : (21) By rearranging forα, an expression determining the water-mark weighting parameter depending on the desired PSNR
value is derived for nonblind watermarking in Eq. (22) as follows: EQ-TARGET;temp:intralink-;e022;326;730 α¼ ffiffiffiffiffiffiffiffiffiffiffiffiffiffiffiffiffiffiffiffiffiffiffiffiffiffiffiffiffiffiffiffiffiffiffiffiffiffiffiffiffiffiffiffiffiffiffiffiffiffiffiffiffiffiffiffiffiffiffiffiffiffiffiffiffiffiffiffiffiffiffiffiffiffiffiffiffiffiffiffiffiffiffiffiM 10ðPSNRðI;I0Þ∕10Þ XY PX m¼1 PY n¼1½Wðm; nÞCðm; nÞ2 q : (22)
Similarly, for the blind watermarking scheme described in Sec.3.1.2, PSNR in the transform domain can be estimated by substituting the median and modified median coefficients, CðmedÞandCð0medÞ, respectively, in Eq. (20). Then subsequent rearranging results in an expression for the total error in median values, in terms of the desired PSNR as follows:
EQ-TARGET;temp:intralink-;e023;326;610 XX m¼1 XY n¼1 ðC0 ðmedÞ−CðmedÞÞ2¼XY M2 10ðPSNR∕10Þ: (23) Equation (23) determines the total coefficient modification for a given PSNR requirement, hence it is used for α in Eq. (15).
3.4 Saliency Map Reconstruction
For nonblind watermarking, the host data are available during watermark extraction so an identical saliency map can be generated. However, a blind watermarking scheme requires the saliency map to be reconstructed based upon the watermarked media, which may have gotten pixel values slightly different from the original host media. Thresholding the saliency map into two levels, as described in Sec.3.2, ensures high accuracy within the saliency model reconstruction for blind watermarking. Further experimental objective analysis reveals that the use of thresholding improves the saliency coefficients match up to 99.4% com-pared to approximately only 55.6% of coefficients when thresholding was not used, hence reconstruction errors are greatly reduced.
4 Experimental Results and Discussion
The performance of the proposed video VA method and its application in robust video watermarking is presented and discussed in this section. The video VAM is evaluated in terms of the accuracy with respect to the ground truth and computational time in Sec.4.1. The video VA-based water-marking is evaluated in terms of embedding distortion and robustness to compression in Sec.4.2.
4.1 Visual Attention Model Evaluation
For attention model evaluation, the video dataset is taken from the literature,65which is comprised of 15 video sequen-ces, containing over 2000 frames in total. Ground truth video sequences have been generated from the database by subjec-tive testing. A thumbnail from each of the 15 test sequences are shown in Fig.8. Common test set parameters for VAM and later in watermarking, used throughout all performed experiments, include: the orthogonal Daubechies length 4 (D4) wavelet for three levels of 2-D spatial decomposition and one level of motion compensated temporal Haar decomposition.
Experimental results demonstrate the model performance against the existing state-of-the-art methodologies. The pro-posed algorithm is compared with the Itti,15dynamic,66and
Fang19 video VAMs, in terms of accurate salient region detection and computational efficiency. The Itti framework is seen as the foundation and benchmark used for VA model comparison, whereas the dynamic algorithm is dependent upon locating energy peaks within incremental length cod-ing. A more recent Fang algorithm uses a spatiotemporally adaptive entropy-based uncertainty weighting approach.
Figure9 shows the performance of the proposed model and compares it against the Itti, dynamic, and Fang algo-rithms. The Itti motion model saliency maps are depicted in column 2, the dynamic model saliency maps in column 3 and the Fang model in column 4. Results obtained using the proposed model are shown in column 5 where from top to bottom, the locally moving snowboarder, flower, and bird are clearly identified as salient objects. Corresponding ground truth frames are shown in column 6, which depict all salient local object movement. Results from our model are subjected
to the presence of significant object motion, which domi-nates the saliency maps. This is in contrast to the other mod-els where differences between local and global movements are not fully accounted for, therefore, those maps are domi-nated by spatially attentive features, leading to salient object misclassification. For example, the trees within the back-ground of the snowboard sequence are estimated as an atten-tive region when a man is performing acrobatics within the frame foreground.
The receiver operating characteristic (ROC) curves and corresponding area under curve (AUC) values, shown in Fig. 10 and the top row in Table 1, respectively, display an objective model evaluation. The results show the pro-posed method is close to the recent Fang model and exceeds the performance of the Itti motion and dynamic models hav-ing 3.5% and 8.2% higher ROC-AUCs, respectively. Further results demonstrating our video VA estimation model across
Fig. 9 Temporal VAM comparison table: column 1, example original frames from the sequences; column 2, Itti model;15column 3, dynamic model;66column 4, Fang model;19column 5, proposed method,
and column 6, ground truth.
four video sequences are shown in Fig.11. Video saliency becomes more evident when viewed as a sequence rather than from still frames. The video sequences with correspond-ing saliency maps are available for viewcorrespond-ing in Ref.67.
The bottom row in Table1shows the complexity of each algorithm in terms of average frame computational time. The values in the table are calculated from the mean com-putational time over every frame within the video database and provide the time required to form a saliency map from the original raw frame. All calculations include any transfor-mations required. From the table, the proposed low complex methodology can produce a video saliency map around 30%, 88%, and 0.5% of the time for the Itti, dynamic, and Fang model frames, respectively. Additionally, the proposed model uses the same wavelet decomposition scheme used for watermarking. Therefore, overall visual saliency-based watermarking complexity is low compared to all three methods compared in this paper.
4.2 Visual Attention-Based Video Watermarking
The proposed VA-based watermarking is agnostic to the watermark embedding methodology. Thus, it can be used on any existing watermarking algorithm. In our experiments, we use the nonblind embedding proposed by Xia et al.51 and the blind algorithm proposed by Xie and Arce52 as our reference algorithms.
A series of experimental results are generated for our video watermarking case study as described in Sec. 3,
analyzing both watermark robustness and imperceptibility. Objective and subjective quality evaluation tools are enforced to provide a comprehensive embedding distortion measure. Robustness against H.264/AVC compression68 is provided, as common video attacks are comprised of platform reformatting and video compression. Since the VA-based watermarking scheme was presented here as a case study of exploitation of the proposed VAM, our main focus of performance evaluation is on the embedding distortion and the robustness performance with respect to compression attacks. Compression attacks are given focus as watermarking algorithms often employ a higher water-marking strength for encountering the compression and requantization attack. In this work, we demonstrate robust-ness against H.264/AVC compression, for example. The watermarking evaluation results are reported using the four example video sequences (shown in Fig.11) from the same data set used for VAM evaluation in the previous section.
αmax andαmin approximating a PSNR of 35 and 40 dB, respectively, are utilized by applying Eqs. (22) and (23). Four scenarios of varied watermark embedding strengths are con-sidered for the VA-based video watermarking evaluation as follows:
1. a uniformαmin throughout the entire sequence; 2. the proposed visual VAM-based αstrength;
3. a uniform average watermark strength,αave, chosen as αave¼ ðαminþαmaxÞ∕2; and
4. a uniform αmax used throughout the entire video sequence.
The experimental results are shown in the following two sections: embedding distortion (visual quality) and robustness.
4.2.1 Embedding distortion
The embedding distortion can be evaluated using objective metrics or subjective metrics. While objective quality mea-surements are mathematical models that are expected to approximate results from subjective assessments and are easy to compute, subjective measurements ensure a viewer’s overall opinion of the quality of experience of the visual quality. Often these metrics are complimentary to each other and particularly important in this paper to measure the effect on imperceptibility of the proposed watermark algorithms.
1.“Objective metrics”define a precise value, dependent upon mathematical modeling, to determine visual quality. Such metrics include PSNR, structural similarity index mea-sure (SSIM),69just noticeable difference,70and video quality metric (VQM).71 PSNR that calculates the average error between two images is one of the most commonly used visual quality metrics and is described in Eq. (20). Unlike PSNR, SSIM focuses on a quality assessment based on the degradation of structural information. SSIM assumes that the HVS is highly adapted for extracting structural infor-mation from a scene. A numeric output is generated between 1 and 0 and higher video quality is represented by values closer to 1. VQM evaluates video quality based upon sub-jective human perception modeling. It incorporates numer-ous aspects of early visual processing, including both luma and chroma channels, a combination of temporal and spatial Table 1 AUC and computational times comparing state-of-the-art
video domain VAMs.
VA method Itti15 Dynamic66 Fang19 Proposed
ROC AUC 0.804 0.769 0.867 0.832 Average frame
computational time (s)
0.244 0.194 31.54 0.172 0 0.1 0.2 0.3 0.4 0.5 0.6 0.7 0.8 0.9 1
False Positive Rate
0 0.1 0.2 0.3 0.4 0.5 0.6 0.7 0.8 0.9 1
True Positive Rate
ROC curve - model comparison (15 video sequences)
Proposed Itti Dynamic Fang
Fig. 10 ROC curve comparing performance of proposed model with state-of-the-art video domain VAMs: Itti model,15dynamic model,66
filtering, light adaptation, spatial frequency, global contrast, and probability summation. A numeric output is generated between 1 and 0 and higher video quality is represented by values closer to 0. VQM is a commonly used video quality assessment metric as it eliminates the need for participants to provide a subjective evaluation.
Although the subjective evaluation is considered as the most suitable evaluation for the proposed method in this paper, the visual quality evaluation in terms of the PSNR, SSIM, and VQM metrics are shown in Tables 2 and 3 for nonblind and blind watermarking schemes, respectively. In both PSNR and SSIM, higher values signify better visual quality. The performance of the four watermarking scenarios in terms of both SSIM and PSNR is rank ordered in terms of the highest visual quality, as follows: low strength embedding (ðαminÞ>VA-based algorithm∕average strength>
high strength embeddingðαmaxÞ. From the tables, PSNR
improvements of∼3 dB are achieved when comparing the proposed VA-based approach and constant high strength scenario. The SSIM measures remain consistent for each scenario, with a decrease of 2% for the high-strength water-marking model in most cases. In terms of the VQM metric, which mimics subjective evaluation, the proposed VA-based watermarking consistently performs better than average or high-strength watermarking scenarios.
Objective metrics, such as PSNR, SSIM, and VQM, do not necessarily equal identical perceived visual quality. Two distorted frames with comparable PSNR, SSIM, or VQM metrics do not necessitate coherent media quality. Two independent viewers can undergo entirely different visual experiences, as two similarly distorted frames can provide a contrasting opinion for which contains higher visual quality. To provide a realistic visual quality evaluation, subjective testing is used to analyze the impact of the proposed Fig. 11 Video visual attention estimation results for four example sequences: row 1, original frame from
the sequence; row 2, proposed saliency map; and row 3, ground truth. Video sequences and the VA map sequences are available at Ref.67.
watermarking scheme on the overall perceived human view-ing experience.
2.“Subjective evaluation”measures the visual quality by recording the opinion of human subjects on the perceived visual quality. The watermarked videos were viewed by
30 subjects, following the standard ITU-T35 viewing test specifications, often used in compression quality evaluation experiments. The final rating was arrived at by averaging all ratings given by the subjects. This work employs two subjective evaluation metrics that are computed based on the subjective viewing scores, as follows:
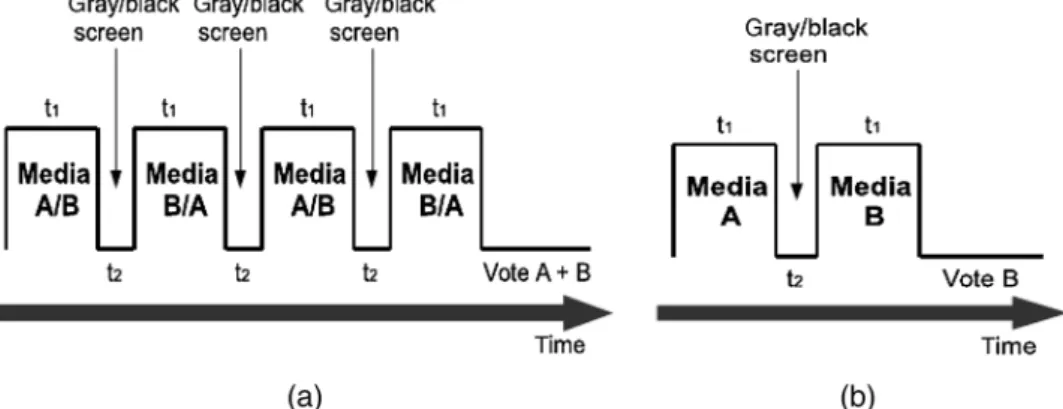
“Double stimulus continuous quality test”(DSCQT) sub-jectively evaluates any media distortion by using a continu-ous scale. The original and watermarked media is shown to the viewer in a randomized order. The viewer must provide a rating for the media quality of the original and watermarked images individually using a continuous scaling, as shown in Fig.12(a). Then the degradation category rating (DCR) value is calculated by the absolute difference between the subjec-tive ratings for the two test images.
Double stimulus impairment scale test (DSIST) deter-mines the perceived visual degradation between two media sources, A and B, by implementing a discrete scale. A viewer must compare the quality of B with respect to A, on a 5-point discrete absolute category rating (ACR) scale, as shown in Fig.12(b).
In a subjective evaluation session, first, training images are shown to acclimatize viewers to both ACR and DCR scoring systems. In either of the two subjective tests, a higher value in DCR or ACR scales represents a greater perceived visual quality. Figure13shows an overall timing diagram for each subjective testing procedure, showing the sequence of test image displays for scoring by the viewers. Note that the video display time,t1, and blank screen time,t2, before the change of video, should satisfy the following condition: t1 > t2.
Subjective evaluation performed in this work comprises of DSCQT and DSIST and the results are shown in Fig.14for both nonblind and blind watermarking schemes. The top and bottom rows in Fig.14show subjective results for the nonblind and blind watermarking cases, respectively, whereas the left and right columns show the results using DSCQT and DSIST evaluation tools. Consistent results are portrayed for both the blind and nonblind scenarios. Figure14shows the subjective test results for DCQST and DSIST averaged over four video test sequences. For the DSCQT, the lower the DCR, the better the visual quality, i.e., fewer embedding distortions. In the given results, when comparing the proposed and low strength embedding meth-odologies, the DCR value only deviates by approximately one unit in the rating scale, suggesting a subjectively similar Table 2 PSNR, SSIM, and VQM average of four video sequences for
nonblind watermarking.
Low strength Proposed
Average
strength High strength PSNR 40.150.80 37.390.87 37.470.76 34.930.73 SSIM 0.990.00 0.970.00 0.980.00 0.950.01
VQM 0.10 0.15 0.18 0.25
Table 3 PSNR, SSIM, and VQM average of four video sequences for blind watermarking.
Low strength Proposed
Average
strength High strength PSNR 40.231.03 36.801.02 37.200.92 34.850.90 SSIM 0.990.00 0.980.00 0.980.00 0.960.01
VQM 0.08 0.13 0.15 0.22
Fig. 12 Subjective testing visual quality measurement scales (a) DCR continuous measurement scale and (b) ACR ITU 5-point dis-crete quality scale.
visual quality. The high-strength watermarking scheme shows a high DCR value indicating significantly higher degradation of subjective visual quality compared with the VAM-based methodology. Similar outcomes are evident from the DSIST plots, where the higher mean opinion score (MOS) on ACR corresponds to better visual quality, i.e., fewer embedding visual distortions. DSIST plots for low-strength and VAM-based schemes show a similar ACR MOS approximately in the range 3 to 4, whereas the high strength watermark yields an ACR of less than 1 for nonblind and nearly 2 for blind watermarking. Compared with an average watermark strength, the proposed watermarking scheme shows an improved subjective image quality in all four graphs by around 0.5 to 1 units. As more data are embedded within the visually salient regions, the subjective visual quality of constant average strength watermarked images is worse than the proposed methodology.
For visual inspection, an example of watermark embed-ding distortion is shown in Fig. 15. The original, the low strength watermarked, VAM-based watermarked, and the high strength watermarked images are shown in four con-secutive columns, where the distortions around the legs of the player with blue jersey (row 1) and around the tennis player (row 2) are distinctively visible in high-strength watermarking.
For each of the blind and nonblind watermarking cases, in both the objective and subjective visual quality evaluations, the low strength watermark and VAM-based watermarking sequences yield similar visual quality, whereas the high strength embedded sequence appears severely more distorted. Low-strength watermarking provides a high imperceptibility but is fragile as discussed in Sec.4.2.2.
4.2.2 Robustness
Video reformatting and compression are frequent and typically unintentional adversary attacks, hence watermark tolerance for H.264/AVC compression is calculated. Robustness against H.264/AVC compression for both non-blind and non-blind video watermarking schemes is shown in Figs.16(a)and16(b), respectively. For simulating the water-mark robustness, five constant quantization parameter (QP) values are implemented to compress the high strength, aver-age strength, VA-based, and low strength test sequences. In both scenarios as shown in the plots, the proposed VA-based methodology shows an increase in robustness compared with the low strength watermark counterpart where a lower Hamming distance indicates better robustness. From the plots in Fig.16, Hamming distance reductions up to 39% for the nonblind case and 22% for the blind case are possible, when comparing the low and VA-based models. Naturally, the high-strength watermarking scheme portrays a strong Hamming distance but is highly perceptible (low visual qual-ity), as described previously. The proposed watermarking scheme has a slight increased robustness toward H.264/AVC compression, as shown in Fig.16, when compared against a constant average strength watermark. It is worth noting that for a constant QP value, the compression ratio is inversely proportional to the increase in watermark strength, i.e., as the watermark strength increases, the overall compression ratio decreases due to the extra watermark capacity.
The proposed VA-based method results in a robustness close to the high-strength watermarking scheme, while showing low distortions, as in the low-strength watermarking approach. The incurred increase in robustness coupled with Fig. 14 Subjective video watermarking embedding distortion measures for different embedding
scenar-ios: high strength (high), average strength, VA-based strength selection (VAM) and low strength (low), row 1: nonblind watermarking, row 2: blind watermarking, column 1: DSCQT, and column 2: DSIST.
high imperceptibility, verified by subjective and objective metrics, deem the VA-based methodology highly suitable for providing an efficient watermarking scheme.
5 Conclusions
In this paper, we have presented a video watermarking algo-rithm using a motion compensated VAM. The proposed method exploits both spatial and temporal cues for saliency modeled in a motion-compensated spatiotemporal wavelet multiresolution analysis framework. The spatial cues were modeled using the 2-D wavelet coefficients. The temporal cues were modeled using the temporal wavelet coefficients by considering the global and local motion in the video. We have used the proposed VA model in visual-attention-based
video watermarking to achieve robust video watermarking that has minimal or no effect on the visual quality due to watermarking. In the proposed scheme, a two-level water-marking weighting parameter map is generated from the VAM saliency maps using the proposed saliency model and data are embedded into the host image according to the vis-ual attentiveness of each region. By avoiding higher strength watermarking in the visually attentive region, the resulted watermarked video achieved high perceived visual quality while preserving high robustness.
The proposed VAM outperforms the state-of-the-art video VA methods in joint saliency detection and low computa-tional complexity performances. The saliency maps from the proposed method are dominated by the presence of Fig. 16 Robustness to H.264/AVC compression: average of four video sequences: (a) nonblind
watermarking and (b) blind watermarking.
Fig. 15Example frames from soccer and tennis sequences after watermarking with different embedding scenarios (for visual inspection): column 1: original frame, column 2: low strength watermarked frame, column 3: VA-based watermarked frame, and column 4: high strength watermarked frame.
significant object motion. This is in contrast to the other models where differences between local and global move-ments are not fully accounted for, therefore, those maps are dominated by spatially attentive features, leading to salient object misclassification. The watermarking perfor-mance was verified by performing the subjective evaluation methods as well as the objective metric VQM. For the same embedding distortion, the proposed VA-based watermarking achieved up to 39% (nonblind) and 22% (blind) improve-ment in robustness against H.264/AVC compression attacks, compared to the existing methodology that does not use the VAM. Finally, the proposed VA-based video watermarking has resulted in visual quality similar to that of low-strength watermarking and robustness similar to those of high-strength watermarking.
Acknowledgments
We acknowledge the support of the UK Engineering and Physical Research Council (EPSRC), through a Dorothy Hodgkin Postgraduate Award and a Doctoral Training Award at the University of Sheffield.
References
1. A. M. Treisman and G. Gelade, “A feature-integration theory of attention,”Cognit. Psychol.12(1), 97–136 (1980).
2. O. Hikosaka, S. Miyauchi, and S. Shimojo,“Orienting of spatial atten-tion-its reflexive, compensatory, and voluntary mechanisms,”Cognit. Brain Res.5(1–2), 1–9 (1996).
3. L. Itti and C. Koch, “Computational modelling of visual attention,”
Nat. Rev. Neurosci.2, 194–203 (2001).
4. R. Desimone and J. Duncan,“Neural mechanisms of selective visual attention,”Annu. Rev. Neurosci.18(1), 193–222 (1995).
5. D. Ress, B. T. Backus, and D. J. Heeger,“Activity in primary visual cortex predicts performance in a visual detection task,”Nat. Neurosci. 3(9), 940–945 (2000).
6. J. M. Wolfe and T. S. Horowitz,“What attributes guide the deployment of visual attention and how do they do it?”Nat. Rev. Neurosci.5(6), 495–501 (2004).
7. R. Achanta et al.,“Frequency-tuned salient region detection,”inProc. IEEE Conf. on Computer Vision and Pattern Recognition (CVPR‘09), pp. 1597–1604 (2009).
8. A. Borji and L. Itti,“State-of-the-art in visual attention modeling,”IEEE Trans. Pattern Anal. Mach. Intell.35, 185–207 (2013).
9. L. Itti, C. Koch, and E. Niebur,“A model of saliency-based visual atten-tion for rapid scene analysis,”IEEE Trans. Pattern Anal. Mach. Intell. 20, 1254–1259 (1998).
10. L. ZhiQiang, F. Tao, and H. Hong,“A saliency model based on wavelet transform and visual attention,”Inf. Sci.53, 738–751 (2010). 11. S. Goferman, L. Zelnik-Manor, and A. Tal,“Context-aware saliency
detection,” in Proc. IEEE Conf. on Computer Vision and Pattern Recognition (CVPR‘10), pp. 2376–2383 (2010).
12. B. P. Ölveczky, S. A. Baccus, and M. Meister,“Segregation of object and background motion in the retina,” Nature 423(6938), 401–408 (2003).
13. F. Guraya and F. Cheikh,“Predictive visual saliency model for surveil-lance video,” in Proc. IEEE European Signal Processing Conf. (EUSPICO‘11), pp. 554–558 (2011).
14. O. Meur, P. Callet, and D. Barba,“Predicting visual fixations on video based on low-level visual features,”Vision Res.47, 2483–2498 (2007). 15. L. Itti and N. Dhavale,“Realistic avatar eye and head animation using a neurobiological model of visual attention,”Proc. SPIE5200, 64 (2004). 16. Y. Tong et al.,“A spatiotemporal saliency model for video surveillance,”
Cognit. Comput.3, 241–263 (2011).
17. C. Guo and L. Zhang,“A novel multiresolution spatiotemporal saliency detection model and its applications in image and video compression,”
IEEE Trans. Image Process.19, 185–198 (2010).
18. S.-H. Zhong et al.,“Video saliency detection via dynamic consistent spatio-temporal attention modelling,” in Association for the Advancement of Artificial Intelligence(2013).
19. Y. Fang et al.,“Video saliency incorporating spatiotemporal cues and uncertainty weighting,”IEEE Trans. Image Process.23, 3910–3921 (2014).
20. Y. Zhai and M. Shah,“Visual attention detection in video sequences using spatiotemporal cues,”inProc. ACM Int. Conf. on Multimedia, pp. 815–824 (2006).
21. M. Dorr, E. Vig, and E. Barth,“Colour saliency on video,” in Bio-Inspired Models of Network, Information, and Computing Systems, Vol. 87, pp. 601–606 (2012).
22. C. C. Loy, X. Tao, and G. S. Gong, “Salient motion detection in crowded scenes,” in Int. Symp. on Communications Control and Signal Processing, (ISCCSP‘12), pp. 1–4 (2012).
23. D. Que et al.,“An ROI image watermarking algorithm based on lifting wavelet transform,”inProc. Int. Conf. on Signal Processing, Vol. 4, pp. 16–20 (2006).
24. R. Ni and Q. Ruan,“Region of interest watermarking based on fractal dimension,”inProc. Int. Conf. on Pattern Recognition, pp. 934–937 (2006).
25. R. Wang, Q. Cheng, and T. Huang,“Identify regions of interest (ROI) for video watermark embedment with principle component analysis,”in Proc. ACM Int. Conf. on Multimedia, pp. 459–461 (2000).
26. C. Yiping et al.,“Region of interest fragile watermarking for image authentication,”inInt. Multi-Symp. on Computer and Computational Sciences (IMSCCS‘06), Vol. 1, pp. 726–731 (2006).
27. L. Tian et al., “An integrated visual saliency-based watermarking approach for synchronous image authentication and copyright protec-tion,”Image Commun.26, 427–437 (2011).
28. B. Ma et al.,“Salient region detection for biometric watermarking,”in Computer Vision for Multimedia Applications: Methods and Solutions, pp. 218–236, IGI Global (2010).
29. A. Sur et al.,“A new image watermarking scheme using saliency based visual attention model,”inAnnual IEEE India Conf. (INDICON‘09), pp. 1–4 (2009).
30. M. Oakes, D. Bhowmik, and C. Abhayaratne,“Visual attention-based watermarking,”in IEEE Int. Symp. on Circuits and Systems (ISCAS
‘11), pp. 2653–2656 (2011).
31. D. Bhowmik, M. Oakes, and C. Abhayaratne,“Visual attention-based image watermarking,”IEEE Access4, 8002–8018 (2016).
32. M. Oakes,“Attention driven solutions for robust digital watermarking within media,”PhD Thesis, University of Sheffield (2014).
33. L. Tian et al.,“Authentication and copyright protection watermarking scheme for h. 264 based on visual saliency and secret sharing,”
Multimedia Tools Appl.74(9), 2991–3011 (2015).
34. A. Barari and S. V. Dhavale,“Video saliency detection for visual cryp-tography-based watermarking,” in Innovative Research in Attention Modeling and Computer Vision Applications, p. 132, IGI Global (2015).
35. H. G. Koumaras,“Subjective video quality assessment methods for multimedia applications,”Technical Report ITU-R BT.500-11, Geneva, Switzerland (2008).
36. M. Oakes and C. Abhayaratne,“Visual saliency estimation for video,” in Proc. 13th Int. Workshop on Image Analysis for Multimedia Interactive Services, pp. 1–4 (2012).
37. H. Wilson,“Psychophysical models of spatial vision and hyper-acuity,” Spat. Vision10, 64–81 (1991).
38. R. Jin, Y. Qi, and A. Hauptmann,“A probabilistic model for camera zoom detection,”inProc. Int. Conf. on Pattern Recognition, Vol. 3, pp. 859–862 (2002).
39. H. Bay, T. Tuytelaars, and L. V. Gool,“SURF: speeded up robust fea-tures,”inEuropean Conf. on Computer Vision, pp. 404–417 (2006). 40. S. Choi and J. W. Woods,“Motion-compensated 3-D subband coding of
video,”IEEE Trans. Image Process.8(2), 155–167 (1999). 41. Y. Andreopoulos et al.,“In-band motion compensated temporal
filter-ing,”Signal Process. Image Commun.19(7), 653–673 (2004). 42. D. Bhowmik and C. Abhayaratne,“2D+t wavelet domain video
water-marking,”Adv. Multimedia2012, 973418 (2012).
43. D. Mahapatra, S. Winkler, and S. Yen,“Motion saliency outweighs other low-level features while watching videos,” Proc. SPIE 6806, 68060P (2008).
44. D. S. Taubman and M. W. Marcellin,JPEG2000 Image Compression Fundamentals, Standards and Practice, Springer (2002).
45. P. Chen and J. W. Woods,“Bidirectional MC-EZBC with lifting imple-mentation,”IEEE Trans. Circuits Syst. Video Technol.14(10), 1183– 1194 (2004).
46. G. Bhatnagar, Q. M. J. Wu, and B. Raman,“Robust gray-scale logo watermarking in wavelet domain,” Comput. Electr. Eng. 38, 5, 1164–1176 (2012).
47. A. Piper, R. Safavi-Naini, and A. Mertins,“Resolution and quality scal-able spread spectrum image watermarking,”inProc. 7th Workshop on Multimedia and Security: MM&Sec’05, pp. 79–90 (2005).
48. D. Bhowmik and C. Abhayaratne,“A generalised model for distortion performance analysis of wavelet based watermarking,” Lect. Notes Comp. Sci.5450, 363–378 (2008).
49. C. Abhayaratne and D. Bhowmik,“Scalable watermark extraction for real-time authentication of JPEG2000 images,” J. Real-Time Image Process.6(4), 19 (2011).
50. D. Bhowmik and C. Abhayaratne,“Quality scalability aware water-marking for visual content,” IEEE Trans. Image Process. 25(11), 5158–5172 (2016).
51. X. Xia, C. G. Boncelet, and G. R. Arce,“Wavelet transform based watermark for digital images,”Opt. Express3, 497–511 (1998).
52. L. Xie and G. R. Arce,“Joint wavelet compression and authentication watermarking,”inProc. IEEE Int. Conf. on Image Processing, Vol. 2, pp. 427–431 (1998).
53. M. Barni, F. Bartolini, and A. Piva,“Improved wavelet-based water-marking through pixel-wise masking,” IEEE Trans. Image Process. 10, 783–791 (2001).
54. C. Jin and J. Peng,“A robust wavelet-based blind digital watermarking algorithm,”Int. J. Inf. Technol.5(2), 358–363 (2006).
55. R. S. Shekhawat, V. S. Rao, and V. K. Srivastava,“A biorthogonal wave-let transform based robust watermarking scheme,”inProc. IEEE Conf. on Electrical, Electronics and Computer Science (SCEECS), pp. 1–4 (2012).
56. D. Bhowmik and C. Abhayaratne,“On robustness against JPEG2000: a performance evaluation of wavelet-based watermarking techniques,”
Multimedia Syst.20(2), 239–252 (2014).
57. Q. Gong and H. Shen,“Toward blind logo watermarking in JPEG-compressed images,”inSixth Int. Conf. on Parallel and Distributed Computing, Applications and Technologies (PDCAT‘05), pp. 1058– 1062 (2005).
58. J. R. Kim and Y. S. Moon,“A robust wavelet-based digital watermark-ing uswatermark-ing level-adaptive thresholdwatermark-ing,” inProc. Int. Conf. on Image Processing (ICIP‘99), Vol. 2, pp. 226–230 (1999).
59. V. Saxena, M. Gupta, and D. T. Gupta,“A wavelet-based watermarking scheme for color images,”IUP J. Telecommun.5, 56–66 (2013). 60. F. Huo and X. Gao,“A wavelet based image watermarking scheme,”in
Proc. Int. Conf. on Image Processing (ICIP‘06), 2573–2576 (2006). 61. D. Kundur and D. Hatzinakos,“Digital watermarking using multireso-lution wavelet decomposition,”inProc. of the 1998 IEEE Int. Conf. on Acoustics, Speech and Signal Processing, Vol. 5, pp. 2969–2972 (1998).
62. V. S. Verma and J. R. Kumar,“Improved watermarking technique based on significant difference of lifting wavelet coefficients,”Signal Image Video Process.9(6), 1443–1450 (2015).
63. P. Meerwald, “Quantization watermarking in the JPEG2000 coding pipeline,” in Proc. Int. Working Conf. on Communications and Multimedia Security, pp. 69–79 (2001).
64. D. Aggarwal and K. S. Dhindsa,“Effect of embedding watermark on compression of the digital images,”Comput. Res. Repository1002,5–8 (2010).https://arxiv.org/abs/1002.3984
65. K. Fukuchi et al.,“Saliency-based video segmentation with graph cuts and sequentially updated priors,” in Proc. IEEE Int. Conf. on Multimedia and Expo, pp. 638–641 (2009).
66. X. Hou and L. Zhang,“Dynamic visual attention: searching for coding length increments,” in Advances in Neural Information Processing Systems, pp. 681–688 (2008).
67. M. Oakes and C. Abhayaratne,“Global Motion Compensated Video Saliency Estimation,”(accessed 15 Oct 2016).
68. H. Schwarz, D. Marpe, and T. Wiegand,“Overview of the scalable video coding extension of the H.264/AVC standard,” IEEE Trans. Circuits Syst. Video Technol.17(9), 1103–1120 (2007).
69. Z. Wang et al.,“Image quality assessment: from error visibility to struc-tural similarity,”IEEE Trans. Image Process.13, 600–612 (2004). 70. A. B. Watson, “Visual optimization of dct quantization matrices
for individual images,” in American Institute of Aeronautics and Astronautics (AIAA), Vol. 9, pp. 286–291 (1993).
71. A. B. Watson, J. Hu, and J. F. McGowan III,“DVQ: a digital video quality metric based on human vision,” J. Electron. Imaging 10, 20–29 (2001).
Matthew Oakesgraduated with an MEng degree in electronic and electrical engineering from the University of Sheffield in 2009. He received his PhD in electronic and electrical engineering also at the University of Sheffield in 2014. He is currently working at the University of Buckingham as a knowledge transfer partnership asso-ciate. His main expertise lies in image/video processing, compres-sion, digital watermarking, and visual saliency estimation. His current research includes biometric security systems and machine learning.
Deepayan Bhowmikreceived his PhD in electronic and electrical engineering from the University of Sheffield, UK, in 2011. Previously, he worked as a research associate at Heriot-Watt University, Edinburgh, UK and the University of Sheffield, UK, and a system engineer in ABB Ltd., India. He is currently working as a lecturer in Sheffield Hallam University, Sheffield, UK. His current research interests include computer vision, machine learning, embedded imaging hardware on FPGA, and multimedia security.
Charith Abhayaratnereceived his BE degree in electrical and elec-tronic engineering from the University of Adelaide, Australia, in 1998, and his PhD in the same from the University of Bath, UK, in 2002. He is currently a lecturer in the Department of Electronic and Electrical Engineering at the University of Sheffield, UK. His research interests include video and image compression, watermarking, image and video analysis, multidimensional signal processing, graph spectral analysis, and computer vision.