D
EVELOPMENT OF
D
ISASTER
R
ISK
I
NDICATORS
AND
F
LOOD
R
ISK
E
VALUATION
Operation ATN/OC-11718-GY
GUYANA
I
NDICATORS OFD
ISASTERR
ISK ANDR
ISKM
ANAGEMENTPrepared for:
THE
CIVIL
DEFENCE
COMMISSION
Inter-American Development Bank
July 2012
ERN
Evaluación de Riesgos Naturales
América Latina
-Consultores en Riesgos y Desastres
Consortium of consultants: Colombia Carrera 19A # 84-14 Of 504 Edificio Torrenova Tel. 57-1-691-6113 Fax 57-1-691-6102 Bogotá, D.C. INGENIAR España
Centro Internacional de Métodos Numéricos en Ingeniería - CIMNE
Campus Nord UPC Tel. 34-93-401-64-96 Fax 34-93-401-10-48 Barcelona C I M N E México
Vito Alessio Robles No. 179
Col. Hacienda de Guadalupe Chimalistac C.P.01050 Delegación Álvaro Obregón Tel. 55-5-616-8161
Fax 55-5-616-8162
México, D.F. ERN Ingenieros Consultores, S. C.
ERN Evaluación de Riesgos Naturales – América Latina www.ern-la.com
Direction and Co-ordination of Technical Working Groups – ERN Latin-America Consortium
Omar D. Cardona
General Project Direction
Luis E. Yamín
Technical Direction ERN (COL)
Mario G. Ordaz
Technical Direction ERN (MEX)
Alex H. Barbat
Technical Direction CIMNE (SPN)
Gabriel A. Bernal
General Co-ordination ERN (COL)
Eduardo Reinoso
General Co-ordination ERN (MEX)
Martha-Liliana Carreño
General Co-ordination CIMNE (SPN)
Specialists and Advisors – Working Groups Julián A. Tristancho O.
Specialist ERN-AL (COL)
Carlos E. Avelar
Specialist ERN-AL (MEX)
Mabel-Cristina Marulanda
Specialist CIMNE(SPN)
Mario A. Salgado G.
Specialist ERN-AL (COL)
Benjamín Huerta
Specialist ERN-AL (MEX)
Jairo A. Valcarcel
Specialist CIMNE(SPN)
César A. Velásquez
Specialist ERN-AL (COL)
Mauro P. Niño
Specialist ERN-AL (MEX)
Juan P. Londoño
Specialist CIMNE(SPN)
Miguel G. Mora
Specialist ERN-AL (COL)
Isaías Martínez
Technical Assistant ERN-AL (MEX)
Nieves Lantada
Specialist CIMNE(SPN)
Karina Santamaría
Specialist ERN-AL (COL)
Edgar Osuna
Technical Assistant ERN-AL (MEX)
Álvaro M. Moreno
Associated Adviser (COL)
Juan C. Olaya
Technical Assistant ERN-AL (COL)
José J. Hernández
Technical Assistant ERN-AL (MEX)
Mario Díaz-Granados
Associated Adviser (COL)
Daniela Zuloaga R.
Technical Assistant ERN-AL (COL)
Diana M. González
Technical Assistant ERN-AL (COL)
Marco Torres
T
ABLE OFC
ONTENTSINTRODUCTION 1
1 NATIONAL CONTEXT 4
2 NATURAL HAZARDS 5
3 INDICATORS OF DISASTER RISK AND RISK MANAGEMENT 6
3.1 Disaster Deficit Index (DDI) 6
3.1.1 Reference parameters for the model 7
3.2 Estimation of the indicators 8
3.3 Local Disaster Index (LDI) 12
3.4 Prevalent Vulnerability Index (PVI) 16
3.4.1 Indicators of exposure and susceptibility 16
3.4.2 Indicators of socio-economic fragility 16
3.4.3 Indicators of resilience (lack of) 17
3.4.4 Estimation of indicators 18
3.5 Risk Management Index (RMI) 21
3.5.1 Institutional Organization 22
3.5.2 Indicators of risk identification 25
3.5.3 Indicators of risk reduction 25
3.5.4 Indicators of disaster management 26
3.5.5 Indicators of governance and financial protection 26
3.5.6 Estimation of Indicators 27
4 CONCLUSIONS 32
5 BIBLIOGRAPHY 32
I
NTRODUCTIONDisaster risk is not only associated with the occurrence of intense physical phenomena but also with the vulnerability conditions that favour or facilitate disasters when such phenomena occur. Vulnerability is intimately related to social processes in disaster-prone areas, and is usually related to the fragility, susceptibility, or lack of resilience in the population when faced with different hazards. In other words, disasters are socio-environmental by nature, and their materialization is the result of the social construction of risk. Therefore, their reduction must be part of decision-making processes. This is the case not only with post-disaster reconstruction, but also with public policy formulation and development planning. Due to this, institutional development must be strengthened and investment in vulnerability reduction stimulated in order to contribute to the sustainable development process in different countries.
In order to improve disaster risk understanding and disaster risk management performance, a transparent, representative, and robust System of Indicators, easily understood by public policymakers, relatively easy to update periodically, and which allow cluster and comparison between countries was developed by the Institute of Environmental Studies (IDEA in Spanish) of the National University of Colombia, Manizales. This System of Indicators was designed between 2003 and 2005 with the support of the Operation ATN/JF-7906/07-RG “Information and Indicators Program for Disaster Risk Management” of the Inter-American Development Bank (IDB).
This System of Indicators has three specific objectives: i) improvement in the use and presentation of information on risk. This assists policymakers in identifying investment priorities to reduce risk (such as prevention and mitigation measures), and directs the post-disaster recovery process; ii) to provide a way to measure key elements of vulnerability for countries facing natural phenomena. It also provides a way to identify national risk management capacities, as well as comparative data for evaluating the effects of policies and investments on risk management; and iii) application of this methodology should promote the exchange of technical information for public policy formulation and risk management programmes throughout the region. The System of Indicators was developed to be useful not only for the countries but also for the Bank, facilitating both the individual monitoring of each country and the comparison between the countries of the region.
The first phase of the Program of Indicators IDB-IDEA involved the methodological development, the formulation of the indicators, and the evaluation of twelve countries from 1985 to 2000. Subsequently, two additional countries were evaluated with the support of the IDB’s Regional Policy Dialogue on Natural Disasters. In 2008, a methodological review and the updating of the indicators for twelve countries were conducted in the framework of the Operation RG-T1579/ATN/MD-11238-RG. Indicators were updated to 2005, or for the most recent date according to the available information (2007 or 2008) for Argentina, Bolivia, Chile, Colombia, Costa Rica, Dominican Republic, Ecuador, Jamaica,
Mexico, Peru, and Trinidad and Tobago1. In addition, Barbados and Panama were included in the programme. Subsequently, in the framework of other operations of the IDB, other evaluations of the System of Indicators have been made for Belize, El Salvador, Guatemala, Guyana, Honduras, and Nicaragua. This report has been made using the methodologies formulated in the Program of Indicators IDB-IDEA,2 with some adjustments which are referenced in the description of each indicator.
The System of Indicators mentioned above attempts to facilitate access by national decision-makers to relevant information on a country’s vulnerability and risk, through the use of relative indicators to help the identification and proposal of effective disaster risk management policies and actions. The underlying models attempt to represent risk and risk management schemes at a national scale, allowing the identification of their essential economic and social characteristics, and a comparison of these aspects and the risk context in different countries.
The proposed System of Indicators allows disaster risk and risk management evaluation and benchmarking of each country in different time periods. It assists in advancing a more analytically rigorous and data-driven approach to risk management decision-making. This measurement approach enables:
Representation of disaster risk at the national level, allowing for the identification of key issues relating to their characterization from an economic and social point of view.
Risk management performance benchmarking of different countries to determine performance targets for improving management effectiveness.
Due to a lack of parameters, the need to suggest some qualitative indicators measured on subjective scales is unavoidable. This is the case with risk management indicators. The weighting of some indices has been undertaken using expert opinion at the national level. Analysis has been achieved using numerical techniques that are consistent from the theoretical and statistical perspectives.
Four components or composite indicators reflect the principal elements that represent vulnerability and show the advance of different countries in risk management. This is achieved in the following way:
1. The Disaster Deficit Index, DDI, measures country risk from a macro-economic and financial perspective when faced with possible catastrophic events. This requires an estimation of critical impacts during a given exposure time, and of the capacity of the country to face up to this situation financially.
1Usually, the most recent values in the different databases are not definitive since they are subject to change, thus, the last considered year (which is different for each indicator) is in some cases tentative or preliminary.
2
More information and details of methodologies can be found in Cardona (2005). “System of Indicators of Disaster Risk and Risk Management: Main Technical Report”. Program of Indicators for Disaster Risk and Risk Management IDB – IDEA, Universidad Nacional de Colombia, Manizales. http://idea.unalmzl.edu.co
2. The Local Disaster Index, LDI, identifies the social and environmental risks that derive from more recurrent lower level events, which are often chronic at the local and sub-national levels. These events particularly affect the more socially and economically fragile population and generate a highly damaging impact on the country’s development.
3. The Prevalent Vulnerability Index, PVI, is made up of a series of indicators that characterize prevailing vulnerability conditions reflected in exposure in prone areas, socioeconomic fragility, and lack of resilience in general.
4. The Risk Management Index, RMI, brings together a group of indicators related to the risk management performance of the country. These reflect the organizational, development, capacity and institutional action taken to reduce vulnerability and losses, to prepare for crisis, and to efficiently recover.
In this way, the System of Indicators covers different aspects of the risk and takes into account aspects such as: potential damage and loss due to the probability of extreme events; recurrent disasters or losses; socio-environmental conditions that facilitate disasters; capacity for macroeconomic recovery; behaviour of key services; institutional capacity and the effectiveness of basic risk management instruments such as risk identification, prevention and mitigation measures, financial mechanisms and risk transfer; emergency response levels; and preparedness and recovery capacity (Cardona 2008). Each index has a number of variables that are associated with it and are empirically measured. The choice of variables was driven by a consideration of a number of factors including: country coverage, the soundness of the data, direct relevance to the phenomenon that the indicators are intended to measure, and quality. Wherever possible, direct measurement of the phenomena that are being captured are sought; however, in some cases proxies3 have to be employed. In general, variables with extensive country coverage are sought, but in some cases the use of variables with narrower coverage are necessary in order to measure critical aspects of risk that would otherwise be overlooked.
This report presents the results for Guyana; methodological explanations will not be found because these were not within the scope of this report. Detailed information relating to the methodology of the System of Indicators can be found at: http://idea.unalmzl.edu.co, where details on conceptual framework, methodological support, data treatment and statistical techniques used in the modelling are presented (Cardona et al 2003a/b; 2004 a/b).
3
Due to the lack of detailed information for coarse grain results, alternative values of related data are used to reflect, indirectly, the desired information.
S
YSTEM OFI
NDICATORS FORG
UYANA1 NATIONAL CONTEXT
Guyana is a sovereign state on the northern coast of South America, with an area of 214,970 km2. It is the third-smallest (independent) state on the mainland of South America. It is bordered to the east by Suriname, to the south by Brazil, to the west by Venezuela, and to the north by the Atlantic Ocean. Guyana is subject to Atlantic swells on a year-round basis, heavy seasonal rainfall, and high humidity.
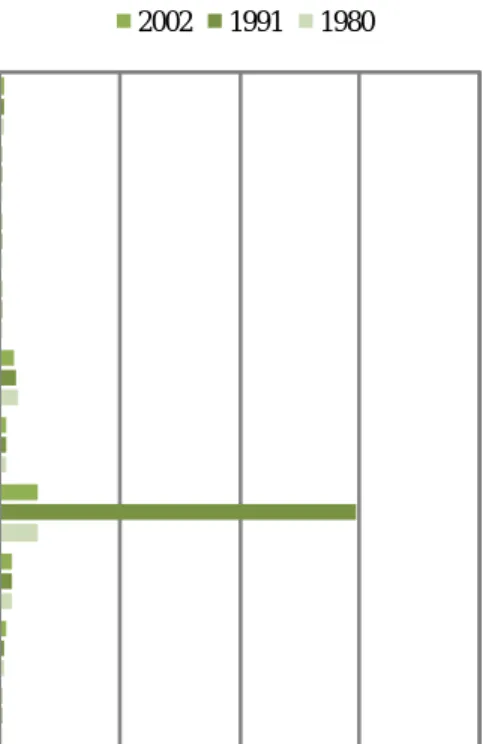
The country is divided into ten regions, from an administrative rather than geographical perspective, each having varying levels of population and development (Figure 1). The most populous of these is Region 4 (310,320 people), which includes the capital, while the least populated is Region 8 (with 10,095 people). The most recent census data of 2002 estimates the population of Guyana at 751,223. Close to 90% of the country’s population live within a relatively narrow strip of land (approximately 25 km wide), which though it only comprises 5% of the land area, is the administrative, agricultural, commercial and industrial centre of the country. Figure 1 presents an estimate of population for the different regions, and their variation since 1980.
Figure 1. Population by regions (Source: Bureau of Statistics, Guyana4)
4 http://www.statisticsguyana.gov.gy 0 100 200 300 400 Region 1 Region 2 Region 3 Region 4 Region 5 Region 6 Region 7 Region 8 Region 9 Region 10 x 10000 Population 2002 1991 1980
Regarding its economy, the GDP of Guyana was US$1.6 billion in 2008; its growth rate was 5.4% and 3% in 2007 and 2008 respectively. In this period, current account and trade balance was in a deficit near to 12% and 15% of GDP respectively. The inflation rate was over 8% in 2008 but decreased to 4.4 in 2010, and the unemployment rate was 11.7% (2002). The gross capital formation as proportion of GDP rose since 2000 and was closer to 40% in 2008. The exchange rate in 2010 was 202 Guyanese Dollars (GYD) per United States dollar. Table 1 presents a summary of the macroeconomic variables of the country. With regard to the social characteristics, the illiteracy rate of the population over 15 years old was around 8.2% in 2002. The number of hospital beds per one thousand inhabitants was 2 in 2002.
Table 1. Main macroeconomic and social indicators
Indicator 2000 2005 2008
GDP (USD million) ** 824.88 1,159.24
Trade balance (% GDP) -11.5 -12.13 -15.33
Total debt service (% Exports and income) ** 4.9 2.6
Unemployment (%) ** 11.7 **
Human Development Index 0.552 0.585 0.611*
Sources: The World Bank, ECLAC
*
Data of 2010
**
No data available
2 NATURAL HAZARDS
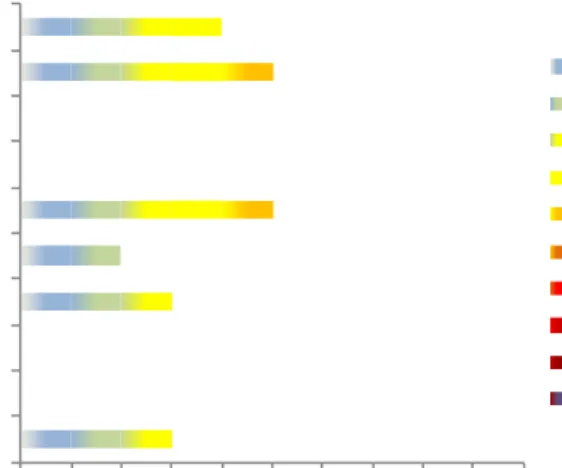
Figure 2 presents the classification by mortality risk established by the International Strategy for Disaster Reduction, ISDR. These figures illustrate the events that can be considered as triggers for the estimation of the Disaster Deficit Index, IDD. Other frequent and isolated phenomena such as landslides and floods, that are less visible at the national level, are causes of recurrent effects at the local level, and may have an important accumulative impact. These kinds of phenomena are considered for the estimation of the Local Disaster Index. Appendix I presents a general description of the country’s hazards. The most significant natural hazards for the country are floods which would cause the major losses in the future in Guyana. There are other natural phenomena that have a lower probability of affecting the country, such as hail storms, storm surges, and lightning. However, these hazard events are able to result in significant local damage. This information is especially important for the estimation of the Disaster Deficit Index, DDI. On the other hand, most recurrent and isolated phenomena such as landslides causes frequent effects at the local level that are not easily noticed at national level. These events also have also great impacts on population, and, if they are accumulative, can be important too.
0 1 2 3 4 5 6 7 8 9 10 Multiple morta lity (a bsolute)
Cyclones (a bsolute) Ea rthqua kes (a bsolute) Floods (a bsolute) La ndslides (a bsolute) Multiple morta lity (rela tive) Cyclones (rela tive) Ea rthqua kes (rela tive) Floods (rela tive) La ndslides (rela tive)
Unknown Very Low Low Medium Low Medium Medium High High Very High Important Extreme
Figure 2. Classification by mortality risk (Source ISDR 2009)
The mortality risk index established by the International Strategy for Disaster Reduction - ISDR, is based on hazard modelling (tropical cyclones, flooding, earthquakes and landslides), taking into account the frequency and severity of the hazard events, the human exposure, and the vulnerability identification. The absolute mortality risk index refers to the average of deaths per year; the relative mortality risk index refers to the average of deaths in proportion to the national population. Low indices of 1 mean low mortality risk with 10 as the maximum value meaning high mortality risk. According to Figure 2, relative values indicate that mortality risk is concentrated at medium-high due to floods, while landslides are at a medium-low level. Likewise, the absolute mortality risk shows that floods are classified as medium-low and landslides as very low concentrated.
3 INDICATORS OF DISASTER RISK AND RISK MANAGEMENT
A summary of the results obtained from the System of Indicators application for Guyana for the period 2001-2005 and for the last available year in the databases is presented in this section. These results are useful in order to analyze risk and risk management performance in the country, based on information supplied by different national institutions.
3.1 DISASTER DEFICIT INDEX (DDI)
The DDI measures the economic loss that a particular country could suffer when a catastrophic event takes place, and the implications in terms of the resources that would be needed to address the situation. This index captures the relationship between the demand for contingent resources to cover the losses caused by the Maximum Considered Event (MCE) that the public sector must assume as result of its fiscal responsibility, and this sector’s economic resilience (ER).
Losses caused by the MCE are calculated with a model that takes into account, on the one hand, different natural hazards, - calculated in probabilistic terms according to historical registers of intensities of the phenomena - and, on the other hand, the current physical vulnerability that present the exposed elements to those phenomena. The ER is obtained from
the estimation of the possible internal or external funds that government, as the entity responsible for recovery or as owner of the affected goods, may access or has available at the time of the evaluation.
A DDI greater than 1.0 reflects the country’s inability to cope with extreme disasters, even by taking as much debt as possible. The greater the DDI, the greater the gap. An estimation of a complementary indicator, DDI’CE is therefore made, to illustrate the portion of a
country’s annual Capital Expenditure that corresponds to the expected annual loss or the pure risk premium; i.e. what percentage of the annual investment budget would be needed to pay for future disasters (IDEA 2005; Cardona 2005). The DDI’IS is also estimated with
respect to the amount of sustainable resources due to intertemporal surplus; i.e. the saving which the government can employ, calculated over a ten-year period, in order to best attend to the impacts of disasters. The DDI’IS is the percentage of a country’s potential savings at
present values that corresponds to the pure risk premium.
3.1.1 Reference parameters for the model
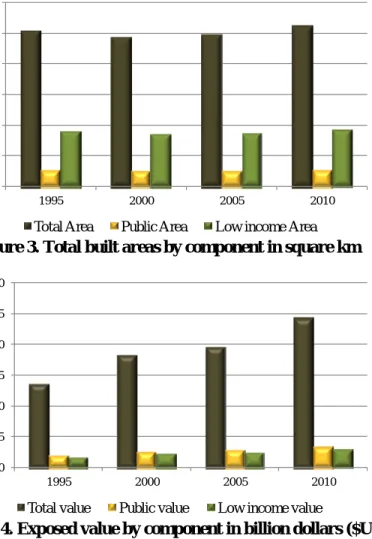
Even though there is no detailed data useful for modelling public and private sector inventories, it is possible to use general information about built areas and/or the population to make estimations of these inventories of exposed elements. This technique or proxy method allows a coarse grain assessment of the volume and cost of the exposed elements required for the analysis. The parameters for shaping a homogeneous and consistent information structure for the specific objectives of the project are shown in Figures 3 and 4: (i) cost of square metre of some construction classes, (ii) built area –in each city related to the number of inhabitants– and (iii) distribution of built areas in basic groups for analysis, such as the public and private components, which would be under the charge of or would be fiscal liabilities of the government in case of disaster. In addition, the rest of private goods, that constitute capital stocks, are considered as well in order to provide a general view of the potential impact in the country.
Figure 3 shows estimations of built areas in different components and its variations in time (from 2000 to 2010). Figure 4 presents a similar graphic related to the exposed values of the whole country. The techniques used for a country’s exposure estimation, vulnerability and hazard assessment and risk models are explained in Ordaz & Yamin (2004) and Velasquez (2009). These technical explanations are available at http://idea.unalmzl.edu.co.
0 1 2 3 4 5 6 1995 2000 2005 2010 A rea ( k m 2)
Total Area Public Area Low income Area Figure 3. Total built areas by component in square km
0.0 0.5 1.0 1.5 2.0 2.5 3.0 1995 2000 2005 2010 E x po se d v a lue ( U SD b il li o ns )
Total value Public value Low income value
Figure 4. Exposed value by component in billion dollars ($US)
The values of the built areas include (i) total value (public and private built areas), (ii) public value (the buildings of the government and public infrastructure) and (iii) low income value (buildings of the low-income socio-economic homeowners). The properties mentioned above usually are the sovereign or fiscal liabilities.
3.2 Estimation of the indicators
Table 2 shows DDI for 2000, 2005, and 2010 for the Maximum Considered Event (MCE) of 50, 100 and 500 years of return period.5 In addition, DDI for 2010 for the direct Probable Maximum Losses is included (from the Flood Risk Assessment Report; dam-break case study).
Table 2. DDI for different return periods
DDI 2000 2005 2010 2010 (FRA) DDI50 1.47 1.37 0.75 0.57 DDI100 2.06 1.92 1.09 0.63 DDI500 2.57 2.41 1.40 0.78 5
For extreme events with return periods of 500, 100 and 50 years in all periods the DDI is greater than 1.0; this means the country does not have enough resources to cover losses and/or feasible financial capacity to face losses and replace the capital stock affected. Table 3 shows DDI’ values, which corresponds to annual expected loss related to capital expenditure (annual investment budget), and related to possible savings for intertemporal surplus to 10 years, expressed in percentages. DDICE illustrates that if contingent liabilities
to the country were covered by insurance (annual pure premium), the country would have to invest annually 3.7% of 2010’s capital expenditure to cover future disasters. The DDIIS,
with respect to the amount of sustainable resources due to intertemporal surplus, indicates that for all the periods evaluated savings were negative; that is, annual pure premium value would increase the deficit.
Table 3. DDI’ related to capital expenditure and intertemporal surplus
DDI' 2000 2005 2010 2010 (FRA)
DDICE 7.9% 7.2% 3.7% 2.9%
DDIIS ^D ^D ^D ^D
^D: negative values of intertemporal surplus or lower intertemporal surplus values than the expected annual loss, therefore deficit increasing
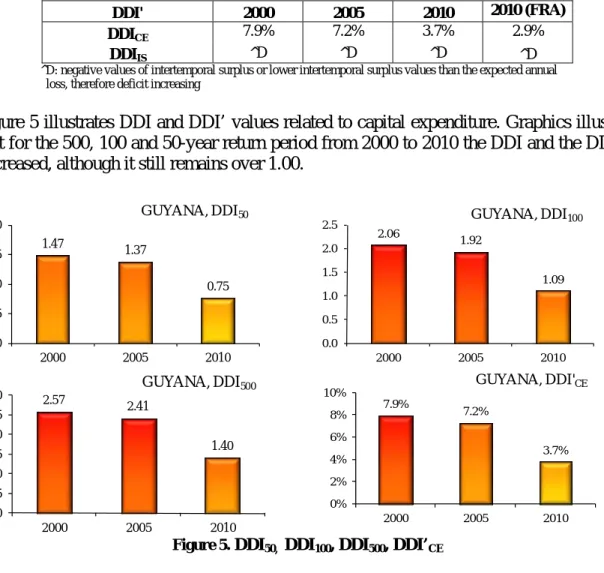
Figure 5 illustrates DDI and DDI’ values related to capital expenditure. Graphics illustrate that for the 500, 100 and 50-year return period from 2000 to 2010 the DDI and the DDI’CE
decreased, although it still remains over 1.00.
1.47 1.37 0.75 0.0 0.5 1.0 1.5 2.0 2000 2005 2010 GUYANA, DDI50 2.06 1.92 1.09 0.0 0.5 1.0 1.5 2.0 2.5 2000 2005 2010 GUYANA, DDI100 2.57 2.41 1.40 0.0 0.5 1.0 1.5 2.0 2.5 3.0 2000 2005 2010 GUYANA, DDI500 7.9% 7.2% 3.7% 0% 2% 4% 6% 8% 10% 2000 2005 2010 GUYANA, DDI'CE
Figure 5. DDI50, DDI100, DDI500, DDI’CE
Table 4 shows the values of the potential losses for the country for the Maximum Considered Event, MCE, with 50, 100 and 500-year return periods. This estimation took into account in retrospective the exposure level of the country for 2000, 2005, and 2010. In
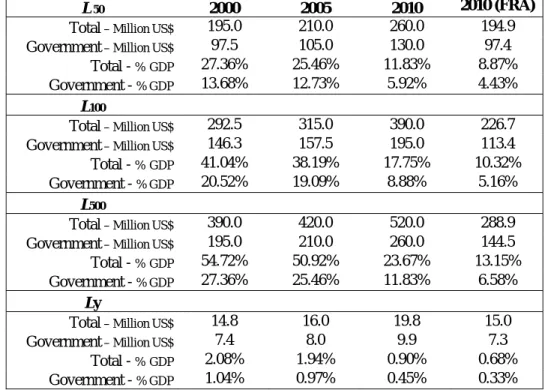
addition, Table 4 presents the values of the pure premium or the required annual amount to cover possible future disasters in each period. The DDI and DDI’ for the three years of analysis were calculated based on the estimates of the potential maximum losses and expected annual losses respectively (i.e. the numerator of the indicators). The value of losses, obtained for 2010 from the Flood Risk Assessment (FRA) report, is lower because these are direct physical losses (see the figures of the dam-break case study).
These indicators can be estimated every five years and they can be useful in identifying the reduction or increase of the potential deficit due to disasters. Clearly, values of DDI can be more favourable in the future if actions such as investments in mitigation (retrofitting of vulnerable structures), which can reduce potential losses, and a wider insurance coverage of exposed elements, which can enhance economic resilience, are carried out.
Table 4. Probable loss and pure premium for DDI and DDI’ calculations
L 50 2000 2005 2010 2010 (FRA)
Total – Million US$ 195.0 210.0 260.0 194.9
Government – Million US$ 97.5 105.0 130.0 97.4
Total - %GDP 27.36% 25.46% 11.83% 8.87%
Government - % GDP 13.68% 12.73% 5.92% 4.43%
L100
Total – Million US$ 292.5 315.0 390.0 226.7
Government – Million US$ 146.3 157.5 195.0 113.4
Total - %GDP 41.04% 38.19% 17.75% 10.32%
Government - % GDP 20.52% 19.09% 8.88% 5.16%
L500
Total – Million US$ 390.0 420.0 520.0 288.9
Government – Million US$ 195.0 210.0 260.0 144.5
Total - %GDP 54.72% 50.92% 23.67% 13.15%
Government - % GDP 27.36% 25.46% 11.83% 6.58%
Ly
Total – Million US$ 14.8 16.0 19.8 15.0
Government – Million US$ 7.4 8.0 9.9 7.3
Total - %GDP 2.08% 1.94% 0.90% 0.68%
Government - % GDP 1.04% 0.97% 0.45% 0.33%
Table 5 presents possible internal and external funds that the government needs to access at the time of the evaluation to face the losses in case of an extreme disaster. The sum of these available or usable possible funds corresponds to the economic resilience between 2000 and 2010, for every five years. Based on these estimates (i.e. the denominator of the indicator) the DDI was calculated for the different periods.
Table 5. Economic resilience, funds and resources for DDI calculations Funds 2000 2005 2010 Insurance premiums - % GDP 0.000 0.000 0.000 Insurance/ reinsurance.50 -F1p 0.00 0.00 0.00 Insurance/ reinsurance.100 -F1p 0.00 0.00 0.00 Insurance/ reinsurance.500 -F1p 0.00 0.00 0.00 Disaster reserves -F2p 0.00 0.00 0.00 Aid/donations.50 -F3p 9.75 10.50 13.00 Aid/donations.100 -F3p 14.63 15.75 19.50 Aid/donations.500 -F3p 19.50 21.00 26.00 New taxes -F4p 0.00 0.00 0.00 Capital expenditure - % GDP 13.18 13.36 12.08 Budgetary reallocations. -F5p 56.36 66.12 159.24 External credit. -F6p 0.00 0.00 0.00 Internal credit -F7p 0.00 0.00 0.00 Intertemp surplus. d*- % GDP -0.180 -0.120 -0.080 Intertemp surplus. -F8p -1.3 -1.0 -$ 2 RE.50
Total - Million US$ 66 77 172
Total - %GDP 9.28% 9.29% 7.84%
RE.100
Total - Million US$ 71 82 179
Total - %GDP 9.96% 9.93% 8.14%
RE.500
Total - Million US$ 76 87 185
Total - %GDP 10.64% 10.56% 8.43%
DDI for 2010 was calculated based on the most recent available information on exposed elements. According to the available statistical information and the estimations of the consultant group, built areas and their physical values were established. Regarding economic resilience (denominator of the index), this was estimated in terms of GDP for each fund, taking as reference the economic information that was available.
Reduction in DDI values in 2005 and 2010 demonstrates that the country has improved its economic resilience. Nevertheless, given that most of the resources to which the government could have access are its own funds and new debt, and, additionally, that government retains the majority of the losses and its financing represents high opportunity-cost, given other needs of investment and the country’s other existing budget restrictions, disasters would imply an obligation or non-explicit contingent liability that could have an impact on fiscal sustainability.
3.3 LOCAL DISASTER INDEX (LDI)
The LDI captures simultaneously the incidence and uniformity of the distribution of local disaster effects; i.e. it accounts for the relative weight and persistence of the disaster effects at regional scale. The total LDI is obtained by the sum of three LDIs that are calculated based on the information available in the DesInventar database,6 regarding deaths, affected people, and economic losses in each region of the country. If the relative value of the index is high, the uniformity of the magnitude and the distribution of the effects of various hazards among regions is greater. A low LDI value means low spatial distribution of the effects among the regions where the events have occurred. The scale used for each LDI is from 0 to 100 and the total LDI is the sum of the three components. A low LDI value (0-20) means high concentration of small disasters in few regions and a low spatial distribution of their effects between the regions where they had taken place. Medium LDI values (20-50) means small disaster concentration and distribution of their effects are intermediate; high LDI values (greater than 50) indicate that the majority of regions suffer small disasters and their effects are similar in all affected regions. High values reflect that vulnerability and hazards are more wide-spread across the territory. Original methodological formulation of the LDI (IDEA 2005) encompassed the effects of all the events (both small and big) occurring in the country; i.e. effects both of small and frequent events and extreme and rare events. However, during the first evaluation made in 2005, it was realized that reflecting the influence of extreme events was not the objective of this indicator. Therefore all further evaluations would take into account only the small and moderate events, as is the case for the Guyana evaluation here. Thus, this updating of the methodology excluded extreme events from the database through statistical identification of outliers (Marulanda and Cardona 2006).
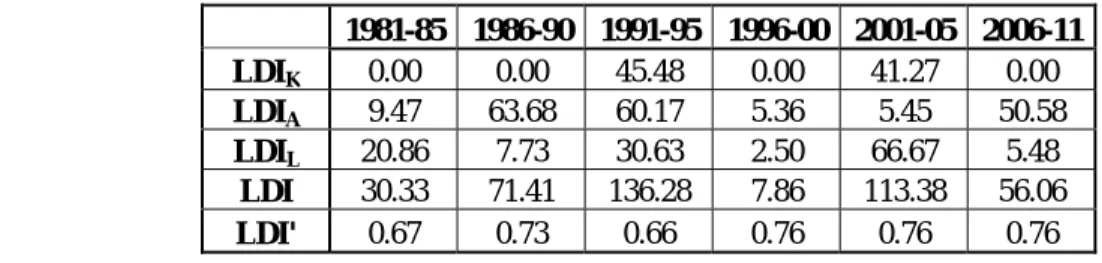
The LDI’ that measures the concentration of aggregate losses at regional level has been formulated in a complementary way. Its value is between 0.0 and 1.0. A high LDI’ value means that a high economic-losses concentration due to small disasters has occurred, but in few regions. For example, an LDI’ equal to 0.43 and 0.79 means that approximately 10% of regions of the country will have a concentration of approximately 35% and 70% of the losses respectively. Table 6 shows LDI for deaths, affected people, and losses, as well as total LDI and LDI’ for all the events that took place in the country in the periods 1981-1985, 1986-1990, 1991-1995, 1996-2000, 2001-2005, and 2006-2011. Details of these above-mentioned technical issues are available in the Main Technical Report of the System of Indicators (IDEA 2005).
Table 6. LDI values
1981-85 1986-90 1991-95 1996-00 2001-05 2006-11 LDIK 0.00 0.00 45.48 0.00 41.27 0.00 LDIA 9.47 63.68 60.17 5.36 5.45 50.58 LDIL 20.86 7.73 30.63 2.50 66.67 5.48 LDI 30.33 71.41 136.28 7.86 113.38 56.06 LDI' 0.67 0.73 0.66 0.76 0.76 0.76 6
The DesInventardatabase was developed in 1994 by the Network for Social Studies in Disaster Prevention in Latin America. http://www.desinventar.org
0.00 0.00 45.48 0.00 41.27 0.00 0 20 40 60 80 100 81-85 86-90 91-95 96-00 01-05 06-11 LDI (K) GUYANA 9.47 63.68 60.17 5.36 5.45 50.58 0 20 40 60 80 100 81-85 86-90 91-95 96-00 01-05 06-11
LDI (A) GUYANA
20.86 7.73 30.63 2.50 66.67 5.48 0 20 40 60 80 100 81-85 86-90 91-95 96-00 01-05 06-11 LDI (L) GUYANA 0.67 0.73 0.66 0.76 0.76 0.76 0.00 0.20 0.40 0.60 0.80 1.00 81-85 86-90 91-95 96-00 01-05 06-11 LDI' GUYANA
Figure 6. LDI for deaths (K), affected people (A) and losses (L), and LDI’
Figure 6 illustrates LDI values, according to the type of effects in different periods. The LDI for deaths between the period 1991-1995 and 2001-2005 indicates that low-scale disasters caused deaths in a more regular way in the territory. During the other periods it shows that no deaths occurred due to small or moderate disasters. Regarding the LDI for affected persons, the periods 1986-1990, 1991-1995, and 2006-2011 showed a more regular and uniform effect across the territory, while for the other periods effects were more concentrated in only some regions of the country. In the case of the LDI of economic losses the only period that presented a more uniform behaviour across regions was the period 2001-2005. The economic losses in the other periods were more concentrated in only a few regions of the country. The results of the LDI’ show medium-high values which mean the concentration of the economic losses are not very well distributed within the country.
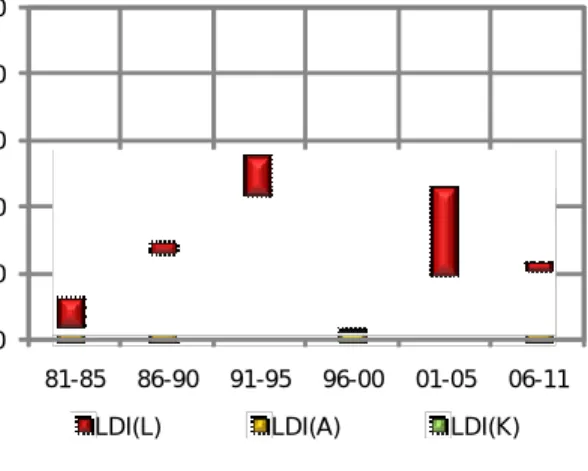
Figure 7. Total LDI and aggregated presentation
In general, as the LDI illustrates in Figure 7, low-scale disasters caused more regular and distributed effects between all regions of the country at the beginning of the 1990s and beginning of 2000 than in the 1980s, and especially in the period 1996-2000. At the end of the 1990s this regularity decreased, i.e. effects became more concentrated.
Table 7 shows the numbers of total deaths, total affected persons and total economic losses in US dollars for the four periods evaluated.
Table 7. Total of deaths, affected persons and losses
1981-85 1986-90 1991-95 1996-00 2001-05 2006-11
Total deaths 1 3 5 3 15 1
Total affected persons 468 717 2,492 6,063 5,777 810
Total losses (USD) 1,067,521 115,987 79,090 714,546 319,232 67,331
Figure 8 shows these values to illustrate changes from one period to another. Deaths were less in 1990s as compared to the 2001-2005 period whereas the economic losses were very high in the 1981-1985 period, and high for the period 1996-2000. The numbers of affected persons were high for 1990s and for the period 2001-2005. Taking into account the results of the LDIL and the LDI’ for this period, it can be seen that the economic losses were very
concentrated, either spatially or by type of event. 30.33 71.41 136.28 7.86 113.38 56.06 0 50 100 150 200 250 81-85 86-90 91-95 96-00 01-05 06-11 LDI GUYANA 0 50 100 150 200 250 81-85 86-90 91-95 96-00 01-05 06-11 LDI GUYANA
1 3 5 3 15 1 0 2 4 6 8 10 12 14 16 81-85 86-90 91-95 96-00 01-05 06-11 DEATHS 468 717 2,492 6,063 5,777 810 0 1000 2000 3000 4000 5000 6000 7000 81-85 86-90 91-95 96-00 01-05 06-11 AFFECTED PEOPLE 107 12 8 71 32 7 0 20 40 60 80 100 120 81-85 86-90 91-95 96-00 01-05 06-11
ECONOMIC LOSSES (x 10000 USD)
Figure 8. Total deaths, affected people and losses
It should be taken into account that the LDI has been built based on the effects presented in different types of events. Nonetheless, it is important to indicate that the LDI is a measure that combines persistence, incidence, and regularity of events on a territorial level. This is the reason why in order to determine the index, values have been normalized using the area of the regions.
These indices are useful for economic analysts and sectoral officials, related to the promotion of rural and urban policy development, because they can detect the persistency and accumulation of effects of local disasters. They can stimulate the consideration of risk problems in territorial planning at the local level and intervention, as well as the protection of hydrologic basins, and they can justify resource transfers to the local level with the specific goals of risk management and the creation of social security nets.
3.4 PREVALENT VULNERABILITY INDEX (PVI)
PVI characterizes predominating vulnerability conditions reflected in exposure in prone areas, socio-economic fragility, and lack of social resilience; aspects which favour both direct impact and indirect and intangible impact in case of the occurrence of a hazard event. This index is a composite indicator that depicts, comparatively, a situation or pattern in a country, and its causes or factors. This is so to the extent that the vulnerability conditions that underlie the notion of risk are, on the one hand, problems caused by inadequate economic growth and, on the other hand, deficiencies that may be intercepted via adequate development processes. The PVI reflects (i) susceptibility due to the level of physical exposure of goods and people, (the PVIES) that favours direct impact in case of hazard
events); (ii) social and economic conditions that favour indirect and intangible impact, (the PVISF); and (iii) lack of capacity to anticipate, to absorb consequences, to efficiently
respond, and to recover, (the PVILR)(IDEA 2005; Cardona 2005).
The PVI ranges between 0 and 100. A value of 80 means very high vulnerability, from 40 to 80 means high, from 20 to 40 is a medium value, and less than 20 means low.
3.4.1 Indicators of exposure and susceptibility
In the case of exposure and/or physical susceptibility, the PVIES, the indicators that best
represent this function, are those that represent the susceptible population, assets, investment, production, livelihoods, essential patrimony, and human activities. Other indicators of this type may be found in population, agricultural and urban growth, and densification rates. These indicators are detailed below:
ES1. Population growth, avg. annual rate, %
ES2. Urban growth, avg. annual rate, %
ES3. Population density, people (5 km2)
ES4. Poverty-population below US$1 per day PPP
ES5. Capital stock, million US$ dollar/1000 km2
ES6. Imports and exports of goods and services, % GDP
ES7. Gross domestic fixed investment, % of GDP
ES8. Arable land and permanent crops, % land area.
These indicators are variables that reflect a notion of susceptibility when faced with dangerous events, whatever the nature or severity of these. ‘To be exposed and susceptible is a necessary condition for the existence of risk’. Despite the fact that in any strict sense it would be necessary to establish if the exposure is relevant when faced with each feasible type of event, it is also possible to assert that certain variables comprise a comparatively adverse situation where it is posited that natural hazards exist as a permanent external factor, even without precisely establishing their characteristics.
3.4.2 Indicators of socio-economic fragility
Socio-economic fragility, PVISF, may be represented by indicators such as poverty, human
environmental deterioration. These are indicators that reflect relative weaknesses and conditions of deterioration which would increase the direct effects associated with hazardous phenomena. Even though such effects are not necessarily accumulative, and in some cases may be redundant or correlated, their influence is especially important at the social and economic levels. Those indicators are the following:
SF1. Human Poverty Index, HPI-1
SF2. Dependents as proportion of working-age population
SF3. Social disparity, concentration of income measured using the Gini index
SF4. Unemployment, as % of total labour force
SF5. Inflation, food prices, annual %
SF6. Dependency of GDP growth on agriculture, annual %
SF7. Debt servicing, % of GDP.
SF8. Human-induced soil degradation (GLASOD).
These indicators are variables that reflect, in general, an adverse and intrinsic7 predisposition of society to be affected when faced with a hazardous phenomenon, whatever the nature and intensity of these events. ‘The predisposition to be affected’ is a vulnerability condition, although in a strict sense it would be necessary to establish the relevance of this affirmation when faced with all and individual feasible types of hazard. Nevertheless, as is the case with exposure (as reflected by the PVIES), it is possible to
suggest that certain variables reflect a comparatively unfavourable situation, supposing that the natural hazards exist as a permanent external factor, irrespective of their exact characteristics.
3.4.3 Indicators of resilience (lack of)
The lack of resilience, PVILR, seen as a vulnerability factor, may be represented at all levels
by means of the complementary or inverted8 treatment of a number of variables related to human development levels, human capital, economic redistribution, governance, financial protection, collective perceptions, preparedness to face crisis situations, and environmental protection. This collection of indicators on their own, and particularly where they are disaggregated at the local level, could help in the identification and orientation of actions that should be promoted, strengthened, or prioritized in order to increase human security.
LR1. Human Development Index, HDI [Inv]
LR2. Gender-related Development Index, GDI [Inv]
LR3. Social expenditure; on pensions, health, and education, % of GDP [Inv]
LR4. Governance Index (Kaufmann) [Inv]
LR5. Insurance of infrastructure and housing, % of GD [Inv]
LR6. Television sets per 1000 people [Inv]
LR7. Hospital beds per 1000 people [Inv]
7
This is also defined as inherent vulnerability. It means the socio-economic conditions peculiar to the communities which then favour or facilitate the occurrence of such effects.
8
LR8. Environmental Sustainability Index, ESI [Inv]
These indicators are variables that capture in a macro fashion the capacity to recover from or absorb the impact of hazardous phenomena, whatever their nature and severity. ‘To not be in a capacity to’ adequately face disasters is a vulnerability condition, although in a strict sense it is necessary to establish this with reference to all feasible types of hazard. Nevertheless, as with exposure (as reflected by the PVIES) and fragility (as reflected by the
PVISF), it is possible to admit that certain economic and social variables reflect a
comparatively unfavourable situation, from the supposition that natural hazards exist as permanent external factors, without establishing their precise characteristics.
3.4.4 Estimation of indicators
In general, PVI reflects susceptibility due to the degree of physical exposure of goods and people, PVIES, which favour direct impact in case of hazard events. In the same way, it
reflects conditions of socio-economic fragility which favour indirect and intangible impact, PVISF. Also, it reflects lack of capacity to absorb consequences, for efficient response and
recovery, PVILR. Emphasis on these aspects should be made, since the purpose both of the
human sustainable development process and risk management is the reduction of these kinds of factors.
Table 8 shows the total PVI and its components related to exposure and susceptibility, socio-economic fragility, and lack of resilience. It is important to point out that in order to include sub-indicators for which there were no recent figures, the option was made to use the same value in all periods,9 in order to avoid affecting the relative value of indices. Hopefully the value of these sub-indicators will be published in the future.
Therefore, although this evaluation was developed in 2011, the most recent available indicators for Guyana were for 2007, so the presented results correspond to the years 1995, 2000, 2005, and 2007.
Table 8. PVI values
1995 2000 2005 2007
PVIES 26.69 19.78 23.98 25.31
PVISF 38.25 32.36 32.25 32.68
PVILR 49.68 45.03 43.61 43.75
PVI 38.21 32.39 33.28 33.92
Figure 9 shows non-scaled sub-indicator values which compose the PVIES, and their
respective weights, which were obtained using the Analytic Hierarchy Process (AHP).
9
In the case of exposure and susceptibility, the sub-indicator of arable land and permanent crops (ES8) presented the same value from 2000 to 2007. In the socio-economic sub-indicator, fragility corresponded to human-induced soil degradation (GLASOD) (SF8) from 2000 to 2007.
26,69 19,78 23,98 25,31 0 10 20 30 40 50 60 70 80 90 1995 2000 2005 2007 PVIES Figure 9. PVIES
Generally speaking, growth in Prevalent Vulnerability Index (PVI) values indicates, negatively, more vulnerability in a country; decreases in PVI values (positively) indicate a lessening in vulnerability. Vulnerability due to exposure and susceptibility in the country was relatively constant in all periods; there were slight variations in time. The capital stock (ES5) showed an increasing trend towards vulnerability during the years evaluated. In 2000 all the indicators, positively, with the exception of the ES5, decreased their value; this is reflected by the value of the PVIES. Positively, for imports and exports of goods and
services (ES6) as well as for other indicators such as poverty-population (ES4) and the arable land and permanent crops (ES8), the values decreased in 2000, and in the following years they maintained the same values. In general, when the values of the sub-indicators in 1995 and 2007 are compared, it can be seen that four of the eight sub-indicators reduced their values, but in differing degrees. This fluctuation in the sub-indicator values is reflected in the PVIES results. Figure 10 shows non-scaled sub-indicator values which
compose the PVISF, and their respective weights, which were obtained using the Analytic
Hierarchy Process (AHP).
38,25 32,36 32,25 32,68 0 10 20 30 40 50 60 70 80 90 1995 2000 2005 2007 PVISF 1995 2000 2005 2007 WA HP SF.1 11,40 11,40 14,00 14,00 20,91 SF.2 61,72 55,64 57,92 57,26 8,50 SF.3 40,20 40,20 40,20 40,20 16,40 SF.4 12,00 12,00 9,10 9,10 12,52 SF.5 12,21 6,15 6,93 12,30 9,44 SF.6 41,23 31,09 34,60 31,14 9,58 SF.7 45,35 16,20 16,20 16,20 9,63 SF.8 7,21 7,21 7,21 7,21 13,02 Figure 10. PVISF 1995 2000 2005 2007 W AHP ES.1 0,24 -0,01 0,15 -0,02 5,01 ES.2 -0,03 -0,36 -0,13 0,19 12,37 ES.3 19,27 19,21 19,40 19,41 8,99 ES.4 8,10 3,00 3,00 3,00 25,39 ES.5 13,25 14,49 15,11 17,46 12,35 ES.6 213,33 206,77 203,83 154,11 11,71 ES.7 33,23 23,78 32,33 39,93 12,38 ES.8 2,56 2,43 2,29 2,29 11,82
Vulnerability due to socio-economic fragility had no significant changes in the periods evaluated. The PVISF decreased between 1995 and 2000, and then it presented slight
changes. In 2000 the PVISF decreased due to some positive changes in sub-indicators such
as dependents as proportion of working-age population (SF2), inflation (SF5), dependency of GDP growth on agriculture (SF6), and debt servicing (SF7). Social disparity (SF3) and the human-induced soil degradation (SF8) maintained the same value. The total PVISF had
a very slight decrease in 2005. The causes of this positive change were in decreasing of unemployment (SF4), social disparity not increasing (SF3), debt servicing (SF7), and human-induced soil degradation not increasing (SF8), although, negatively, there was growth in other indicators such as the Human Poverty Index (SF1), the dependent population (SF2), inflation (SF5), and the dependency of GDP growth on agriculture (SF6). In 2007, the PVISF had a slight growth, but for the most part the indicators presented the
same values as in 2005.Only inflation (SF5) increased, whereas, positively, the indicators of dependent population (SF2) and the dependency of GDP growth on agriculture (SF6) decreased. Finally, social disparity (SF3) and human-induced soil degradation (SF8) retained the same value for all years.
Figure 11 shows the figures for non-scaled sub-indicators which compose the PVILR, and
their respective weights, which were obtained using the Analytic Hierarchy Process (AHP).
49,68 45,03 43,61 43,75 0 10 20 30 40 50 60 70 80 90 1995 2000 2005 2007 PVILR 1995 2000 2005 2007 WA HP LR.1 0,70 0,71 0,75 0,76 21,91 LR.2 0,63 0,70 0,74 0,76 10,53 LR.3 15,41 15,41 15,39 14,26 13,56 LR.4 0,52 0,46 0,40 0,43 15,05 LR.5 1,85 3,26 6,65 6,63 12,90 LR.6 0,24 0,94 0,83 0,92 3,70 LR.7 3,10 2,95 2,80 1,90 9,17 LR.8 62,90 62,90 62,90 62,90 13,18 Figure 11. PVILR
Vulnerability due to lack of resilience has the opposite meaning of resilience or capacity, obtained from the sub-indicators selected. In this case most of the sub-indicators reflect small changes in their values. The PVILR slightly decreased between 1995 and 2005, and
then, in 2010, it had a very small increase. The most considerable changes were found between 1995 and 2000, where the indicators of Human Development Index (LR1), Gender-related Development Index (LR2), Insurance of Infrastructure and Housing (LR5) and Television Sets (LR6) increased their values, thus positively reducing this lack of resilience. Figure 12 shows the total PVI value obtained from the average of the component indicators, and the aggregated format which illustrates the contribution of each indicator.
38,21 32,39 33,28 33,92 0 10 20 30 40 50 60 70 80 90 1995 2000 2005 2007 PVI 26,69 19,78 23,98 25,31 38,25 32,36 32,25 32,68 49,68 45,03 43,61 43,75 0 20 40 60 80 100 120 140 1995 2000 2005 2007 PVI LR SF ES Figure 12. PVI
PVI figures illustrate a reduction in the prevalent vulnerability in 2000, due to the decreasing of the three components of the index. The PVILR indicator is the component
with most contribution to the country’s prevalent vulnerability. In 2007, the PVI increased due to the growing of exposure and susceptibility and the lack of resilience.
The PVI illustrates the relationship between risk and development, either because the development model adopted reduces it or increases it. This aspect makes evident the necessity of explicit risk reduction measures, because development actions do not reduce vulnerability automatically. This evaluation can be useful to institutions related to housing and urban development, environment, agriculture, health and social care, economics and planning, to mention a few.
3.4 RISK MANAGEMENT INDEX (RMI)
The main objective of the RMI is the measurement of performance of risk management. This index is a qualitative measurement of risk based on pre-established levels (targets) or desirable referents (benchmarking) towards which risk management should be directed, according to its level of advancement. For RMI formulation, four components or public policies are considered: risk identification (RI), risk reduction (RR), disaster management (DM) and governance and financial protection (FP).
Estimation of each public policy takes into account six sub-indicators that characterize the performance of management in the country. Assessment of each sub-indicator is made using five performance levels: low, incipient, significant, outstanding, and optimal, that corresponds to a scale of 1 to 5, where 1 is the lowest level and 5 the highest. In this methodological focus each reference level is equivalent to a ‘performance objective’; thus, it allows the comparison and identification of results or achievements towards which governments should direct the efforts of formulation, implementation, and evaluation of policies in risk management.
Once performance levels of each sub-indicator have been evaluated, through a non-lineal aggregation model, the value of each component of the RMI is determined (IDEA 2005; Cardona 2005). The value of each composed element is between 0 and 100, where 0 is the minimum performance level and 100 is the maximum level. Total RMI is the average of the four composed indicators that represent each public policy. When the value in the RMI is high, performance of risk management in the country is better.
3.4.1 Institutional Organization
The institution in charge of planning and conducting operations related to the different types of disasters in Guyana is the Civil Defence Commission (CDC), established in 1982. By 1985 a comprehensive National Disaster Preparedness Plan was documented and put into use. At the time of its establishment the Commission operated under the authority of the Office of the Prime Minister. Responsibility for the CDC was subsequently moved to the Office of the President in 1992.
The CDC was reconstituted in 1997, and two committees were created: the National Disaster Committee, and the Essential Services Disaster Committee, both headed by the National Disaster Co-ordinator. The establishment of permanent Headquarters and staffing from the Joint Services was also decided. The terms of reference of the Commission were defined as follows: i) to identify disasters according to established criteria and classification; ii)to produce plans for the Management of National Disasters; iii) to identify and implement mechanisms for disaster response and mitigation; iv) to maintain a permanent body, to enhance the national capacity for disaster management services; v) to train human resources involved in disaster response mechanisms; vi) to educate at all levels in the tenets of disaster responses.
In September 2001, the Standard Operation Procedures for the National Emergency Operations Centre were upgraded to meet new challenges of the worsening domestic and international disaster situation (CDC 2012). Figure 13 shows the organizational structure of the CDC.
The CDC manages different plans and procedures as tools of disaster management in order to structure and guide emergency action. The primary plans and procedures cover the following: Disaster Plans, including preparedness plans prepared on the basis of known risks, estimated impact areas, and predicted needs; Contingency Plans, which involve actions planned in anticipation that something unexpected might occur; Forward Planning, which concerns the development of specific plans to meet an immediate emergency; and
Standard Operating Procedures (SOPs). SOPs are developed within an organization to
Figure 13. Organizational structure of the CDC (Source: CDC10)
The functions of the CDC are as follows (CDC 2012):
Service Provider- providing services to local authorities/communities, and therefore developing programmes designed to enhance those services.
Planning and Implementation- ensuring the promotion and development at national
level of disaster planning and management and, in co-operation with local authorities, facilitating the implementation of disaster management measures.
Loss Reduction and Mitigation- promoting the adoption of disaster loss reduction and mitigation policies and practices at the national and local authority level.
Voluntary Service- promoting and developing voluntary service as an integral aspect of disaster management.
Training and Education- establishing and promoting the development, maintenance and improvement of the tenets of disaster management training and education.
Permanent Staffing- maintaining a permanent body to enhance the national capacity for disaster management services.
10
Responsibility for disaster management in Guyana extends to every individual, family, community, government, and private sector organizations. The Civil Defence Commission co-ordinates the national system with these bodies and is committed to initiating and supporting the disaster management process throughout Guyana (CDC 2012).
The Government of Guyana is inclined to adopt a comprehensive reform process to modernize the Civil Defence Commission (CDC) and to bring it in line as much as practicable with the policies of CARICOM’s umbrella agency for disaster management. The reform process will involve, among other measures, the revising of the outdated National Disaster Preparedness Plan to make the CDC compliant with global and regional systems such as United Nations International Strategy for Disaster Reduction, and the Caribbean Disaster Emergency Response Agency’s Comprehensive Disaster Management Framework. Implementing disaster preparedness legislation and upgrading infrastructural facilities will be completed as well.
The CDC of Guyana is a full member of the Caribbean Disaster Emergence Management Agency (CDEMA), the regional disaster management body formerly known as the Caribbean Disaster Emergency Response Agency, CDERA.
CDEMA replaces and advances the work of CDERA. CDEMA has fully embraced the principles and practice of Comprehensive Disaster Management (CDM), which is an integrated and proactive approach to disaster management. CDM seeks to reduce the risk and loss associated with natural and technological hazards and the effects of climate change in order to enhance regional sustainable development. CDEMA plays a role as facilitator, driver, co-ordinator and motivating force for the promotion and engineering of CDM in all participating States. (CDEMA 2012)
To date, the Government of Guyana (GOG), with the support of the international donor community, has implemented several policy instruments and activities toward improving disaster risk management and coastal zone management in the context of climate change adaptation. In 2002, a national climate change adaptation policy and implementation plan was approved. Following the 2005 floods, the GOG highlighted the need for a comprehensive plan of action for disaster response and risk reduction. A proposal for reform of the Civil Defence Commission (CDC) is under consideration. In 2007, the Global Environmental Facility (GEF) through the World Bank, under the Special Climate Change Fund, provided a grant to GOG in the amount of US$3.8 million, to finance a Conservancy Adaptation Project, which is under implementation. The European Union is also providing support for coastal zone management and sea defence; the GEF for early warning systems, and OXFAM for shelters (IDB 2009).
In spite of these initiatives, several constraints limit Guyana’s ability to systematically reduce disaster risk in the face of a changing climate. These include the need to (i) more accurately assess the impacts of sea-level rise and climate change; (ii) strengthen disaster risk management institutions, including reorienting toward emphasis on ex ante risk
reduction; (iii) incorporate sea-level rise and climate change in the design of sea defence and flood protection works; and (iv) manage flood risk within the context of a comprehensive development framework which integrates climate change adaptation planning, disaster risk management, coastal zone management, and environmental and watershed management. These needs are in line with those expressed in Guyana’s National Communication to the United Nations Framework Convention for Climate Change (UNFCCC) (IDB 2009).
In order to address these needs, the GOG requested technical assistance from the IDB to strengthen its capacity in integrated disaster risk management (IDRM), through the application of the IDB risk indicators and country risk evaluation and the updating of its National Disaster Plan to conform with the principles of IDRM, towards investment financing in disaster prevention and mitigation (IDB 2012). These interventions will be designed in co-ordination with existing initiatives being implemented by the World Bank, the UNDP, and other donor agencies. This report is one of the products of this technical assistance.
3.4.2 Indicators of risk identification
The identification of risk generally includes the need to understand individual perceptions and social representations and provide objective estimates. In order to intervene in risk it is necessary to recognize its existence,11 dimension it (measurement) and represent it by
means of models, maps, indexes etc. that are significant for society and decision-makers. Methodologically, it includes the evaluation of hazards, the different aspects of vulnerability when faced with these hazards, and estimations as regards the occurrence of possible consequences during a particular period of exposure. The measurement of risk is relevant when the population recognizes and understands it. In that way, the results can be the basis for risk intervention. The indicators that represent risk identification, RI, are the following:
RI1. Systematic disaster and loss inventory
RI2. Hazard monitoring and forecasting
RI3. Hazard evaluation and mapping
RI4. Vulnerability and risk assessment
RI5. Public information and community participation
RI6. Training and education on risk management.
3.4.3 Indicators of risk reduction
Risk management aims particularly to reduce risk. In general, this requires the execution of structural and non-structural prevention-mitigation measures. It is the act of anticipating with the aim of avoiding or diminishing the economic, social, and environmental impact of
11
That is to say, it has to be a problem for someone. Risk may exist but not perceived in its real dimensions by individuals, decision-makers and society in general. To measure or dimension risk in an appropriate manner is to make it apparent and recognized, which in itself means that something has to be done about it. Without adequate identification of risk it is impossible to carry out anticipatory preventive actions.
potentially dangerous physical phenomena. It implies planning processes but, fundamentally, the execution of measures that modify existing risk conditions through corrective and prospective interventions of existing and potential future vulnerability, and hazard control when feasible. The indicators that represent risk reduction, RR, are the following:
RR1. Risk consideration in land-use and urban planning
RR2. Hydrological basin intervention and environmental protection
RR3. Implementation of hazard-event control and protection techniques
RR4. Housing improvement and human settlement relocation from prone-areas
RR5. Updating and enforcement of safety standards and construction codes
RR6. Reinforcement and retrofitting of public and private assets.
3.4.4 Indicators of disaster management
Disaster management should provide appropriate response and recovery post-disaster, and depends on the level of preparation of operational institutions and the community. This public policy seeks to respond efficiently and appropriately when risk has been materialized and it has not been possible to impede the impact of hazardous phenomena. Effectiveness implies organization, capacity, and operative planning of institutions and other diverse actors involved in disasters. The indicators that represent the capacity for disaster management, DM, are the following:
DM1. Organization and co-ordination of emergency operations
DM2. Emergency response planning and implementation of warning systems
DM3. Endowment of equipment, tools and infrastructure
DM4. Simulation, updating and testing of inter-institutional response
DM5. Community preparedness and training
DM6. Rehabilitation and reconstruction planning.
3.4.5 Indicators of governance and financial protection
Governance and financial protection is fundamental for the sustainability of development and economic growth in a country. This implies, on the one hand, co-ordination between different social actors that necessarily are guided by different disciplinary approaches, values, interests, and strategies. Effectiveness is related to the level of interdisciplinarity and integration of institutional actions and social participation. On the other hand, governance depends on an adequate allocation and use of financial resources for the management and implementation of appropriate strategies for the retention and transference of disaster losses. The indicators that represent governance and financial protection, FP, are the following:
FP1. Interinstitutional, multisectoral and decentralizing organization
FP2. Reserve funds for institutional strengthening
FP3. Budget allocation and mobilization
FP4. Implementation of social safety nets and funds response
FP6. Housing and private sector insurance and reinsurance coverage.
3.4.6 Estimation of Indicators
RMI results have been obtained from detailed opinion surveys completed by national experts and representatives of various institutions related to risk management. The surveys were performed with the support of a local consultant and the CDC, who identified a list of potential local experts who had suitable knowledge about disaster risk management in the country. Thus, this index reflects performance of risk management based on evaluations of academics, professionals, and officials of the country. Results for 1990, 1995, 2000, 2005, and 2010 are presented below.
Table 9 shows the total RMI and its components, for each period. These are risk identification, RMIRI, risk reduction, RMIRR, disaster management, RMIDM, and
governance and financial protection, RMIFP.
Table 9. RMI values
Year 1990 1995 2000 2005 2010 RMIRI 7.39 9.93 14.16 31.37 37.04 RMIRR 8.13 12.93 12.93 17.21 32.41 RMIDM 5.25 9.32 16.3 17.21 39.51 RMIFP 8.26 9.94 13.46 14.77 17.21 RMI 7.26 10.53 14.21 20.14 31.54
Figure 14 shows the qualifications of sub-indicators12 that composed RMI
RI and their
respective weights, obtained using the Analytic Hierarchy Process (AHP).
Management related to risk identification shows a notable progress from 1990 to 2010. From 1990 to 2010 it can be observed that the country had a level improvement from low to significant in hazard monitoring and forecasting (RI2), and in vulnerability and risk assessment (RI4). Hazard evaluation and mapping (RI3), public information and community participation (RI5) and training and education in risk management (RI6) changed from a low to an incipient level of performance. Systematic disaster and loss inventory (RI1) changed from an incipient to a significant level. The most significant indicator according to the used weights, the vulnerability and risk assessment (RI4), had one of the most remarkable changes; this is reflected in the RMIRI results.
12
7.39 9.93 14.16 31.37 37.04 0 5 10 15 20 25 30 35 40 45 50 1990 1995 2000 2005 2010 RMIRI Ind. 1990 1995 2000 2005 2010 Weight RI,1 2 2 2 3 3 13.56 RI,2 1 2 2 3 3 18.14 RI,3 1 1 1 2 2 15.06 RI,4 1 1 2 2 3 20.95 RI,5 1 1 2 2 2 15.13 RI,6 1 1 1 2 2 17.16 Figure 14. RMIRI
Figure 15 shows sub-indicator qualifications that composed the RMIRR and their respective
weights, obtained using the Analytic Hierarchy Process (AHP).
8.13 12.93 12.93 17.21 32.41 0 5 10 15 20 25 30 35 40 45 50 1990 1995 2000 2005 2010 RMIRR Ind. 1990 1995 2000 2005 2010 Weight RR,1 1 1 1 2 2 27.19 RR,2 1 1 1 2 3 16.44 RR,3 1 2 2 2 2 10.13 RR,4 1 2 2 2 2 13.65 RR,5 2 2 2 2 3 18.58 RR,6 1 2 2 2 2 14.01 Figure 15. RMIRR
Management related to risk reduction indicates that in the country between 2005 and 2010 there was a significant increase in the RMIRR (risk reduction), as seen in the change from
the incipient to the significant level in two of the indicators, the hydrological basin intervention and environmental protection (RR2), and the updating and enforcement of safety standards and construction codes (RR5). The other indicators did not change between 2005 and 2010. The implementation of hazard-event control and protection techniques (RR3), the housing improvement and human settlement relocation from prone-areas (RR4) and the reinforcement and retrofitting of public and private assets (RR6) did not change; these had the same incipient level from 1995.
Figure 16 shows sub-indicator qualifications that composed the RMIDM and their respective