Australasian Medical Journal [AMJ 2013, 6, 5, 272-279]
Incorporating feature ranking and evolutionary methods for the classification of
high-dimensional DNA microarray gene expression data
Mani Abedini
1,2, Michael Kirley
1, Raymond Chiong
3,41. Department of Computing and Information Systems, The University of Melbourne, Victoria 3010, Australia
2. IBM Research Australia, Carlton, Victoria 3053, Australia
3. School of DCIT, Faculty of Science and IT, The University of Newcastle, Callaghan, NSW 2308, Australia
4. Faculty of Higher Education, Swinburne University of Technology, Lilydale, Victoria 3140, Australia
RESEARCH
Please cite this paper as: Abedini M, Kirley M, Chiong R. Incorporating feature ranking and evolutionary methods for the classification of high-dimensional DNA microarray gene
expression data. AMJ 2013, 6, 5, 272-279.
http//dx.doi.org/10.4066/AMJ.2013.1641
Abstract
Background
DNA microarray gene expression classification poses a challenging task to the machine learning domain. Typically, the dimensionality of gene expression data sets could go from several thousands to over 10,000 genes. A potential solution to this issue is using feature selection to reduce the dimensionality.
Aim
The aim of this paper is to investigate how we can use feature quality information to improve the precision of microarray gene expression classification tasks.
Method
We propose two evolutionary machine learning models based on the eXtended Classifier System (XCS) and a typical feature selection methodology. The first one, which we call FS-XCS, uses feature selection for feature reduction purposes. The second model is GRD-XCS, which uses feature ranking to bias the rule discovery process of XCS.
Results
The results indicate that the use of feature selection/ranking methods is essential for tackling high-dimensional classification tasks, such as microarray gene expression classification. However, the results also suggest that using feature ranking to bias the rule discovery process performs significantly better than using the feature reduction method. In other words, using feature quality information to develop a smarter learning procedure is more efficient than reducing the feature set.
Conclusion
Our findings have shown that extracting feature quality information can assist the learning process and improve classification accuracy. On the other hand, relying exclusively on the feature quality information might potentially decrease the classification performance (e.g., using feature reduction). Therefore, we recommend a hybrid approach that uses feature quality information to direct the learning process by highlighting the more informative features, but at the same time not restricting the learning process to explore other features.
Key Words
Classification, high-dimensional data, feature ranking, microarray gene expression profiling, eXtended Classifier System, XCS, GRD-XCS, guided rule discovery XCS, evolutionary algorithms.
What this study adds:
• Presenting evolutionary machine learning models based on the eXtended Classifier System (XCS) and incorporating feature ranking/selection methods for microarray gene expression classification.
• Two XCS models have been presented: The first model has feature selection in place to reduce the number of features, while the second model uses a
Corresponding Author:
Mani Abedini
IBM Research Australia
Level 5/204, Lygon St, Carlton, VIC 3053, Australia Email: [email protected]
feature ranking method to build a probabilistic distribution model that guides the rule discovery component of XCS without losing any feature.
• The experimental results suggest that using feature ranking/selection methods is essential to build a high-dimensional microarray classifier. However, incorporating feature quality information to guide the learning process can perform much better than the straightforward feature selection paradigm.
Background
Gene expression profiling using DNA microarrays provides important insights into our understanding of biological processes. They are key tools used to analyse gene markers in hereditary diseases, such as breast cancer, leukaemia and prostate cancer. From a clinical perspective, the classification of gene expression data is an important problem and an active research area. There are several ways that clinicians can use microarrays profiling to benefit their patients, including disease classification, personalised treatment and drug design.
The functional part of DNA is called gene. Typically, DNA hard-codes the genetic information that transfers into proteins and, in turn, results in regulating the cell functionality. By measuring the gene expression levels and finding the associations between the gene expression profiles and the phenotypes, microarray gene expression classification would replace pathological tests by giving more precise information regarding disease classes, subclasses and the stage of the disease. Identifying the subclass of a disease is of great importance because a successful treatment strategy is crucially dependent on a precise and early diagnosis of the exact type of the disease. Furthermore, this tool has been used by clinicians to personalise medicine. In other words, a physician can carefully monitor the effect of each medication on a particular patient.
In the literature, there exist many related studies that have built classification models for analysing microarray gene expression profiles using various machine learning methods. These include methods based on the decision tree,1 k-nearest neighbour,2 Support Vector Machine (SVM)3,4 and neural networks,5 among others. In this study, we focus on the eXtended Classifier System (XCS).6 XCS is a Genetics Based Machine Learning method, which concerns applying Evolutionary Algorithms (EAs)7,8 – a type of population-based stochastic search algorithms that mimic natural evolution (e.g., using crossover and mutation operations for the search process) – to machine learning. It is a powerful classifier and has demonstrated a high level of accuracy for complex classification problems.9
However, similar to other conventional classifiers, when the number of features increases (i.e., high-dimensionality), the performance of XCS degrades significantly. One possible solution would be to identify important features (genes in microarray expression data sets) by using feature ranking methods to boost the classification performance. In our work, we have proposed two different approaches (FS-XCS and GRD-XCS) to incorporate the feature quality information extracted to improve the baseline XCS performance for high-dimensional classification tasks. Before we delve into the details of our models, let us briefly review some related work on XCS in the next section.
Related work
In this section we review related work for our contributions. First, we review studies conducted to improve the XCS performance in general. We then change our focus to review studies conducted to improve the performance of traditional machine learning approaches by incorporating feature selection methods to tackle high-dimensionality.
Since this paper proposes two models to improve the XCS performance, here we review related contributions to enhance the baseline XCS performance. The early study conducted by Butz et al.10 showed that uniform crossover can ensure successful learning in many tasks. Subsequently, Butz et al.11 introduced an informed crossover operator, which extended the usual uniform operator such that exchanges of effective building blocks occurred.12 Morales-Ortigosa et al.13 also proposed a new XCS crossover operator, called the simulated blended crossover (BLX). BLX allows the creation of multiple offspring with a diversity parameter to control the differences between offspring and parents. In a more comprehensive overview, Morales-Ortigosa et al.14 presented a systematic experimental analysis of the rule discovery component in learning classifier systems. Subsequently, they developed crossover operators to enhance the discovery component based on evolution strategies with significant performance improvements.
Typically, feature ranking/selection methods can be used to reduce the dimensionality and consequently improve the classification performance of machine learning methods. 15 Our FS-XCS is inspired by this methodology.
From other perspectives, there are many related studies that incorporate some form of feature ranking/selection methodology to improve the classification performance of machine learning methods without having feature reduction. Our GRD-XCS model is inspired by this methodology. Wang et al.16 used Information Gain as part of the fitness function in an EA (basically, the EA population
contains several solutions and the fitness represents the appropriateness of each solution). They reported improved results when comparing their model to other machine learning algorithms. Recently, Huerta et al.17 combined linear discriminant analysis with an EA to evaluate the fitness of possible solutions and associated discriminate coefficients for crossover and mutation operators. Moore et al.18 argued that biasing the initial population, based on expert knowledge pre-processing, would lead to improved performance of the evolutionary-based model. In their approach, a statistical method, Tuned ReliefF, was used to determine the dependencies between features to seed the initial population. A modified fitness function and a new guided mutation operator based on features dependency was also introduced, leading to significantly improved performance.
Method
In this paper, our aim is to investigate the role of incorporating feature quality information to improve the performance of XCS. Therefore, we have proposed two extensions of XCS, both inspired by the feature ranking/selection paradigm. The first extension, which we call FS-XCS, is a straightforward combination of a feature selection method and the original XCS. The second extension, which we call GRD-XCS,19 incorporates a probabilistically guided rule discovery mechanism for XCS. The motivation behind both models is to improve the performance of classification models by utilising feature quality information without feature reduction.
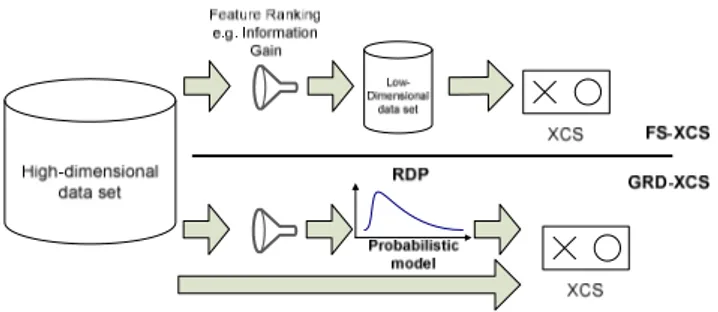
Figure 1 provides an overview of the FS-XCS and GRD-XCS models. As can be seen from the figure, FS-XCS uses some feature ranking method to reduce the dimension of a given data set before XCS starts to process the data set. It is a fairly straightforward hybrid approach.
Figure 1: An overview of the underlying architecture of FS-XCS and GRD-XCS. FS-XCS uses some feature ranking method to filter the data (for feature reduction), while GRD-XCS uses feature ranking methods to bias the rule discovery process (without feature reduction)
In GRD-XCS, however, information gathered from a particular feature ranking method is used to build a
probability model that biases the evolutionary operators of XCS. The feature ranking probability distribution values are recorded in a Rule Discovery Probability (RDP) vector. Each value of the RDP vector, that is a value between 0 and 1, is associated with a corresponding feature. The RDP vector is then used to bias the feature-wise uniform crossover, mutation, and don’t care operators, which are part of the XCS rule discovery component.
The actual values in the RDP vector are calculated based on the rank of the corresponding feature as described below:
where i represents the rank index in ascending order for the selected top ranked features Ω. The probability values associated with the top ranked features would be some relatively large values (a number between γ and 1) depending on the feature rank; for the others a small probability value ξ is given. Thus, all features have a chance to participate in the rule discovery process. However, the Ω -top ranked features have a greater chance of being selected.
GRD-XCS uses the probability values recorded in the RDP vector in the pre-processing phase to bias the evolutionary operators used in the rule discovery phase of XCS. The modified algorithms describing the crossover, mutation and don’t care operators in GRD-XCS are similar to standard XCS operators:
• GRD-XCS crossover operator: This is a hybrid uniform/n-point function. An additional check of each feature is carried out before the exchange of genetic material. If a generated random number is less than the value of RDP[i], then feature i is swapped between the selected parents.
• GRD-XCS mutation operator: It uses the RDP vector to determine if feature i is to undergo mutation; the baseline mutation probability is multiplied by RDP for each feature. Therefore, the mutation probability is not a uniform distribution anymore. The more informative features have a better chance to be selected for mutation.
• GRD-XCS don’t care operator: In this special mutation operator, the values in the RDP vector are used in reverse order. That is, if feature i has been selected to be mutated and a generated random number is less than the value of (1-RDP[i]), then feature i is changed to # (“don’t care”).
The application of the RDP vector reduces the crossover and mutation probabilities for “un-informative” features. However, it increases the “don’t care” operator probability for the same feature. Therefore, the more informative features should appear in rules more often than the “un-informative” ones.
Experiments
We have conducted a series of independent experiments to compare the performance of FS-XCS and GRD-XCS. A suite of feature selection techniques have been tested: Correlation based Feature Selection (CFS), Gain Ratio, Information Gain, One Rule, ReliefF and SVM. Four DNA microarray gene expression data sets have been used in the experiments. Table 1 presents the details of the data sets.
Table 1: Data set details
Data Sets #Instances #Features Cross Validation References Breast cancer 22 3226 3 20 Colon cancer 62 2000 10 21 Leukaemia cancer 72 7129 10 22 Prostate cancer 136 12600 10 23
Our models were implemented in C++. We also used the WEKA package (version 3.6.1) for feature ranking and applied other machine learning methods. All experiments were performed on the VPAC Tango Cluster server (www.vpac.org). Default parameter values as recommended by Butz24 have largely been used to configure the underlying XCS model.
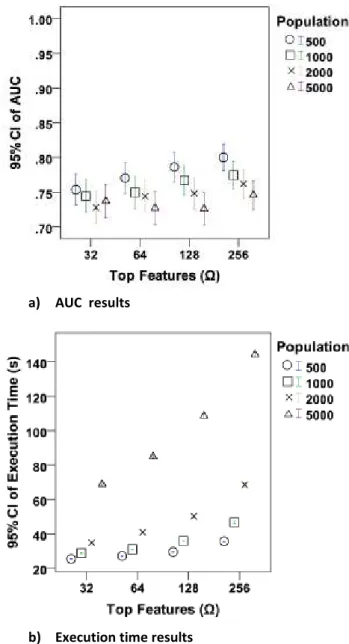
For calibrating the parameters of our models, we have carried out detailed analyses. The population sizes of 500, 1000, 2000, 5000 and Ω values of 2, 4, 8, 16, 32, 64, 128, 256 for FS-XCS as well as 32, 64, 128, 256 for GRD-XCS have been tested. For each parameter value-data set combination, we performed N-fold cross validation experiments (see Table 1) over 100 trials. The average values for specific parameter combinations have been reported using the Area Under the ROC Curve (AUC) value and execution time in minutes. Due to space constraints two sample plots are presented in Figure 2: one plot for AUC and one plot for execution time results.
A linear regression analysis of GRD-XCS AUC results reveals that the Ω parameter has a positive coefficient and the population size has a negative coefficient. Here, the Ω coefficient is 10 times larger than the other coefficient. This suggests that smaller population sizes with relatively larger Ω values produce the best results. Similarly, the linear
regression analysis of FS-XCS results reveals that Ω has a bigger impact on the accuracy.
Figure 2: The accuracy and execution time results of GRD-XCS using various population sizes and Ω values on the Breast Cancer data set. In these experiments, Information Gain has been used as the feature ranking method
a) AUC results
b) Execution time results
Appropriate statistical analyses using two-way ANOVA tests were conducted to determine whether there were statistically significant differences between particular scenarios (i.e., different parameter value-data set combinations) in terms of both AUC and execution time. Scatter plots of the observed and fitted values and Q-Q plots were used to verify normality assumptions. The null hypothesis tested was that there was no significant difference in results across all configurations for each model. These statistical analyses were performed using the IBM SPSS Statistics (version 19) software.
The ANOVA tests suggest that the AUC results and the execution times of each configuration for both GRD-XCS and
FS-XCS are significantly different (p < 0.001).
Results and discussion
Table 2 summarises the results of our experiments over the selected microarray gene expression data sets. From the table, we see that GRD-XCS has an overall better AUC than FS-XCS: the average FS-XCS AUC using various feature selection methods is 0.88 while the average AUC of GRD-XCS using the same feature ranking methods is 0.98. Meanwhile, both FS-XCS and GRD-XCS are better than the baseline XCS (without feature selection) – the latter has managed only an average AUC of 0.77.
Table 2: The average AUC values of GRD-XCS, FS-XCS and the baseline XCS on selected microarray gene expression data sets
GRD-XCS FS-XCS Baseline-XCS
Average AUC 0.98 0.88 0.77
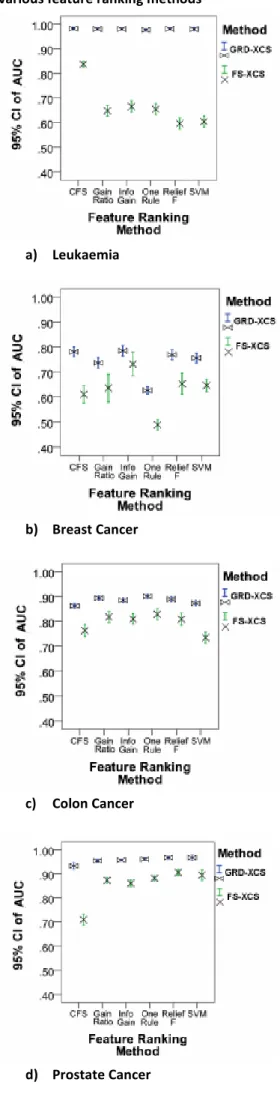
Figure 3 shows the AUC values of FS-XCS and GRD-XCS on different data sets when different feature ranking methods are used. From the figure, it is clear that GRD-XCS is significantly more accurate than FS-XCS. The AUC results of both FS-XCS and GRD-XCS for every feature ranking method, except Information Gain over Breast Cancer, is significantly different (p < 0.001).
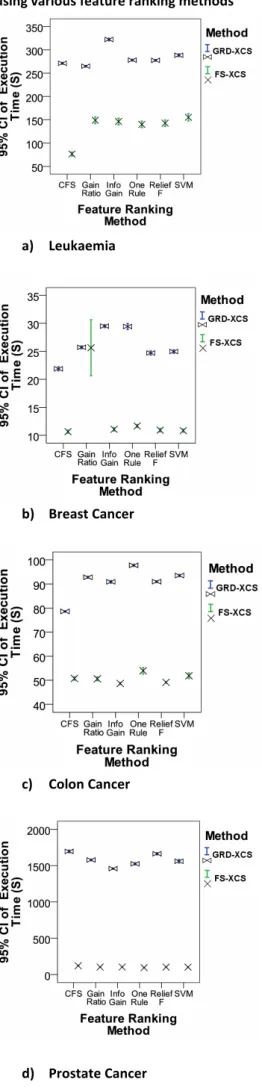
Figure 4 demonstrates that FS-XCS is significantly faster than GRD-XCS (p < 0.001) in terms of execution time. This is much expected since FS-XCS works with only a fraction of the original data set size (i.e., 32 features) while GRD-XCS still accepts the entire data set with thousands of features. The only exception is when Gain Ratio has been applied over the Breast Cancer data set – in this case there is strong evidence that both FS-XCS and GRD-XCS have significantly equal average execution time (p = 0.94).
Further multiple comparison tests comparing the maximum AUC performance of each configuration setting leads to the decision that for FS-XCS, Ω = 32 with a population size of 2000 provides an acceptable accuracy level within reasonable execution time. As for GRD-XCS, the setting of Ω = 128 and pop size = 500 produces the best results. As such, these parameter values have been used for the results presented in the next section. We also set the limits used in our probability value calculations to γ = 0.5 and ξ = 0.1, and the number of iterations was capped at 5000.
Figure 3: The AUC results of GRD-XCS vs. FS-XCS using various feature ranking methods
a) Leukaemia
b) Breast Cancer
c) Colon Cancer
Figure 4: The execution time results of GRD-XCS vs. FS-XCS using various feature ranking methods
a) Leukaemia
b) Breast Cancer
c) Colon Cancer
d) Prostate Cancer
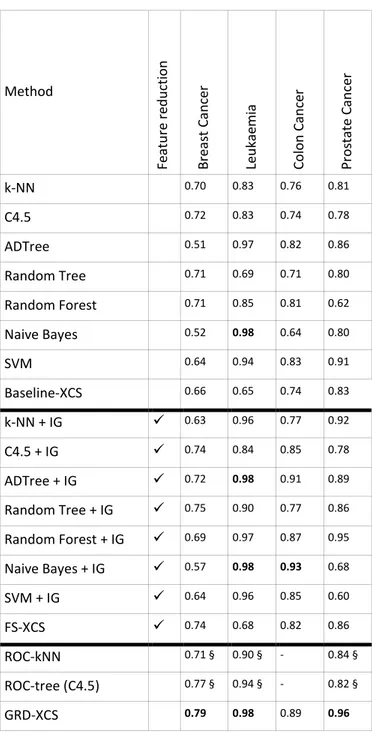
For the next step, we compared our models as well as the baseline XCS with several other machine learning methods, either with a feature selection method in place or without using any feature selection. The results are presented in Table 3, which are cross-checked with the results published by Hossain et al.1 and Hassan et al. 2
From Figures 3 and 4, we can claim that on average Information Gain delivers better results than other feature ranking methods for our models. Thus, we have used information Gain as the feature selection approach in conjunction with FS-XCS, GRD-XCS and other machine learning methods.
An analysis of Table 3 suggests that combining a feature selection method and a machine learning method improves the AUC performance of the baseline model.
However, ROC-kNN, ROC-tree and GRD-XCS – which are variations of kNN, C4.5 and XCS respectively – have demonstrated much better AUC performances in most cases. This clearly shows that using smarter techniques to adopt the baseline machine learning method for large scale classification problems provides better results than filtering the data by using feature selection methods. The reason is that, in complex data sets such as gene expression profiles, there is a high chance that typical feature selection methods, such as Information Gain, would fail to detect feature-feature interactions and remove part of the valuable data.
The results in Table 3 implies that GRD-XCS has produced overall better AUC results compared to other methods. In other words, incorporating feature quality information into guiding the rule discovery process of XCS allows GRD-XCS to outperform other machine learning methods in the majority of cases.
Table 3: Comparison of results based on average AUC values for GRD-XCS, FS-XCS, the baseline XCS and other machine learning methods using selected microarray gene expression data sets. Information Gain (IG) has been used as the feature selection method where necessary. § indicates that the results are reported directly from 1,2
Method F e a tu re r e d u ct io n B re a st C a n ce r Le u k a e m ia C o lo n C a n ce r P ro st a te C a n ce r k-NN 0.70 0.83 0.76 0.81 C4.5 0.72 0.83 0.74 0.78 ADTree 0.51 0.97 0.82 0.86 Random Tree 0.71 0.69 0.71 0.80 Random Forest 0.71 0.85 0.81 0.62 Naive Bayes 0.52 0.98 0.64 0.80 SVM 0.64 0.94 0.83 0.91 Baseline-XCS 0.66 0.65 0.74 0.83 k-NN + IG 0.63 0.96 0.77 0.92 C4.5 + IG 0.74 0.84 0.85 0.78 ADTree + IG 0.72 0.98 0.91 0.89 Random Tree + IG 0.75 0.90 0.77 0.86 Random Forest + IG 0.69 0.97 0.87 0.95 Naive Bayes + IG 0.57 0.98 0.93 0.68 SVM + IG 0.64 0.96 0.85 0.60 FS-XCS 0.74 0.68 0.82 0.86 ROC-kNN 0.71 § 0.90 § - 0.84 § ROC-tree (C4.5) 0.77 § 0.94 § - 0.82 § GRD-XCS 0.79 0.98 0.89 0.96
Conclusion
In this paper, we have analysed the performance of FS-XCS and GRD-XCS based on microarray gene expression classification problems. Comprehensive numerical simulation experiments have established that GRD-XCS is significantly more accurate than FS-XCS in terms of classification results. On the other hand, FS-XCS is significantly faster than GRD-XCS in terms of execution time. The results of FS-XCS suggest that normally 20 top-ranked features would be enough to build a good classifier, although this classifier is significantly less accurate than the
equivalent GRD-XCS model. Nevertheless, both models have performed better than the baseline XCS.
To sum up, using feature selection to highlight the more informative features and using them to guide the XCS rule discovery process is better than applying feature reduction approaches. This is mainly due to the fact that GRD-XCS can transform poor classifiers (created from the un-informative features) into highly accurate classifiers. From the empirical analysis presented it is clear that the performance of different feature selection techniques varies inevitably depending on the data set characteristics.
References
1. Hossain MM, Hassan MR, Bailey J. ROC-tree: A novel decision tree induction algorithm based on receiver operating characteristics to classify gene expression data. Proceedings of the SIAM International Conference on Data Mining. 2008; 455-465.
2. Hassan MR, Hossain MM, Bailey J, Kotagiri R. Improving k-nearest neighbour classification with distance functions based on receiver operating characteristics. Lecture Notes in Computer Science. 2008; 489-504.
3. Zhang S, Hossain MM, Hassan MR, Bailey J, Kotagiri R. Feature weighted SVMs using receiver operating characteristics. Proceedings of the SIAM International Conference on Data Mining. 2009; 497-508.
4. Brown MP, Grundy WN, Lin D, Cristianini N, Sugnet CW, Furey TS, Ares M Jr, Haussler D. Knowledge-based analysis of microarray gene expression data by using support vector machines. Proc Natl Acad Sci USA. 2000; 97: 262-267. 5. Khan J, Wei JS, Ringnér M, Saal LH, Ladanyi M, Westermann F, Berthold F, Schwab M, Antonescu CR, Peterson C, Meltzer PS. Classification and diagnostic prediction of cancers using gene expression profiling and artificial neural networks. Nat Med. 2001; 7: 673-679. 6. Lanzi PL. Learning classifier systems: Then and now. Evolutionary Intelligence. 2008; 1: 63-82.
7. Chiong R (ed). Nature-inspired Algorithms for Optimisation. Berlin: Springer-Verlag; 2009.
8. Chiong R, Weise T, Michalewicz Z (eds). Variants of Evolutionary Algorithms for Real-World Applications. Berlin: Springer-Verlag; 2012.
9. Vecchiola C, Abedini M, Kirley M, Chu X, Buyya R. Gene expression classification with a novel coevolutionary based learning classifier system on public clouds. Proceeding of the Sixth IEEE International Conference on e-Science Workshops. 2010; 92-97.
10. Butz MV, Goldberg DE, Tharakunnel K. Analysis and improvement of fitness exploitation in XCS: Bounding models, tournament selection, and bilateral accuracy. Evol Comput. 2003; 11: 239-277.
11. Butz MV, Pelikan M, Llora X, Goldberg DE. Automated global structure extraction for effective local building block processing in XCS. Evol Comput. 2006; 14: 345-380.
12. Lanzi PL. A study of the generalization capabilities of XCS. Proceedings of the Seventh International Conference on Genetic Algorithms. 1997; 418-425.
13. Morales-Ortigosa S, Orriols-Puig A, Bernardo-Mansilla E. New crossover operator for evolutionary rule discovery in XCS. Proceedings of the Eighth International Conference on Hybrid Intelligent Systems. 2008; 867-872.
14. Morales-Ortigosa S, Orriols-Puig A, Bernado-Mansilla E. Analysis and improvement of the genetic discovery component of XCS. International Journal of Hybrid Intelligent System. 2009; 6: 81-95.
15. Zhang Y, Rajapakse, J. C. Machine Learning in Bioinformatics; 2008.
16. Wang P, Weise T, Chiong R. Novel evolutionary algorithms for supervised classification problems: An experimental study. Evolutionary Intelligence. 2011; 4: 3-16. 17. Bonilla Huerta E, Hernandez JH, Montiel L. A new combined filter-wrapper framework for gene subset selection with specialized genetic operators. Proceedings of the Second Mexican Conference on Pattern Recognition: Advances in Pattern Recognition. 2010; 250-259.
18. Moore JH, White BC. Exploiting expert knowledge in genetic programming for genome-wide genetic analysis. Proceedings of the Ninth International Conference on Parallel Problem Solving from Nature. 2006; 969-977. 19. Abedini M, Kirley M. Guided rule discovery in XCS for high-dimensional classification problems. Proceedings of the 24th Australasian Conference on Artificial Intelligence. 2011; 1-10.
20. Hedenfalk I, Duggan D, Chen Y, Radmacher M, Bittner M, Simon R, Meltzer P, Gusterson B, Esteller M, Kallioniemi OP, Wilfond B, Borg A. Gene-expression profiles in hereditary breast cancer. N Engl J Med. 2001; 344: 539-48. 21. Alon U, Barkai N, Notterman DA, Gishdagger K, Ybarradagger S, Mackdagger D, Levine AJ. Broad patterns of gene expression revealed by clustering analysis of tumor and normal colon tissues probed by oligonucleotide arrays. Proc Natl Acad Sci USA. 1999; 96: 6745-6750.
22. Golub TR, Slonim DK, Tamayo P, Huard C, Gaasenbeek M, Mesirov JP, Coller H, Loh ML, Downing JR, Caligiuri MA, Bloomfield CD. Molecular classification of cancer: Class discovery and class prediction by gene expression monitoring. Science. 1999; 286: 531-537.
23. Singh D, Febbo PG, Ross K, Jackson DG, Manola J, Ladd C et al. Gene expression correlates of clinical prostate cancer behavior. Cancer Cell. 2002; 1: 203-209.
24.Butz MV, Wilson SW. An algorithmic description of XCS. Journal of Soft Computing. 2002; 6: 144-153.
ACKNOWLEDGEMENTS
The authors would like to thank VPAC for providing access to the Tango CPU server.
PEER REVIEW
Not commissioned. Externally peer reviewed.
CONFLICT OF INTERESTS
The authors declare that they have no competing interests.
FUNDING
This work was part of a PhD project supported financially by the University of Melbourne scholarships: MIRFS and MIRS. The Australian e-Health Research Centre also granted a travel scholarship for presenting this paper at the AIH 2012 workshop.