AS 659
ASL R2798
2013
2012 Iowa Dairy Farm Survey
2012 Iowa Dairy Farm Survey
Leo L. Timms
Iowa State University, ltimms@iastate.edu
Kristen Schulte
Iowa State University, kschulte@iastate.edu
Follow this and additional works at: https://lib.dr.iastate.edu/ans_air
Part of the Agriculture Commons, and the Dairy Science Commons
Recommended Citation
Recommended Citation
Timms, Leo L. and Schulte, Kristen (2013) "2012 Iowa Dairy Farm Survey," Animal Industry Report: AS 659, ASL R2798.
DOI: https://doi.org/10.31274/ans_air-180814-831
Available at: https://lib.dr.iastate.edu/ans_air/vol659/iss1/49
This Dairy is brought to you for free and open access by the Animal Science Research Reports at Iowa State University Digital Repository. It has been accepted for inclusion in Animal Industry Report by an authorized editor of Iowa State University Digital Repository. For more information, please contact digirep@iastate.edu.
2012 Iowa Dairy Farm Survey
A.S. Leaflet R2798
Leo Timms; Jenn Bentley, Dairy Specialists; Kristen Schulte, Farm Management Field Specialist,
ISU Extension and Outreach
Summary
A 12 page dairy survey was developed, disseminated, collected, and analyzed by ISUEO Dairy team in
conjunction with the Survey & Behavioral Research Services (SBRS) at Iowa State University. The survey was sent to 1000 dairy producers (65% of total producers) using the IDALS dairy producer list with proportional
representation from all areas and counties across the state. The return or completion rate was 38%. Results provide insight on the current state of the dairy industry in Iowa and will be summarized and provided through reports for educators, industry collaborators, and the public. This information will help educators and industry collaborators determine educational programming areas in the short and long term. Additionally results will help all audiences better understand the demographic of dairy farms, management practices used, and the future of the Iowa dairy industry.
Needs and ISUEO Dairy Team Programmatic Response A comprehensive survey was developed and
summarized by Dr. Leo Timms, Extension Dairy Specialist, Jennifer Bentley, Extension Dairy Field Specialist, and Kristen Schulte, Extension Farm and Agribusiness Management Specialist. Survey and Behavioral Research Services (SBRS) at Iowa State University was contracted to conduct the mail survey to a sample population of dairy operations. Additionally, extension received generous support from industry collaborators that helped to fund the project including Brickle Brothers, Foremost Farms USA, Iowa Farm Bureau, Land O Lakes Purina Feed, Midwest Dairy Association, Northeast Iowa Community College and Vi-Cor.
Design & Procedures
The survey was developed cooperatively by SBRS and the Principal Investigators. The survey was twelve pages in length and included questions relating to farm
characteristics, dairy farm management, crop management, manure management, employees and family labor,
information sources, issues in the dairy industry, and personal demographics. Printed copies of the survey were prepared by SBRS and mailed to 1000 dairy farmers on March 13, 2012, with a cover letter and postage-paid return envelope enclosed. A reminder was sent to non-respondents on March 23, and a second copy of the survey was mailed to
non-respondents on April 6. Data was collected and input by SBRS, and final database analyzed by ISUEO Dairy team.
Survey Results
The sample for this study consisted of 1,000 producers drawn from a list of dairy operations in the state of Iowa. Thirty-eight percent of producers completed the survey; counties with higher concentration of dairy farms in the state returned the most surveys (Clayton, Dubuque, Delaware, and Allamakee).
Producer Demographics
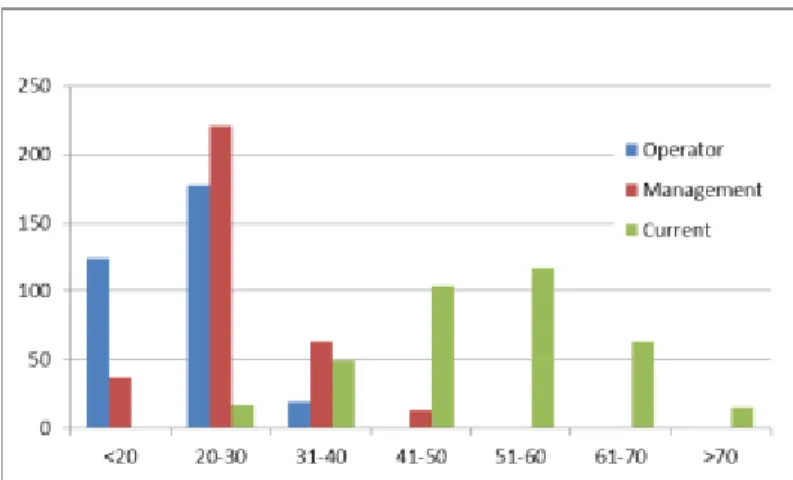
Results (Figure 1) showed dairy operators are primarily male (94%) and between the ages of 41 and 60 (average = 51), and got started in the dairy industry as an operator and in management at a young age, less than 30 years of age. Just under half of operator’s have an education level no greater than high school, and a higher percent of operators spouses (33 v. 10%) work off the farm. They are only moderately involved in farm organizations with under one half being involved with the Iowa Farm Bureau, 4-H or FFA, breed associations, or the Iowa State Dairy Assoc.
Figure 1 Age of Operator: How old were you when you first became a farm operator? Started to manage the farm you now operate? How old are you now?
Herd Demographics
Size and Structure: Growth in dairy operation herd size in Iowa has been slow since 2006 with most operations below 250 head; 23 percent of operations are less than 50 head, 36 percent from 50 to 99 head and 26 percent have 100 to 250 cows for both 2006 and 2012. There has been limited growth in larger operations. Sixty-nine percent of operations today are structured as a sole proprietorship with an individual or family; just fewer than sixty percent of current operators started in the dairy industry by working with a similar operation structure. 63% of the operations
graze to some degree(11% intensively) while the majority of operations are not certified organic (7.5% organic).
Milk production and components: The primary breed on dairy operations is Holstein and operations typically have a Rolling Herd Average between 18 and 26 thousand pounds. Smaller herd sizes, certified organic herds, and Jersey and Cross-bred breeds displayed lower levels of production. In regards to milk quality, average component levels for all herds are 3.87 % fat and 3.17 % protein while average somatic cell count was 233,000.
All Herds Holstein Jersey Cross-bred Fat percent 3.87 3.76 4.67 4.18 Protein percent 3.17 3.11 3.60 3.16 SCC (X 1000) 233 234 227 241
Housing and facilities: Milking and housing systems are key components to a dairy operation. Forty percent of operations utilize tie-stall or stanchion barns for their milking system while just under half use a herringbone, parallel, or parabone style parlor. Smaller operations had a higher correlation of using a tie-stall or stanchion barn milking system. Over 60 percent of operations have freestall housing; however, this type of housing more common with larger dairy farms, over 100 head. In regards to recent updates, operators have more recently updated the cow housing facilities compared to milking parlor facilities.
Dairy management practices / technology: Seventy-four percent of herds keep records on individual cows; of those operations that keep individual cow records, 80 percent utilize DHIA records while 40 percent use PCDart. Operators employ a variety of practices and technologies to manage dairy cows and their operation. Common practices used include a consultant to balance rations, Rumensin in rations, synchronization program for reproduction,
composting mortalities, and heat detection aids. Operations are less likely to engage in practices related to technology like automatic calf feeding or automated heat detection.
Land and nutrient management:Total acreage base for a dairy operation, on average, increased from 560 to 596
acres from 2006 to 2011. The number of acres planted to corn silage and hay has increased at a greater rate than the overall number of acres per farm since 2006. About half of dairy operations custom hire field operations; fertilizer and herbicide application and hay baling are commonly hired out by dairy operations. In regards to nutrient management, smaller operations placed manure in a spreader or building or spread daily while larger herds used a lined structure for storage. A majority of operations adjust commercial fertilizer application rate based on estimated nutrients in manure; however, only 40% of operators test the nutrient content of their manure on a yearly or less frequent basis.
Employee and family labor: Over 60 percent of Iowa dairy operations utilize immediate family labor for both full and part-time positions. As herd size increased, the number of immediate family, full-time laborers increase to 3 workers while hired, full-time laborers increase to above ten workers. Full-time workers log more than 50 hours per week while part-time workers log 17 to 22 hours per week on a dairy operation.
Information sources /topics of interest:
P
rimary resource for dairy and farm management information is a dairy nutritionist; they also primarily receive information from veterinarians and other farmers. Producers prefer to receive information from magazines. When questioned on topics that need additional training in Iowa, production and management related issues rose to the top of the list. These topics include mastitis prevention and treatment,reproductive management, basic nutrition, crop production for dairy feed, and calf feeding and young stock.
Current / future issues and plans: Currently, producers indicate that commodity prices and milk price volatility are two conditions that have some impact on farm businesses. In the future, over half of operators plan to stay in business for at the least the next 15 years. One-third of operations plan to expand their herd at an average of 86 head with the majority of those herds expanding in the next five years. In regards to facility updates, 43 percent of operations plan to update calf or heifer facilities, this is over ten percent higher than any other facility type update. According to results, over half of dairy operations in Iowa will remain in operation under the current operator only slight growth in herd size and limited planned facility updates or expansion.
Comparative Analysis of the Iowa Dairy Industry Industry demographics and assessment has been completed in the past through Iowa State University (ISU) and United States Department of Agriculture (USDA). Dairy industry surveys have been conducted by ISU Extension in 2000 and 2005; however, the 2000 survey only covered 19 counties in Northeast and North central Iowa. The USDA performs a census every five years; the most recent data available is from 2007. The results from these studies are compared to the 2012 Iowa Dairy Industry Survey below.
2007 Census of Agriculture – USDA: Based on 2007 Census of Agriculture data, 48.8 percent of dairy farms in Iowa had less than 50 head of milk cows, over double the response from the ISU survey for all years. When comparing to the census, the demographic of the primary operator in Iowa is representative to the national industry. The U.S. Census in 2007 recorded the average age of operator at 52 years which is one year greater than the survey average, and 94 percent of operators were male in both studies. Also, nationally 87 percent declared farming as their primary occupation; this can be compared to 88 percent of Iowa survey respondents who do not have an off-farm job. According to the census, just fewer than 80 percent of farms were organized under a family or
individual; this is higher than Iowa operations coming in at 69 percent. Compared to the U.S. in 2007, a slightly greater percentage of farms are currently organized as a corporation in Iowa. According to the U.S. Census, the sample of farms in the Iowa Dairy Industry survey were larger than the average, but the operator demographics were very similar between at the state and national level.
ISU Extension Dairy Industry Survey, 2000 and 2005:
The 2012 Iowa Dairy Industry Survey included similar information to surveys completed in 2000 and 2005; therefore, we can draw comparisons between the results. The average herd size in 2000 was 76 cows with 52.3 percent of herds between 50 and 99 head and 17.7 percent of herds over 100 head. The current distribution of herds has changed with more herds in the larger herd size categories. Currently, 36 percent of herds have between 50 and 99 head and 39 percent over 100 head in 2012. Along with herd size growth, crop acres have increased by 228 acres since 2000. In 2000, operations had 368 total acres, owned and rented, compared to 596 in 2011 (Table 10). Acres in corn have doubled and corn silage almost quadrupled from 2005 to 2011. In reference to custom field operations, custom hire fertilizer application, chemical or herbicide application, and hay operations were the top three operations hired out in both 2000 and 2011. Production has increased over time; both 2000 and 2005 reported average Rolling Herd
Averages close to 20 thousand pounds while 60.4 percent of farms in 2012 produced at levels over 20 thousand pounds.
Dairy Farm Operator Characteristics, 2000 and 2012 ISUEO Iowa Dairy Farm Surveys Dairy farm operator characteristics
Operator Characteristic 2000 2012 Average age of principal operator, years 46.1 51.1 Average age when first become a farm operator,
years 21.4 21.6
Average age when took over current farm, years 25.9 26.4 Current farm was originally owned by parents/got
started with parents or family, percent 66.8 70.7 Participation in off-farm employment – operator,
percent 10.0 10.2
Participation in off-farm employment – spouse,
percent 44.1 34.0
Family’s quality of life – very or somewhat
satisfied, percent 78.7 74.1
Family’s quality of life – become much or
somewhat better during past 5 years, percent 35.6 36.7
Farm structure and labor: Since 2000, the percent of farms organized under a sole proprietorship has decreased by 12 percent, but the percent of farms in a partnership or corporation have increased by two and 11 percent,
respectively. Farms in Iowa predominately use family labor as over 20 percent of operations hire non-family labor in both 2000 and 2012.
Facilities and Management Practices: Compared to 2000, producers have moved out of stanchion or tie-stall barns, percent of operations milking in a stanchion or tie-stall barn had decreased from 75.5 to 39.6. Percent of farms using freestall barns for housing has increased from 31.2 to 60.6 percent. Producers are not likely to adopt new practices or technologies; there was a small percent change for most
practices that were included in both 2000 and 2012 surveys. In regards to manure storage handling, an increasing percent of operations use a lined structure and decreased percent put manure directly into a spreader or spread daily since 2000
Future of the Dairy Business: 40% of respondents in
2005 indicated that bringing in a family member was in their transition plan; the same percentage indicated
transferring ownership to a family member will occur in the next 15 years. In 2005 there was stronger support for consideration of leasing facilities or being a mentor or partner with a beginning dairy producer compared to 2012. In 2012, only about one-third of operations stated a plan to expand their herd, while over 30 percent plan to update calf and heifer or transition and dry cow facilities within the next
15 years. A majority of the operators do not plan to exit the industry in the next 15 years; however, 40 percent of operators plan to discontinue milking and continue farming and 39 percent plan to transfer ownership of the dairy operation to a family member in the same time frame. These results show that farms are still predominately small in size, family oriented, and plan to remain in the industry.
Summary
Iowa Dairy Industry has progressed over the past decade; however, the farms plan to only grow marginally and remain family oriented. Opportunities for programing can be extracted from this survey based on current and projected demographics and needs of the dairy industry and operators. This information is important for ISU Extension and industry organizations to better adapt to the needs of today and tomorrow’s operations.
Dairy Management Practices and Technologies used, 2000, 2005, and 2012 Dairy management practices and technologies used
2000 2005 2012
Management Practice or Technology Response, percent
Use Posilac (rBST or BGH) 23.6 21 14.0
Milk cows three times a day 1.7 4 12.4
Use a shorter dry period 54 34.2
Use consultant to balance rations 73.9 79.2
Use precision farming techniques 19 21.8
Contract milk through co-op or supplier 9.1 17.5
Uses regularly scheduled vet visits/utilize vet for
herd health 68.3 78.2
Keep production records on individual cows 59.4 74.4
Use a computer to manage farm records 64.5 51.8
Access the internet for farm information 46.5 56.3
Manure Management Practices, 2000, 2005, and 2012 Manure management
2000 2005 2012
Manure Handling Practices Response, percent
Directly in spreader or daily spread 53.3 43.9
Leave manure in barn/buildings 55.8
Manure pack 8
Pile manure on ground or slab
13
58
Store in unlined manure storage basin 18.4
Store manure in lined structure 23.4 53.4
Other 2.5 3.2
Written Nutrient Management Plan 23.3 13 19.7
2012 Iowa Dairy Farm Survey by ISU Extension and Outreach Dairy Team: Jennifer Bentley, Dairy Field Specialist, NE
IA, jbentley@iastate.edu or 563-382-2949; Kristen Schulte, Farm and Ag Business Management Specialist, NE IA,
kschulte@iastate.edu or 563-547-3001; and Leo Timms, State Dairy Specialist, ltimms@iastate.edu or 515-294-4522