A Holistic Ranking Scheme for Apps
Rajeev R. Raje
Department of Computer and Information Science Indiana University-Purdue University Indianapolis
Indianapolis, IN, USA [email protected]
comparing that view with the user perspective (i.e., user reviews/star ratings). They did not investigate the sentiments associated with the user reviews in depth. As user reviews could be biased or manipulated by various factors (e.g., poorly written reviews) [5], an in-depth investigation is necessary to provide a holistic view of any app and a comprehensive ranking of similar apps. Any such comprehensive effort will involve developing a scheme that includes both the programmatic view as well as the user perception1 – such a scheme is the focus of this paper.
We describe a holistic ranking system for apps created using the principles of static code analysis, theory of evidence, Subjective Logic, and Natural Language Processing (NLP). We have empirically validated the proposed system in the context of the Google Play Store. For this study, we have chosen a much larger dataset (as compared with the one used in [4]) that contains 50 apps each from top 5 different categories – games, tools, entertainment, communication, and photography available in the Google Play Store [6].
The rest of the paper is organized as follows: Section II describes our approach in detail. The dataset, experiments, and results are discussed in Section III. Section IV covers the related literature on different approaches used to quantify the trust of mobile apps before or after their development. Finally, we indicate the contributions of this paper and summarize the potential improvements to be explored in future.
II. PROPOSED APPROACH
Figure 1 describes our approach – it contains following steps: create the data set, generate internal and external trust tuples, combine them to quantify the trust of an app and finally, use these combined tuples to rank-order various alternatives. Below we describe each of these steps in detail.
A. Creating the Dataset
We initially, as indicated earlier, selected top 250 apps from the Google Play Store. Out of these apps, we identified 90 apps that contain at least 1000 reviews and used them in the study. This resulted in the dataset that contained 20 apps from the Communication domain, 7 apps from the Entertainment domain, 10 apps from the Games domain, 43 apps from the Photography domain, and 10 apps from the Tools domain. In order to compute the average star rating for each app, we have only considered the star ratings associated with these 1000 reviews. For these 90 apps, we downloaded their APK (Android Package Kit) files. In addition, we extracted most recent 1000 reviews each of these 90 apps. These 90,000 reviews were scrapped using
Nahida Sultana Chowdhury
Department of Computer and Information Science Indiana University-Purdue University Indianapolis
Indianapolis, IN, USA [email protected]
Abstract— App stores or application distribution platforms allow users to present their sentiments about apps in the forms of ratings and reviews. However, selecting the “best one” from available apps that offer similar functionality is difficult task – especially, if the selection process only uses the average star rating of the apps. To address this challenge, we have introduced a trust-based selection and ranking system of similar apps by combining the programmatic view (“internal view”) and the sentiments based on users reviews (“external view”). The rankings based on the average star ratings are compared with the rankings generated by our approach. We empirically evaluate our approach by using the publically available apps from the Google Play Store. For this study, we have chosen a dataset of 250 apps with total 114,480 reviews from top 5 different categories – of which we focused our experiments on 90 apps that have at least 1000 reviews. Our experiments indicate that proposed holistic ranking that encompasses both the internal and external views is a better alternative than any ranking that focuses only on the internal or external view.
Keywords— Apps; Subjective Logic; Online Marketplace; User Rating; Trust; Sentiment Analysis; Ranking
I. INTRODUCTION
These days, for any conceivable category (e.g., messenger), there are plentiful (sometimes in thousands) of apps created for mobile devices. These apps, some of which are free, are easily available from a variety of app-bazaars (e.g., Google Play Store) [1]. Too many choices of available apps in such marketplaces make the selection of an appropriate one very challenging. A traditional way to address this challenge is to look at the average star rating score (out of 5) supported by the app stores. For example, 55.5% of apps have 4.2 stars on average and 44.5% apps have less than 3 stars ratings in the Google play store according to July 2018 data [2]. A typical user always picks the highest rated app from the result list. However, this five-star rating system is questionable, and the average rating is often influenced by users’ two extreme choices of either five stars or one-star [3]. Thus, to select a good quality app, the average user rating is not sufficient – a deeper analysis of all available evidences is necessary.
To address this challenge, Chowdhury and Raje [4] introduced a selection technique based on investigating the programmatic view (i.e., analyzing the app code) and 1 In this paper, we have used the words “programmatic view” and “internal view” and the words “user perspective” and “external view” interchangeably.
____________________________________________________
This is the author's manuscript of the article published in final edited form as:
Chowdhury, N. S., & Raje, R. R. (2018). A Holistic Ranking Scheme for Apps. 2018 21st International Conference of Computer and Information Technology (ICCIT), 1–6. https://doi.org/10.1109/ICCITECHN.2018.8631955
Python with its Selenium and Beautiful Soup libraries. We collected the following data about each app: app title, review text, review creation time, and the star rating.
Download APK file Decompile APK file to bytecode file Run Static Code Analysis Tool internal Text Analyzer Tool Generate Sentiment Value (Polarity, Subjectivity) map to exter n al
Generate trust tuple for both Internal and External view and
merge into single tuple
System Model
Subjective logic
Generate rating out of 5 Fig. 1: Trust-based Selection and Ranking Approach
B. Trust tuples based on Internal Evidences For generating the internal evidences, as advocated in [4], we analyzed the APK files of the 90 apps via the static analysis tool called FindBugs. FindBugs as it is capable of reducing the number of false positive warnings [7], can analyze bytecode, and is able to detect over 400 possible bug patterns. For each reported bug, FindBugs assigns priorities (from 1 to 20); where 1 indicates the highest priority and 20 directs the lowest priority bug. The priority level of the warnings relies on confidence level (high, medium, and low) of the tool regarding the existence of the bug.
Evaluation of internal trust tuples. We follow the same definition of trust of an app, used in [4], as “an apps’ conformance to its specification”. Trust of an app is quantified as a balance between belief (b), disbelief (d), and uncertainty (u) and is denoted as a tuple of <b, d, u> using the principles of Subjective Logic introduced by Jøsang [8]. For such a representation of trust about any entity, multiple evidences are collected about it. Each evidence is used to compute the corresponding <b, d, u> tuple and these individual tuples can be merged using various operators (e.g., consensus and ordering) provided by the Subjective Logic [9].
In our approach, in order to collect internal evidences, the high confidence bugs indicated by FindBugs are counted as positive evidences (as these are almost always true bugs) and the low confidence bugs are considered as negative evidences (as these are almost always false alarms). The medium confidence bugs are counted as uncertain evidences, which are equally distributed between the positive and negative evidences. To quantify the internal view as a <b, d, u> tuple, we have applied the following the formulas [10]:
b =(number of positive evidences)/(total evidences+n)…(1) d =(number of negative evidences)/(total evidences+n)…(2)
u =n/(total evidences + n) …(3)
where ‘n’ indicates the number of possible outcomes is 2 as a bug is either present or absent.
Aggregation of tuples and rank ordering. Based on
the bug priority and bug rank [1-20] identified by FindBugs, each tuple associated with an evidence is given a weight by assigning the bug rank and a consensus cumulative weighted fusion operator [11] is used to combine individual tuples into a single tuple. Once single tuples for all similar apps are generated then these apps can be rank ordered using the ordering operator. The ordering operator uses the notion of probability expectancy. For each app, we normalize our rating to out of 5 to allow the comparison of our rankings with the Google Play Store’s rankings.
C. Trust tuples based on External Evidences The tasks involved in the process of generating external evidences and associated ranking are: review preprocessing, Sentiment classification, and creating trust tuples.
Review preprocessing. Pre-processing aims to present an app’s review in an organized format and increases the machine understanding on the text, as most reviews are in the form of unstructured text. Reviews scraped from the Google Play Store are encoded to Unicode and stored into CSV files. Before passing the reviews for sentiment analysis, they are decoded from Unicode. To normalize Unicode data in Python, the unicodedata.normalize(form, unistr) [12] method has been used that is supported by Unicodedata library. This method is used to remove umlauts, accents, and other similar features. These pre-processed reviews are then acted upon by the sentiment classification to predict the sentiment of the user while creating that review.
Sentiment classification. The sentiment classification process categorizes a review to be either Subjective or Objective. The output of this process is the sentiment score (range from 0 to 1). If the review contains a positive or negative sentiment, the review is classified as subjective; else, it will be objective (classified as neutral). In the polarity classification, subjective reviews are further classified as positive or negative. The sentiment of review is classified based on the sentiment lexicon that is associated with the subject – the range of sentiment varies from -1 (negative) to +1 (positive). Any review that has a polarity value of 0 is counted as Neutral. We have used, similar to the approach employed by Gallege in [40], a tool called TextBlob (https://textblob.readthedocs.io/en/dev/) for the sentiment analysis of the pre-processed reviews.
Creating Trust tuples. Gallege has presented an
algorithm to map the sentiment values to trust tuples [33]. It, for each review, obtains a sentiment score from TextBlob and maps it to an individual trust tuple. These individual trust tuples are then merged using the consensus operator into a single <b, d, u>. However, his algorithm does not consider the boundary case [0, 0] – this case is found in approximately 10% of the total reviews, and the subjectivity value has no role in the trust tuple mapping. Hence, we developed a new mapping scheme to enhance Gallege’s algorithm – we consider the boundary case of [0, 0] as a neutral evidence and utilize both the polarity and subjectivity values to categorize the reviews as positive, negative, and neutral evidences. Our approach is indicated below:
Input: Sentiment Value generated by TextBlob For each App (1 to N) {
For each review (1 to 1000) { #classify as subjective if sub > 0: if pol>0: pos_evidence = pos_evidence + 1 elif pol < 0: neg_evidence = neg_evidence + 1 else: neutral_evidence = neutral_evidence + 1 #Objective - classify as neutral
else:
neutral_evidence = neutral_evidence + 1} total_evidence = pos_evidence + neg_evidence +
neutral_evidence
Quantify the external view using the formula (1),(2), and (3) }
Output: External Trust tuples <b, d, u> for N app
D. Combined View and Ranking
Combined View. Once we have single tuples, each
representing the external and internal views of an app, we merge them using the consensus operator. Such a combined tuple considers all available evidences and thus, provides a better quantification of trust associated with each app than the basic average star ratings provided by the Google Play Store.
Rank ordering apps. The combined tuples of similar apps allow us to rank-order these apps using the ordering operator [13], which uses the notion of probability expectancy. To order similar apps, it compares the ratio of (b+u)/(b+d+2*u) and assigns the highest rank to the tuple that holds the greatest ratio. To break any ties, the ordering operator uses the uncertainty value. We normalize our rankings to be out of 5 to allow the comparison of our rankings with the Google Play Store’s rankings. Finally, the combined rankings generated by our algorithm are compared, using the Kendall Tau Distance method [14] that counts the number of pair-wise variance between two ranking lists – similar to the work presented in [4]. Distances of 0% and 100% are the indication of being the same and opposite rankings respectively.
III. RESULTS AND DISCUSSION
There are four different kinds of rankings that can be obtained using the outcome of experiments. These are: a) average star rating based ranking (default in the Play Store), b) ranking based only on the trust tuples computed for the internal view, c) ranking based only on the trust tuples associated with the external view, and d) ranking based on the tuples generated after combing the internal and external views. These four rakings present multiple scenarios for comparing. Hence, we discuss our results using such scenario analyses – similar to the approach advocated in [4]. Table I shows the computed Kendall Tau distances for four such comparisons in the context of homogeneous (i.e., providing same functionality) apps.
A. Scenario 1: External vs. Average Rating As seen from Table I, the Kendall Tau distances between apps for all five categories are smaller (0% to 16%) when we compare rankings obtained by the external and average
ratings – indicating that these two rankings are fairly similar to each other. Although this is intuitive, as the review narrative should be consistent with the star rating, we investigated the reviews in the Games category to support/refute this intuition. For example, for the review “How to play this game?” the user provided a rating of 5. However, TextBlob returned a negative sentiment for this review – reflecting a mismatch. A review “I spend way too time on this game” reflected a positive emotion of the user and the user also provided 5-star rating for this review. However, TextBlob returned a negative sentiment score for this review – again, reflecting a mismatch. Such mismatches indicate that although for our dataset, the distances between average and external rankings are small, the star ratings in many cases are not a true reflection of the associated review narrative.
B. Scenario 2: Internal vs. Average Rating Table I indicates that the dissimilarity between internal rankings and average rankings for all categories is more prominent (24% to 56%) than the distance discussed in the preceding subsection. In the Communication category, we found two apps (Mood Messenger and Facebook Messenger) that have opposite orderings – e.g., Mood messenger has a rank of 2 out of 20 based on the user ratings; while its rank is 20 based on the internal evidences. The opposite is true for the Facebook Messenger – a rank of 19 based on user ratings but a rank of 2 based on internal evidences. These cases are grouped into two following categories:
Good to Bad. The users rated the Mood Messenger as having a high rank, but the internal evidence-based algorithm ranked it very low. A few supportive (first two) and a few critical (last two) user comments include:
“This has to be the best sms/mms app yet. Love the themes and the individual theme settings for each contact. Background, bubble style and color. Just a well thought out app. Love it. Galaxy S9+”
“I have played with many texting apps, and this is the best. It is picture, emoji, and GIF-friendly. It allows you to customize backgrounds for each contact (a feature I enjoy), and easily allows for the scheduling of messages.”
“It is so buggy is causes everything on my phone to go haywire.”
“I used to love this app, but recently it started messing up to where I was not receiving my messages. I ended up having to go back to using the default messaging app”
The above supportive reviews appear to be more focused on aesthetical aspects (e.g., theme setting or customize background), while the critical reviews seem to emphasize the issues with the failure of the app in terms of functionality (e.g., buggy or not receiving message) – a view reinforced by our internal evidence based ranking scheme. In order to carry out a deeper analysis, we analyzed randomly selected 41 sample reviews from the 1000 reviews. We used a sampling calculator
(https://www.surveysystem.com/sscalc.htm) to decide the
sample size with confidence level and confidence interval values set to 95% and 15 respectively. In these 41 the sample reviews, 35 were supportive reviews and 6 were critical. Such an imbalance reflects why the app is having high user rating.
Bad to Good. The users rated the Facebook Messenger as having a low rank, but our internal evidence-based algorithm ranked it at the top. Two supportive comments and two critical comments, for this app, are given below:
“This app works so well. A family member and I had a video chat for about 15 minutes and it didn't have to reconnect not even once. The quality was great and I loved it!!!”
“Good chat and good call and videocall vary good voise sms good cominikishan and vary good cam am all time toking from messenger all pipels”
“I hate it is so much when any app such as messenger stops working and forces you to update it. I am satisfying with old one and I don't have time and internet to update”
“Other apps with same application are having less size. Messenger has nothing new but the most bulky messaging app. Reduce app size.”
The above supportive reviews appear to be spot on the functional aspects (e.g., good video call) – a view enforced by our internal evidence-based ranking scheme. Alternatively, the critical reviews seem to highlight the issues with the failure of the app to deliver wish list (e.g., reduce app size). Again, for a randomly selected sample size of 41 reviews, the number of positive reviews is less than the critical reviews (the number of positive reviews is 5 and the number of bad reviews is 35), thus, providing a poor rating for the app. Hence, in the case of this particular app, even though there is a difference between the user rankings and the internal evidence-based ranking schema, a user who is concerned on the functional aspects of the app would tend to agree with the internal evidence-based ranking scheme. We also found reviews (see below) where the user is trying to convey technical issues to the developer, but assigns a 5-star rating to the app.
“I had been a long time user of this app but when i switched phones. The quick reply menu on the notification bar displays the same contact picture even though i assigned different ones. And the badge notification isn't disappearing even though there are no new messages or anything. Pls help.”
In summary, average star rating cannot be considered as the true reflection of reviews, which could be another reason for the dissimilarity between these two ranking schemes.
C. Scenario 3: Internal vs. External Rating For this scenario, from Table I, we can see the distances between internal and external evidence-based rankings are quite similar to the scenario 2. The issues that were discussed in Scenarios 1 and 2 also hold for this scenario. We investigate this scenario with two different apps from
the Photography category – photo editors from mmosoft and axiem systems.
Good to Bad. The external evidence-based ranking
positioned the mmosoft app at 2 out of 43 apps; while the internal evidence-based ranking placed it last at 43. For each supportive and critical category, two sample comments are given below:
“I liked this app very much. Beautiful frames r there. Loved it.”
“Good app,has many designed collages” “When i clicked any pic it showed any other pic”
“Useless app...cant save n view in local gallery..dont waste ur time downloading this app”
The supportive reviews appear to be more focused on the UI aspects rather than the functional aspects (e.g., beautiful frame or collages), whereas the critical reviews seem to address the functionality issues (e.g., can’t save). Similar to the previous scenarios, we randomly selected 41 reviews for this app for further investigation. 30 reviews, out of 41, were supportive and 11 were critical – resulting in a high ranking for the app in the external evidence-based rating.
Bad to Good. The Axiem Systems app was ranked at 35 by the external evidence-based ranking; while it was ranked as the top app by our internal evidence-based ranking. Again, supportive and critical comments for this app are given below:
“I love this app. It's so simple and just does exactly what I need it to do for drawing and writing on photos. Easy, accessible and attached to lots of social media. I love this so much.”
“Best photo app out there, does anything and everything u need in one free app. Magnifies pixs, better than zoom apps”
“Ever since I downloaded this app my phone started to have ads out of no where. It's horrible!!!!”
“Does not maintain transparent background.”
The supportive reviews appear to focus on functional aspects (e.g., Magnifies pixs), while the critical reviews seem to underline the issues with the external features (e.g., have ads). For randomly selected sample size of 41, the number of positive reviews (15) is less to the number of critical reviews (26) – leading to a lower ranking. In this case, a user who is concerned on the functional aspects of the app would likely agree with the internal evidence-based ranking scheme.
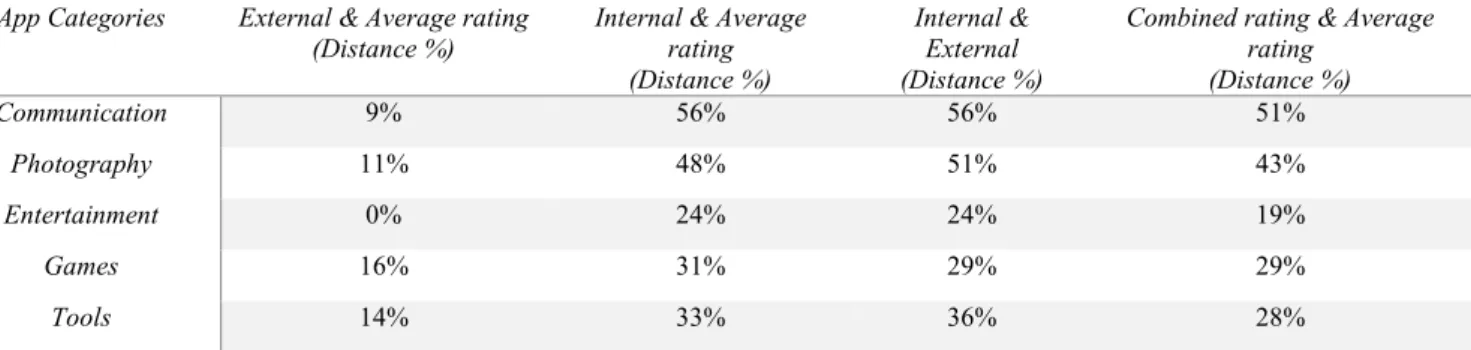
Table I: DISTANCE BETWEEN ORDERING BASED ON AVERAGE RATING AND COMBINED RATING - HOMOGENEOUS APPS
App Categories External & Average rating
(Distance %) Internal & Average rating (Distance %)
Internal & External (Distance %)
Combined rating & Average rating (Distance %) Communication 9% 56% 56% 51% Photography 11% 48% 51% 43% Entertainment 0% 24% 24% 19% Games 16% 31% 29% 29% Tools 14% 33% 36% 28%
D. Scenario 4: Combined vs. Average Rating Previous three scenarios have illustrated the fact that rankings based on partial evidences – i.e., only average, only internal view, or only external view – result in significantly different rankings. Hence, in order to provide a holistic view, there is a need to combine internal and external evidences. To achieve this combination, we decided to assign equal weights to both the internal view tuple and the external view tuple and use the consensus operator. As seen from Table I, the distance between the average star ranking and the combined ranking varies from 19% to 51% for different categories – and it is lesser than other distances, excluding the external view-based ranking and the average ranking. Also, the combination leads to the ranking that lies between the two extremes (i.e., average and external versus average and internal) represented by columns 2 and 3 in Table I. Below, we summarize the reasons behind these observations and present a justification to advocate the combined ranking as more appropriate and trustworthy over the average rating based ranking of apps.
User star ratings, as described earlier, are not always a true reflection of reviews. Reviews such as “So nice” or “Good app” are associated with a rating of one star highlights the mismatch and does not reflect the correct sentiment. Similarly, reviews such as “Not sure” and associated user rating of five stars, again, do not reflect the right emotion of the user. Such mismatches lead to incorrect average rating and thus, not proper ranking based on the average ratings. Also, users most of the time use unstructured text to write a review – e.g., a review such as “grtttt” with rating 5; where it indicates a positive sentiment but according to TextBlob, it is a neutral evidence. TextBlob also fails sometimes due to the lack of app store specific domain knowledge. Thus, it is neither fair nor sufficient to only use the star ratings or its combination with the external narratives. Conversely, when we deal with internal evidences (i.e., analyses of bytecode) there is no possibility of such an ambiguity as static code analysis tools entirely focus on the functional aspects of an app. Although static code analysis tools do return many false positives, a scheme to rank the errors, such as the employed by FindBugs, helps in providing proper internal evidences. When we combine both the internal and external evidences and generate a rank list, it not only encompasses all perspectives but also helps in overcoming such idiosyncrasies associated with reviews.
We describe this scenario using two randomly selected apps from the Games and Entertainment category – game2048 created by s2apps and fakeacallfree2 created by excelltech.
Good to Bad. The average rating-based ranking placed the game2048 app at 2 out of 10 apps, while the combined ranking placed it at 8. For each supportive and critical category, two sample comments each are given below:
“I've always loved this game, and the undo button make it a lot easier to get higher scores”
“Addictive and definitely challenging game with bright user interface.. loved it”
“this game is best no doubt- but this application is too slow.”
“Very Buggy This is a great version of the game, but constant ads and loss of progress are very frustrating. Its to bad there isn't a pro version with save.”
The supportive reviews appear to be more focused on the UI aspects rather than the functional aspects (e.g., undo button, bright user interface), whereas the critical reviews seem to address the functionality issues (e.g., loss of progress). Similar to the previous scenarios, we randomly selected 41 reviews for this app for further investigation. 34 reviews, out of 41, were supportive and 7 were critical – resulting in a high ranking for the app in the external evidence-based rating.
Bad to Good. The fakeacallfree2 app was ranked at 6 by the average rating-based ranking; while it was ranked as the top app by our combined ranking. Again, supportive and critical comments for this app are given below:
“Get this app It is soo cool no ads and it look like it reall I can fake like on a. Phone call to get my stuff out of things.” “It works grat on my huawei p6 I tried several similar apps, but none of them was working properly, I couldnt answer my fake calls. This one works great for me.”
“this app is for lonely people who can't get real people pr people without friends to call them.”
“Fake App Such a bad app I request you all please don't waste your MB for such a crap!!”
The supportive reviews appear to focus on the functional aspects (e.g., works great), while the critical reviews seem to underline the issues with the ethical usages (e.g., misusing the app). For randomly selected sample size of 41, the number of positive reviews (17) is less to the number of critical reviews (24) – leading to a lower ranking. In this case, a user who is concerned on the functional aspects of the app would likely agree with the combined ranking scheme.
IV. RELATED WORKS
To make the mobile application bug free, there are many approaches – among them is testing (e.g., functional testing). As many of the apps are concurrent in nature, Google has provided Espresso [15], which allows the creation of Android UI tests. Another built-in tool that comes with the Android developers’ toolkit is Monkey. It is capable of generating UI events [16]. Ma et al. [17] also present an automated testing tool called Bug Rocket – it runs in the distributed testing environment that is based on reverse engineering techniques. Other supportive tools to test mobile applications are SwiftHand [18], EvoDroid [19], and Dynodroid [20]. Static code analysis tools can also identify various possible security violations, runtime errors, and logical inconsistency in an app. Tools such as FindBugs [21] and Jlint [22] can perform bytecode analysis. By applying FindBugs, Hammad et al. [23] presented an approach that recognized particular categories of bugs that occurred less frequently in high rated apps and more in low rated apps. They investigated the associations between each category of bugs in an app and the corresponding app rating. Sentiment analysis has been extensively used to evaluate reviewer comments and suggest recommendations in many domains such as movies, and products [24]-[26]. Sentiment analysis has been also used on app store reviews by a few research efforts [27, 28] to maintain and improve apps. In [29], authors have used the review-to-topic mapping technique where the list of topics help the developer to understand and interpret the most requested feature by the users to be on the top of the list. Pagano and Maalej [30] and
Palomba et al. [31], have done the similar work, where they investigated the types of user feedback and revealed how developers consider user reviews to improve in terms of rating.
Only a few efforts have quantified trust tuples based on the reviews of apps [32, 33]. As indicated earlier, these efforts have either not considered large datasets or not created a combined view of the apps. We have applied a similar concept, based on the Subjective Logic, for the available internal and external evidences. In addition, based on the trust values, we generate the rank ordering of the apps. Such a rank order helps the users in the selection process of apps having similar functionalities.
V. CONCLUSION AND FUTURE WORK
In this paper, we have presented a framework to model and quantify the trust of apps and to generate a trust-based rank order of homogeneous apps. It provides methods to analyze and aggregate internal and external evidences by performing static code analysis, sentiment analysis, and subjective logic based operations. Such a combined aggregation provides a holistic view of apps and a well-rounded ranking of apps. The results of our experiments indicate that a combined ranking has less Kendall Tau distance with the star-based average ratings than rankings just based on the internal view. In addition, the combined ranking has less Kendall Tau distance with the star-based average ranking than the distance between the internal and external rankings.
Our future efforts will address the following challenges: many downloaded apps are not used more than once in the first six months. As of July 2018, only 33,293 apps from the Google Play Store have been downloaded more than 1million times and 1,221,115 apps are downloaded less than 100 times [34]. Hence, one future exploration is to consider the temporal aspects of the app reviews and their downloads. Another direction of future work is to train the TextBlob using sample reviews from the app store to provide adequate domain knowledge. Finally, we plan to incorporate different techniques (e.g., model checking) or different evidences (e.g., collusion checking, Ad presence checking, system specification, number of downloads, user and developers’ reputation) to generate internal evidences and use them in the rankings.
REFERENCES
[1] Statista, “Number of apps available in leading app stores as of 1st quarter 2018”: https://www.statista.com/statistics/276623/number-of-apps-available-in-leading-app-stores/.
[2] AppBrain: https://www.appbrain.com/stats/android-app-ratings. [3] M. Siegler, “YouTube Comes To A 5-Star Realization: Its Ratings
Are Useless,” Techcrunch, 2009.
[4] N. Chowdhury and R. Raje, “Disparity between the Programmatic Views and the User Perceptions of Mobile Apps,” 20th International Conference of Computer and Information Technology, IEEE, 2017. [5] A. Henry, “Why You Shouldn't Trust App Store Reviews (and
What to Trust Instead):” https://lifehacker.com/why-you-shouldnt-trust-app-store-reviews-and-what-to-1515379780.
[6] Statista, “Most popular Google Play app store categories from 1st quarter 2016 to 1st quarter 2018, by number of downloads (in millions):” https://www.statista.com/statistics/256772/most-popular-app-categories-in-the-google-play-store/.
[7] D. Hovemeyer and W. Pugh, “Finding Bugs Is Easy,” ACM SIGPLAN Notices, vol. 39, no. 12, 2004.
[8] A. Jøsang, “Subjective Logic: A formalism for reasoning under uncertainty,” Springer Verlag, 2016.
[9] A. Jøsang, “An Algebra for Assessing Trust in Certification Chains,” NDSS Symposium, 1999.
[10] D. Ceolin, P. Groth, and W. Hage, “Calculating the trust of event descriptions using provenance,” Proceedings Of The SWPM, 2010. [11] H. Shi, Z. Liang, and B. Liang, “Using new fusion operations to improve trust expressiveness of subjective logic,” Wuhan University Journal of Natural Sciences, Volume 16, number 5, 2011.
[12] Unicodedata: https://docs.python.org/2/library/unicodedata.html. [13] A. Jøsang, “Artificial Reasoning with Subjective Logic,” Proceedings
of the Second Australian Workshop on Commonsense Reasoning, Perth, 1997.
[14] M. Kendall, “A New Measure of Rank Correlation,” Biometrika, Volume 30, Issue 1-2, pp. 81–93, 1938.
[15] Espresso:google.github.io/android-testing-supportlibrary/docs/espresso/index.html.
[16] Monkey: developer.android.com/studio/test/monkey.html.
[17] X. Ma, N. Wang, P. Xie, J. Zhou, X. Zhang, and C. Fang, “An Automated Testing Platform for Mobile Applications,” IEEE International Conference on Software Quality, Reliability and Security Companion, 2016.
[18] W. Choi, G. Necula, and K. Sen, “Guided gui testing of android apps with minimal restart and approximate learning,” In ACM SIGPLAN Notices, volume 48, pp. 623–640. ACM, 2013.
[19] R. Mahmood, N. Mirzaei, and S. Malek, “Evodroid: Segmented evolutionary testing of android apps,” In Proceedings of the 22nd ACM SIGSOFT International Symposium on Foundations of Software Engineering, pp. 599–609, ACM, 2014.
[20] A. Machiry, R. Tahiliani, and M. Naik, “Dynodroid: An input generation system for android apps,” In Proceedings of the 2013 9th Joint Meeting on Foundations of Software Engineering, pp. 224–234, ACM, 2013.
[21] FindBugs: findbugs.sourceforge.net/. [22] Jlint: jlint.sourceforge.net/.
[23] H. Khalid, M. Nagappan, and A.Hassan, “Examining the Relationship between FindBugs Warnings and App Ratings,” IEEE SOFTWARE, pp. 34–39, 2016.
[24] L. Zhuang, F. Jing and X.-Y. Zhu, “Movie review mining and summarization,” In Proceedings of the 15th ACM international conference on Information and knowledge management, ACM, 2006. [25] H. Tang, S. Tan and X. Cheng, “A survey on sentiment detection of reviews,” Expert Systems with Applications, vol. 36, no. 7, pp. 10760-10773, 2009.
[26] B. Pang and L. Lee, “Opinion Mining and Sentiment Analysis,” Foundations and Trends in Information Retrieval, vol. 2, no. 1-2, pp. 1-135, 2008.
[27] S. Panichella, A. Di Sorboy, E. Guzmanz, C. Visaggioy, G. Canforay, and H. Gall, “How Can I Improve My App? Classifying User Reviews for Software Maintenance and Evolution,” ICSME, Bremen, Germany, pp. 281 -290, 2015.
[28] B. Pang, L. Lee, and S. Vaithyanathan, “ThumbsUp? Sentiment Classification using Machine Learning Techniques,” Proceedings of the Empirical Methods in Natural Language Processing, 2002. [29] S. Chirag, and A. Sundaram, “(2013) Sentiment Analysis of App
Store Reviews”, [online] Available:
http://cs229.stanford.edu/proj2013/CS229-ProjectReport-ChiragSangani-SentimentAnalysisOfAppStoreReviews.pdf. [30] D. Pagano, and W. Maalej, “User Feedback in the AppStore: An
Empirical Study,” In Proceedings of the 21st IEEE International Requirements Engineering Conference, pp.125-13, 2013.
[31] F. Palomba, M. Linares-V ́asquez, G. Bavota, R. Oliveto, M. Di Penta, D. Poshyvanyk, and A. De Lucia, “User Reviews Matter! Tracking Crowdsourced Reviews to Support Evolution of Successful Apps,” ICSME, pp. 291-300, 2015.
[32] L. Gallege, and R. Raje, “Parallel Methods for Evidence and Trust-basd Selection and Recommendation of Software Apps from Online Marketplaces,” Proceedings of the 12th Annual Cyber and Information Security Research Conference, 2017. [33] L. Gallege, “Trust-based Service Selection and Recommendation
for Online Software Marketplaces (TruSStReMark),” PhD Thesis, IUPUI, 2016.
[34] Download distribution of Android apps: https://www.appbrain.com/stats/android-app-downloads.
![Fig. 1: Trust-based Selection and Ranking Approach B. Trust tuples based on Internal Evidences For generating the internal evidences, as advocated in [4], we analyzed the APK files of the 90 apps via the static analysis tool called FindBugs](https://thumb-us.123doks.com/thumbv2/123dok_us/67371.2507775/2.892.66.433.134.417/selection-approach-internal-evidences-generating-evidences-advocated-findbugs.webp)