O R I G I N A L A R T I C L E
Open Access
Health inequality and the uses of time for
workers in Europe: policy implications
J. Ignacio Gimenez-Nadal
1,2*and Jose Alberto Molina
1,3* Correspondence:
ngimenez@unizar.es
1Department of Economic Analysis,
Faculty of Economics, University of Zaragoza and CTUR, C/Gran Via 2, 3rd floor, 50005 Zaragoza, Spain
2CTUR, University of Oxford, Oxford,
UK
Full list of author information is available at the end of the article
Abstract
This paper analyses the relationship between health inequality and the time allocation decisions of workers in six European countries, deriving some important policy implications in the context of income tax systems, regulation of working conditions, and taxes on leisure activities. Using the Multinational Time Use Study, we find that a better perception of own health is associated with more time devoted to market work activities in all six countries and with less time devoted to housework activities for both men and women. However, the evidence for the associations between health and leisure is mixed. This study represents a first step in understanding cross-country differences in the relationship between health status and time devoted to a range of activities for workers, in contrast with other analyses that have mainly focused only on market work. A better understanding of these cross-country differences may help to identify the effects of public policy on inequalities in the uses of time.
JEL codes:D13, J16, J22
Keywords:Health, Time allocation, Inequality, Multinational time use study
1 Introduction
In this paper, we analyse the important relationship between health inequality and the time devoted to different activities by workers in six European countries. Despite that the prior literature has focused on the relationship between health status and labour market outcomes (Currie and Madrian; 1999; Au et al., 2005; Disney et al., 2006; Barnay, 2010; Jones et al., 2010), little is known about the relationship between health and non-labour market outcomes, which include time devoted to household produc-tion and leisure. The analysis of other uses of time is important for several reasons. Time is a crucial factor in well-being (Kahneman et al., 2004; Kahneman and Krueger, 2006; Krueger, 2007; Stiglitz et al., 2009), and its scarcity may lead to problems in reconciling work and family spheres (Hochschild, 1990; Schor, 1991, Gimenez-Nadal and Sevilla, 2011). Furthermore, a great amount of time is allocated within the house-hold in the form of househouse-hold production (Becker, 1965), which has substitutes in the market, such as outsourcing activities, that contribute to the Gross Domestic Product of the country. Considering Grossman’s seminal work on the concept of health capital and the demand for health (Grossman, 1972a, 1972b), health can be considered a com-ponent of the stock of individual human capital that enters as durable stock capital. Under this framework, investments in health increase the amount of time available to produce money earnings in the future. But time is also required to produce/maintain
© 2016 Gimenez-Nadal and Molina.Open AccessThis article is distributed under the terms of the Creative Commons Attribution 4.0 International License (http://creativecommons.org/licenses/by/4.0/), which permits unrestricted use, distribution, and reproduction in any medium, provided you give appropriate credit to the original author(s) and the source, provide a link to the Creative Commons license, and indicate if changes were made.
health and to obtain medical care. Thus, an analysis of the non-market work time of workers, and its relationship with health inequalities, is important for policy issues.
To the best of our knowledge, only three studies have directly analysed the relationship between health and time allocation decisions other than market work time. Podor and Halliday (2012) analyse the relationship between health and time allocation in the USA and find that better health is associated with large positive effects on home production, and similarly large positive effects on market production, but with lower consumption of leisure. Gimenez-Nadal and Ortega (2013) analyse the relationship between health status and the time devoted to both market and non-market work in Spain and find that better health is associated with an increase in the hours of market work and a decrease in the time devoted to non-market work. Gimenez-Nadal and Molina (2015) analyse the relationship between health status and the time devoted to different uses for a sample of working and non-working individuals in six European countries and find that a better perception of own health is associated with less time devoted to sleep, personal care, and non-market work, for both men and women, and with less time in leisure for men, while it is associated with more time in market work for both men and women. However, none of these prior studies have focused on the relationship between health status and time allocation decisions for the specific case of workers.
We contribute to the literature by analysing the relationship between the self-reported health inequalities of workers and the time devoted to sleep, personal care, market work, non-market work, and leisure for a variety of countries, revealing several consistent patterns but also some inconsistencies. We acknowledge that our approach is mainly descriptive, and we can only talk about associations and not about causality, as in Podor and Halliday (2012) and Gimenez-Nadal and Molina (2015). First, the use of self-reported health measures may introduce a source of endogeneity (reverse causality) that can affect the estimated relationship between health and time allocation decisions (Stern, 1989; Kerkhofs and Lindeboom, 1995; Dwyer and Mitchell, 1999; Kreider, 1999: Crossley and Kennedy, 2002; Benitez-Silva et al., 2004; Lindeboom and Van Doorslaer, 2004; Cai and Kalb, 2006; Lindeboom and Kerkhofs, 2009). Second, there may be unmeas-ured factors (unobserved heterogeneity) related to both the responses to the self-assessed health measures and to the different uses of time, which can introduce bias in the estimated relationships.
We examine time diary data for the following European countries: France (1998), Germany (2001), Italy (2002), the Netherlands (2000 and 2005), Spain (2002), and the UK (2000 and 2005). We offer descriptive evidence on the relationship between health and the time devoted to a range of activities while controlling for demographic and household observable characteristics. We find that a better perception of own health is associated with more time in market work activities during working days, while it is associated with less time in sleep and household production in Germany, Italy, the Netherlands, and Spain for both men and women. For the rest of the uses of time, we find no clear cross-country evidence. These results are consistent with the results obtained by Podor and Halliday (2012) for market work in the USA, but not for non-market work and leisure. The results here are consistent with Gimenez-Nadal and Molina (2015) for market work, non-market work, and sleep, but not for leisure.
By examining data from several countries, our work crucially adds to the study of the relationship between health inequality and time allocation decisions, including the most
recent work by Podor and Halliday (2012), Gimenez-Nadal and Ortega (2013), and Gimenez-Nadal and Molina (2015). Specifically, we are able to improve our under-standing of how better self-reported health status relates to market and non-market work activities, leisure, and personal care for workers in European countries. In con-trast to the reported relationship between health and time allocation decisions in the USA, we fail to find such relationships for home production and leisure in our six countries. Whereas prior research (Garcia-Gómez 2011) has shown that differences in healthcare systems have a significant effect on a range of factors, our findings indicate that differences in healthcare systems do not condition the relationship between the use of time of workers and health status, and we argue that more focus should be placed on analysing differences in tax systems and cultural factors.
Our paper also expands the prior evidence on the relationship between health inequality and the time workers spend in the labour market (Currie and Madrian; 1999; Au et al., 2005; Disney et al., 2006; Barnay, 2010; Jones et al., 2010). If results are similar across different countries, it is difficult to say that neither cultural nor institutional factors are shaping this relationship, shedding light on the possible channels through which health and labour market outcomes are related. Finally, we contribute to the field of health inequalities (Batana 2010; Halliday, 2011 European Commission 2013), a topic that has been largely ignored in the literature. The analysis of how differences in health status are related to the daily lives of individuals proves to be important for policy issues.
The paper is organised as follows. Section 2 describes the data and the variables and presents some descriptive evidence. Section 3 describes our empirical strategy, and Section 4 presents the main results. Section 5 presents a discussion of the main results and some policy implications, while Section 6 sets out our main conclusions.
2 Data, variables, and descriptive evidence
In this paper, we use the Multinational Time Use Survey (MTUS), an ex-post harmonised cross-time, cross-national, comparative time use database coordinated by the Centre for Time Use Research at the University of Oxford.1It is constructed from national randomly sampled time-diary studies, with a common series of background variables and total time spent in 41 activities (Gershuny, 2009). The MTUS provides us with information on individual time use based on diary questionnaires in which individ-uals report their activities throughout the 24 h of the day. The 41 MTUS activities are de-fined as the‘primary’or‘main’activity individuals were doing at the time of the interview. Thus, we are able to add up the time devoted to any activity of reference (e.g. paid work, leisure, TV watching) as‘primary’activity. The advantage of time-use surveys over stylised questions, such as those included in the data bases of ECHP, BHPS, and SOEP (where respondents are asked how much time they have spent, for example, in the previous week, or normally spend each week, on market work or housework, etc.) is that diary-based estimates of time use are more reliable and accurate than estimates derived from direct questions (Juster and Stafford, 1985; Robinson and Godbey, 1997; Bianchi et al., 2000; Bonke, 2005; Yee-Kan, 2008).
The existing time use literature has shown that the time allocation decisions of men and women differ and that the same factors affect men and women differently (Kalenkoski et al., 2005; Aguiar and Hurst, 2007; Connelly and Kimmel, 2009; Gimenez-Nadal and Sevilla, 2012; Gimenez-Nadal and Molina, 2013). Furthermore, Schneider et al. (2012)
find that the responses to health perception questions vary between male and female respondents. Therefore, we carry out our analysis separately by gender.
For the sake of comparison with existing studies (Aguiar and Hurst, 2007; Gimenez-Nadal and Sevilla, 2012), we restrict the sample used throughout our analysis to work-ing individuals between the ages of 21 and 65 (inclusive). We include all individuals whose labour status is “working” according to the variable “empstat” included in the MTUS.2However, despite that we have information on whether the individuals worked part- or full-time, in many other cases, we do not have information about the hours of work per week (11.14 % of the observations), and thus, our selection sample includes both part-time and full-time workers. Also, this limitation in the part- or full-time status prevents us from controlling in our estimated models for the type of participation in the labour market.
For the countries, we select those with information about individual health. To measure the health of individuals, we use the question about self-reported health status included in the survey, where respondents typically answer the question ‘how is your health in general?’ with five possible responses:‘very poor health’(1),‘poor health’(2),‘fair health’ (3),‘good health’(4), and‘very good health’(5). The CTUR team has recoded the categor-ies to include the following values:‘very poor/poor health’(1),‘fair health’(2),‘good health’ (3), and ‘very good health’ (4). The availability of information on health in the surveys leaves us with the following countries: France (1998), Germany (2001-02), Italy (2002-03), the Netherlands (2000 and 2005), Spain (2002), and the UK (2000 and 2005).3 The information gathered by this question is known as the ‘Self-Assessed Health Status’ (SAHS) measure.
Although SAHS measures are increasingly common in empirical research (Deaton and Paxson, 1998; Ettner, 1996; Podor and Halliday, 2012, Gimenez-Nadal and Ortega, 2013; Gimenez-Nadal and Molina, 2015), the literature has identified a number of reasons why self-reported measures of health status may cause biases (e.g. Bound, 1991; Banks and Smith, 2012), as individuals may use health as a justification for leav-ing the labour force early. This phenomenon has been referred to as the ‘justification hypothesis’. When subjective health assessments measure leisure preferences rather than‘true health capacity’, estimates of health effects will tend to be biased in the direc-tion of poorer reported health driving retirement. Those who enjoy their work will downplay their health problems and work longer, while those who dislike their work may exaggerate health problems and retire sooner. Several studies have confirmed the endogeneity of self-reported health measures (Chirikos and Nestel, 1984; Anderson and Burkhauser, 1985; Bazzoli, 1985; Bound, 1991; Haveman et al. 1994; Gimenez-Nadal and Ortega, 2013).
For the classification of time use activities, we follow the prior literature (Burda et al., 2008; Gimenez-Nadal and Sevilla, 2012; Gimenez-Nadal and Molina, 2014, 2015) and define the following time use categories: sleep, personal care, market work, non-market work, and leisure. Additional file 1: Table S2 shows how the activities of the MTUS have been included in the various time-use categories. Figure 1a, b shows, for each country, the overall time devoted to the five time-use activities according to the health status of men and women, respectively. We average, for each country and health status, the time devoted to these activities. For instance, for France, we average the time devoted to sleep, personal care, market work, non-market work, and leisure by men
and women reporting ‘poor health’,‘fair health,’‘good health’, and‘very good health’. For the computation of average values, we use the demographic weights included in the survey.4We then (scatter) plot the average time devoted to the reference activity (y-axis) on the health status of individuals (x-axis). We have also added a linear fit to see the extent to which scatters are distributed following a linear relationship. For both the scatter plot and the linear fit, we must take into account that the number of workers reporting
‘very good’health may be different from the number of workers reporting‘poor’health, for instance. Thus, we need to weight each observation (average time in the reference activity/health status of workers) by the number of diaries included in the calculation of the average time. We include proportional weights in both the scatter plot and the linear fit, where the weights are built as the ratio of the number of diaries to the total number of diaries. This explains why dots have different sizes, as the size of the dots is proportional to the proportion of diaries included.
In the case of sleep time, we observe a negative relationship (a negative slope of the linear fit) between health status and the time devoted to this activity for both men and women, with the only exception being males in the UK, where better health is associ-ated with more time in sleep. Other uses of time that have a negative relationship with health status are personal care and non-market work for both males and females and for all countries, with the exceptions being for personal care of females in Spain and Italy, where better health is associated with more time in this activity. In the case of market work time, we find for both men and women and for all countries a positive relationship between health status and the time devoted to this activity. Finally, for the case of leisure, we find mixed evidence, and we cannot extract a clear pattern across countries.
These graphs also allow us to analyse cross-country differences in the amount of time devoted to the different activities. In the case of men, the most time devoted to sleep is found in France, the Netherlands, and Spain, while the least time is found in Germany.
A.Time allocation and health status of respondents, males
-2
0
2
4
7.5 8 8.5 9 9.5
Time devoted to sleep by males France Linear fit France Germany Linear fit Germany Italy Linear fit Italy The Netherlands Linear fit The Netherlands Spain Linear fit Spain the UK Linear fit the UK
-2 0 2 4 6 1.5 2 2.5 3
Time devoted to personal care by males France Linear fit France Germany Linear fit Germany Italy Linear fit Italy The Netherlands Linear fit The Netherlands Spain Linear fit Spain the UK Linear fit the UK
-2 -1 0 1 2 3 0 2 4 6 8
Time devoted to market work by males France Linear fit France Germany Linear fit Germany Italy Linear fit Italy The Netherlands Linear fit The Netherlands Spain Linear fit Spain the UK Linear fit the UK
-4 -2 0 2 4 1 2 3 4 5
Time devoted to non-market work by males France Linear fit France Germany Linear fit Germany Italy Linear fit Italy The Netherlands Linear fit The Netherlands Spain Linear fit Spain the UK Linear fit the UK
-1 0 1 2 3 4 4 5 6 7 8
Time devoted to leisure by males France Linear fit France Germany Linear fit Germany Italy Linear fit Italy The Netherlands Linear fit The Netherlands Spain Linear fit Spain the UK Linear fit the UK
B.Time allocation and health status of respondents, females
-1 0 1 2 3 8 8.5 9 9.5
Time devoted to sleep by females France Linear fit France Germany Linear fit Germany Italy Linear fit Italy The Netherlands Linear fit The Netherlands Spain Linear fit Spain the UK Linear fit the UK
-2 -1 0 1 2 3 1.8 2 2.2 2.4 2.6 2.8 Time devoted to personal care by females France Linear fit France Germany Linear fit Germany Italy Linear fit Italy The Netherlands Linear fit The Netherlands Spain Linear fit Spain the UK Linear fit the UK
-2 -1 0 1 2 3 2 3 4 5 6
Time devoted to market work by females France Linear fit France Germany Linear fit Germany Italy Linear fit Italy The Netherlands Linear fit The Netherlands Spain Linear fit Spain the UK Linear fit the UK
-1 0 1 2 3 3.5 4 4.5 5
Time devoted to non-market work by females France Linear fit France Germany Linear fit Germany Italy Linear fit Italy The Netherlands Linear fit The Netherlands Spain Linear fit Spain the UK Linear fit the UK
-2
0
2
4
3.5 4 4.5 5 5.5 6 Time devoted to leisure by females France Linear fit France Germany Linear fit Germany Italy Linear fit Italy The Netherlands Linear fit The Netherlands Spain Linear fit Spain the UK Linear fit the UK
For personal care, males in Italy devote the most time to these activities, followed by Germany and Spain, while the least times are found in the Netherlands and the UK. Regarding time in the labour market, there are few differences, as most countries have average values around 7 h per day, although the most time devoted to these activities is found in Italy and the least time in Germany. Considering non-market work, we can define two groups of countries: Germany, the UK, and the Netherlands, where males devote around 2.5 h per day to these activities, and Italy, Spain, and France where males devote around 1.5 h per day to these activities. Finally, in the case of leisure time, the most time devoted to this activity is found for males in the UK, while the least time is found in Italy and Spain. All these cross-country differences are consistent with prior studies (Gimenez-Nadal and Sevilla, 2012).
In the case of women, we observe a larger cross-country dispersion in the different uses of time. Regarding the time devoted to sleep, the most such time is found in France, followed by the Netherlands and the UK. The least time devoted to sleep is found in Italy and Germany. Considering the time devoted to personal care, the most time is found in Italy and Germany, while the least time is found in the UK, followed by the Netherlands. For market work, we can group countries in two categories: the group of Italy, France, and Spain, where female workers devote around 5 h per day to market work activities, and the group of the UK, the Netherlands, and Germany, where female workers devote around 4 h per day to these activities. If we now look at non-market work activities, the most time is found in Italy and Germany, followed by Spain, while the least time devoted to these activities is found in France and the UK. Finally, for leisure time, we can group the countries again in two categories, the group of the Netherlands, Germany, and the UK, where female workers spend around 5.25 h per day to leisure, and the group of Italy, Spain, and France where women spend around 4 h per day on leisure. These cross-country differences in the range of activities are consistent with Gimenez-Nadal and Sevilla (2012).
If we compare workers according to their gender, we find that men devote compara-tively more time to market work activities, while women devote comparacompara-tively more time to non-market work activities, consistent with prior evidence (Gimenez-Nadal and Sevilla, 2012). Additionally, we find that women in Spain and Italy have comparatively less leisure time than their female counterparts in other countries and less than men in general. This is consistent with prior evidence showing cross-country differences in social norms regarding the gender distribution of total work, defined as the sum of market and non-market work time (Burda et al., 2013). According to this evidence, Mediterranean countries have entrenched gender norms, where women are mostly responsible for housework activities (Sevilla, 2010; Gimenez-Nadal et al., 2012), making women in these countries bear the burden of household chores. Thus, women in these countries add their labour market responsibilities to their household responsibilities, which reduces the amount of leisure. This leads to women enduring a ‘second burden’ or a‘second shift’, and prior evidence finds this especially among working women with children, who have less leisure time (Gimenez-Nadal and Sevilla, 2011).
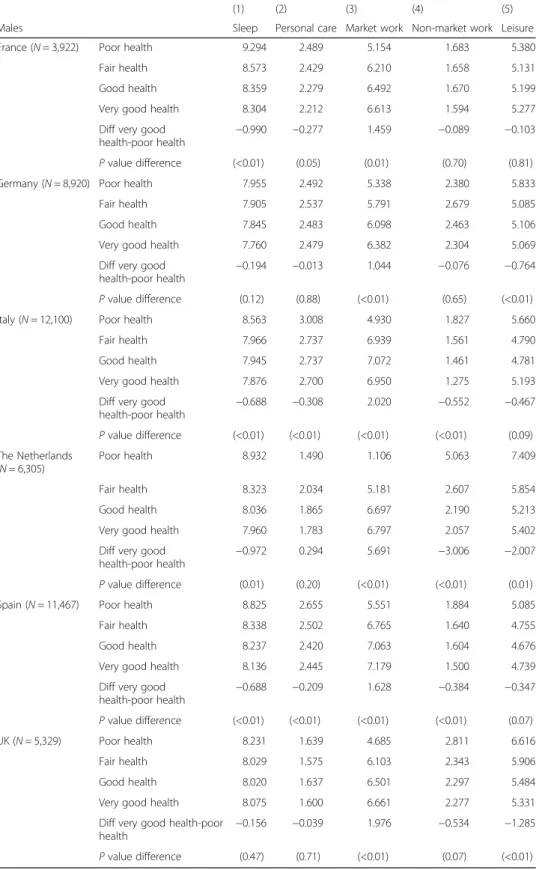
Tables 1 and 2 show, for each country, gender and self-reported health status, the time devoted to the five time use activities, the differences in the time devoted to the reference activity between individuals reporting‘very good health’and‘poor health’and thePvalue of that difference. A positive value of the difference indicates that individuals who report
Table 1Sum stats of time devoted to time-use categories, by self-reported health status, males
(1) (2) (3) (4) (5)
Males Sleep Personal care Market work Non-market work Leisure
France (N= 3,922) Poor health 9.294 2.489 5.154 1.683 5.380
Fair health 8.573 2.429 6.210 1.658 5.131
Good health 8.359 2.279 6.492 1.670 5.199
Very good health 8.304 2.212 6.613 1.594 5.277
Diff very good health-poor health
−0.990 −0.277 1.459 −0.089 −0.103
Pvalue difference (<0.01) (0.05) (0.01) (0.70) (0.81)
Germany (N= 8,920) Poor health 7.955 2.492 5.338 2.380 5.833
Fair health 7.905 2.537 5.791 2.679 5.085
Good health 7.845 2.483 6.098 2.463 5.106
Very good health 7.760 2.479 6.382 2.304 5.069
Diff very good health-poor health
−0.194 −0.013 1.044 −0.076 −0.764
Pvalue difference (0.12) (0.88) (<0.01) (0.65) (<0.01)
Italy (N= 12,100) Poor health 8.563 3.008 4.930 1.827 5.660
Fair health 7.966 2.737 6.939 1.561 4.790
Good health 7.945 2.737 7.072 1.461 4.781
Very good health 7.876 2.700 6.950 1.275 5.193
Diff very good
health-poor health − 0.688 −0.308 2.020 −0.552 −0.467 Pvalue difference (<0.01) (<0.01) (<0.01) (<0.01) (0.09) The Netherlands (N= 6,305) Poor health 8.932 1.490 1.106 5.063 7.409 Fair health 8.323 2.034 5.181 2.607 5.854 Good health 8.036 1.865 6.697 2.190 5.213
Very good health 7.960 1.783 6.797 2.057 5.402
Diff very good health-poor health
−0.972 0.294 5.691 −3.006 −2.007
Pvalue difference (0.01) (0.20) (<0.01) (<0.01) (0.01)
Spain (N= 11,467) Poor health 8.825 2.655 5.551 1.884 5.085
Fair health 8.338 2.502 6.765 1.640 4.755
Good health 8.237 2.420 7.063 1.604 4.676
Very good health 8.136 2.445 7.179 1.500 4.739
Diff very good health-poor health −0.688 −0.209 1.628 −0.384 −0.347 Pvalue difference (<0.01) (<0.01) (<0.01) (<0.01) (0.07) UK (N= 5,329) Poor health 8.231 1.639 4.685 2.811 6.616 Fair health 8.029 1.575 6.103 2.343 5.906 Good health 8.020 1.637 6.501 2.297 5.484
Very good health 8.075 1.600 6.661 2.277 5.331
Diff very good health-poor
health −
0.156 −0.039 1.976 −0.534 −1.285
Pvalue difference (0.47) (0.71) (<0.01) (0.07) (<0.01)
Notes:Standard deviations in parenthesis. The sample is restricted to include part- and full-time male workers between the ages of 21 and 65 (inclusive) included in the Multinational Time Use Study (MTUS) from France, Germany, Italy, the Netherlands, Spain, and the UK. Time-use activities are measured in hours per day; see Additional file1: Table S2 for definitions of time-use categories. Diff very good health-poor health indicates the difference in the time devoted to the reference time-use activity between individuals reporting‘very good health’and individuals reporting‘poor health’;Pvalue of such difference in parentheses
Table 2Sum stats of time devoted to time use categories, by self-reported health status, females
(1) (2) (3) (4) (5)
Females Sleep Personal care Market work Non-market work Leisure
France (N= 3,362) Poor health 9.371 2.827 2.653 4.512 4.637
Fair health 8.820 2.466 4.926 3.872 3.916
Good health 8.601 2.382 5.150 3.831 4.035
Very good health 8.493 2.308 5.235 3.790 4.175
Diff very good health-poor health
−0.878 −0.519 2.582 −0.722 −0.462
Pvalue difference (<0.01) (<0.01) (<0.01) (0.06) (0.26)
Germany (N= 8,701) Poor health 8.149 2.816 3.204 4.571 5.259
Fair health 8.151 2.759 3.829 4.353 4.903
Good health 8.051 2.654 3.974 4.293 5.023
Very good health 7.953 2.617 4.218 4.161 5.044
Diff very good health-poor health
−0.196 −0.200 1.014 −0.410 −0.214
Pvalue difference (0.07) (0.01) (<0.01) (0.02) (0.23)
Italy (N= 8,110) Poor health 8.620 2.519 4.082 4.878 3.880
Fair health 7.979 2.570 5.171 4.738 3.537
Good health 7.979 2.660 5.270 4.254 3.831
Very good health 7.944 2.758 5.035 3.816 4.439
Diff very good
health-poor health − 0.676 0.239 0.953 −1.063 0.559 Pvalue difference (<0.01) (0.02) (0.02) (<0.01) (0.04) The Netherlands (N= 6,737) Poor health 9.582 1.957 2.083 4.514 5.864 Fair health 8.864 2.293 3.253 4.326 5.262 Good health 8.387 2.099 4.101 4.106 5.306
Very good health 8.316 2.008 4.593 3.764 5.319
Diff very good health-poor health
−1.266 0.051 2.510 −0.750 −0.545
Pvalue difference (<0.01) (0.74) (<0.01) (0.08) (0.22)
Spain (N= 7,927) Poor health 8.676 2.436 3.909 4.741 4.239
Fair health 8.181 2.429 5.252 4.280 3.856
Good health 8.117 2.379 5.717 3.891 3.896
Very good health 8.150 2.439 5.656 3.616 4.139
Diff very good health-poor health −0.526 0.003 1.747 −1.125 −0.100 Pvalue difference (<0.01) (0.96) (<0.01) (<0.01) (0.59) UK (N= 5,326) Poor health 8.434 2.103 2.638 4.711 6.062 Fair health 8.503 1.823 4.262 4.055 5.270 Good health 8.349 1.805 4.596 4.030 5.156
Very good health 8.226 1.828 4.757 4.039 5.090
Diff very good health-poor
health −
0.207 −0.275 2.119 −0.671 −0.972
Pvalue difference (0.23) (<0.01) (<0.01) (0.02) (<0.01)
Notes:Standard deviations in parenthesis. The sample is restricted to include part- and full-time female workers between the ages of 21 and 65 (inclusive) included in the Multinational Time Use Study (MTUS) from France, Germany, Italy, the Netherlands, Spain, and the UK. Time-use activities are measured in hours per day; see Additional file1: Table S2 for definitions of time-use categories. Diff very good health-poor health indicates the difference in the time devoted to the reference time use activity between individuals reporting‘very good health’and individuals reporting‘poor health’;Pvalue of such difference in parentheses
having‘poor health’devote less time to the reference activity compared to individuals with
‘very good health’. Negative values of the difference indicate that individuals who report having‘poor health’report more time spent in the reference activity, compared to individ-uals with ‘very good health’. A P value lower than 0.05 indicates that the difference between individuals reporting ‘poor health’ and ‘very good health’ in the overall time devoted to the reference activity is statistically significant at standard levels. Despite that Fig. 1a, b shows a gradient between health status and the uses of time, we must test whether such differences are statistically significant.
We observe clear patterns for the relationship between health status and the time devoted to market work activities in all countries, while the evidence is mixed for the remaining activities. Regarding market work activities, we find that the difference in the daily hours between men reporting ‘poor health’and those reporting‘very good health’ are 1.459, 1.044, 2.020, 5.691, 1.628, and 1.976 h per day in France, Germany, Italy, the Netherlands, Spain, and the UK, respectively, while the differences for women are 2.582, 1.014, 0.953, 2.510, 1.747, and 2.119, respectively. Descriptive evidence shows a negative relationship between poor health and the daily hours devoted to market work activities. In this sense, this relationship not only affects the labour force participation (i.e. lower participation in the labour market for those who report having poor health) but also the number of hours of work for those who participate.
For the hours per day devoted to sleep, we find differences in the daily hours devoted to this activity between men reporting ‘poor health’ and those reporting ‘very good health’in France (−0.990), Italy (−0.688), the Netherlands (−0.972), and Spain (−0.688) and differences for women in France (−0.878), Italy (−0.676), the Netherlands (−1.266), and Spain (−0.526). Regarding personal care, we find differences in the daily hours between men reporting ‘poor health’ and those reporting‘very good health’ in France (−0.277), Italy (−0.308), and Spain (−0.209) and differences for women in France (−0.519), Germany (−0.200), and the UK (−0.275), while women in Italy with ‘poor health’devote more time to this activity (0.239) than those reporting‘very good health’.
When we focus on non-market work, we find differences in the daily hours devoted to this activity between men reporting ‘poor health’ and those reporting ‘very good health’in Italy (−0.552), the Netherlands (−3.006), Spain (−0.384), and the UK (−0.534), while for women, these differences are found in Germany (−0.410), Italy (−1.063), Spain (−1.125), and the UK (−0.671). For leisure, the evidence is mixed, and while we find dif-ferences in the daily hours devoted to this activity between men reporting ‘poor health’ and those reporting ‘very good health’for men in Germany (−0.764), the Netherlands (−2.007), and the UK (−1.285), for women, we find a negative difference for the UK (−0.972) and a positive one for Italy (0.559).
Thus, while we find consistent cross-country evidence on the negative relationship between bad health and daily work hours, for the remaining activities, the evidence is far from robust. However, here, demographic factors may condition the time devoted to the different activities. Accordingly, in the next section, we estimate models to control for the observed heterogeneity of individuals.
3 Empirical strategy
We estimate lineal regressions on the time devoted to sleep, personal care, market work, non-market work, and leisure (although results using the Tobit model are
consistent and available upon request).5The statistical model is as follows. For a given individual ‘i’ and country ‘j’ (j= 1,2…5), let Sij, PCij, MWij, NMWij and Leisureij represent the daily hours that the individual reports being spent onsleep,personal care,
market work, non-market work, and leisure. LetXij be a vector of socio-demographic characteristics, and letεsij,εpcij,εmwij,εnmwijand εlijbe random variables that represent unmeasured factors. We estimate the following equations:
Sij¼αsþβs1SAHSijþβs2XijþαsDaynijþδsMonthkij þεsij; ð1Þ
PCij¼αpcþβpc1SAHSijþβpc2XijþαpcDaynij þδpcMonthkij þεpcij; ð2Þ
MWij¼αmwþβmw1SAHSijþβmw2XijþαmwDaynijþ þδmwMonth
k
ij þεmwij; ð3Þ
NMWij¼αnmwþβnmw1SAHSijþβnmw2XijþαnmwDaynij þδnmwMonth
k
ijþεnmwij; ð4Þ
Lij¼αlþβl1SAHSijþβl2XijþαlDaynijþδlMonth
k
ij þεlij; ð5Þ
where SAHSijis the variable indicating the self-reported health status of individual‘i’in country ‘j’, Xijis a vector of personal and household characteristics, Daynij is a vector of day-of-week dummy variables (ref.: Saturday, n= 6), and Monthk
ij is a vector of month
dummy variables (ref.: December, k= 11). These dummy variables take value‘1’if the diary of individual ‘i’in country ‘j’refers to the nth day/kth month and‘0’otherwise. Thus, reference diaries refer to Saturdays in December. In the case of the Netherlands, the survey was carried out during October only, and thus we do not include dummies to control for the month of the diary.
The vector Xij includes personal and household characteristics (Hallberg and Klevmarken, 2003; Kalenkoski et al., 2005, 2009; Kimmel and Connelly, 2007; Connelly and Kimmel, 2009; Gimenez-Nadal and Molina, 2013): age and its square, secondary and university education, the number of children under 18 in the household, household size, whether the youngest child is under 5, whether the youngest child is 5–12, whether the youngest child is 13–17, and civil status (ref.: not in couple).6
Following Goryakin et al. (2014) as an alternative analysis, we create the‘good health’ variable that takes value‘1’if individuals reported‘good’or‘very good’health, and value
‘0’when individuals report‘poor’and ‘fair’health, and we include this dummy variable in Eqs. (1) to (5) as a measure of self-reported health. We transform the dependent variable to its log form, so that coefficients can be interpreted as follows: the dependent variable changes by 100*(coefficient) per cent for a one-unit increase (i.e. changes from
‘poor health’to ‘fair health’, from‘fair health’to ‘good health’, and from‘good health’to
‘very good health’) in the independent variable, while all other variables in the model are held constant.
4 Results
Tables 3 and 4 show the SAHS and good health coefficients obtained from estimating Eqs. (1) to (5) on the time devoted to sleep, personal care, market work, non-market work, and leisure for men and women, respectively.7Regarding results for men, we ob-serve that in all countries, both the SAHS and the good health variables are associated with increases in the time devoted to market work and in most countries are negatively
related to sleep and non-market work, while for leisure and personal care the results are not robust across countries. These results are consistent with the results obtained by Podor and Halliday (2012) for market work and leisure in the USA, but not for non-market work, given that those authors find that better health is associated with large positive effects on home production.
Specifically, and focusing on the SAHS variable, an increase of one category in the health status of men is associated with decreases in the time devoted to sleep of 1.7, 1.2, 0.6, 1.6, and 1.3 % in France, Germany, Italy, the Netherlands, and Spain, respectively, increases in the time devoted to market work of 6.3, 3.7, 11.4, 7.6, and 6.1 % in France, Germany, the Netherlands, Spain and the UK, and decreases in the time devoted to non-market work of 2.1, 2.0, 7.1, and 2.5 in Germany, Italy, the Netherlands, and Spain. For the remaining time use activities, an increase of one category in the health status of men is associated with de-creases in the time devoted to personal care of 1.4 and 2.5 % in France and the Netherlands and in the time devoted to leisure of 2.8 and 3.8 % in the Netherlands and the UK. We observe that the strongest associations between health status and the time devoted to market and non-market work are found in the Netherlands and Spain.
Results for women are very similar to those of men, as we observe that in all countries, both the SAHS and the good health variables are associated with decreases in the time devoted to sleep and increases in the time devoted to market work, and in the majority of countries, there is a negative relationship between health status and non-market work time. Considering the time devoted to personal care and leisure, the cross-country Table 3Estimates of the effect of health status on various time-use categories using MTUS data, males
(1) (2) (3) (4) (5) (6) (7) (8) (9) (10)
Sleep Personal care Market work Non-market work Leisure
Males Sahs Good
health Sahs Good health Sahs Good health Sahs Good health Sahs Good health France (N= 3,922) −0.017a −0.029a −0.014b −0.036c 0.063a 0.128a −0.006 −0.011 −0.004 −0.008 (0.005) (0.009) (0.007) (0.014) (0.021) (0.041) (0.014) (0.027) (0.013) (0.025) Germany (N= 8,920) −0.012a −0.013c 0.004 −0.002 0.037a 0.046c −0.021c −0.043a −0.010 −0.002 (0.003) (0.005) (0.005) (0.008) (0.014) (0.022) (0.010) (0.016) (0.008) (0.012) Italy (N= 12,100) −0.006b −0.004 −0.003 0.002 0.021 0.035 −0.020b −0.024 0.009 −0.008 (0.004) (0.005) (0.005) (0.007) (0.014) (0.021) (0.011) (0.017) (0.009) (0.013) The Netherlands (N= 6,305) −0.016a −0.034a −0.025a −0.049a 0.114a 0.336a −0.071a −0.177a −0.028c −0.098b (0.004) (0.009) (0.007) (0.016) (0.018) (0.043) (0.014) (0.030) (0.011) (0.023) Spain (N= 11,467) −0.013a −0.018a −0.001 −0.011 0.076a 0.142a −0.025a −0.038c −0.008 −0.022 (0.003) (0.005) (0.004) (0.007) (0.012) (0.022) (0.009) (0.016) (0.008) (0.014) UK (N= 5,329) −0.001 0.000 0.006 0.026b 0.061a 0.135a −0.018 −0.026 −0.038a −0.071a (0.004) (0.009) (0.006) (0.014) (0.018) (0.041) (0.013) (0.028) (0.011) (0.022)
Notes:Robust standard errors in parenthesis. The sample is restricted to include part- and full-time male workers between the ages of 21 and 65 (inclusive) included in the Multinational Time Use Study (MTUS) from France, Germany, Italy, the Netherlands, Spain, and the UK. Regressions include age and its square, secondary and university education, the number of children under 18 in the household, household size, whether the youngest child is under 5, whether the youngest child is 5–12, whether the youngest child is 13–17, civil status (ref.: not in couple), day-of-week dummies (ref.: Saturday), and month dummies (ref.: December).Time-use activitiesare measured in hours per day; see Additional file1: Table S2 for definitions of time-use categories
a
Significant at the 99 % level
b
Significant at the 90 % level
c
evidence here is mixed. Again, these results are consistent with the results obtained by Podor and Halliday (2012) for market work and leisure in the USA, but not for non-market work, given that the authors find that better health is associated with large positive effects on home production.
Focusing on the SAHS variable, we find that an increase of one category in the health status of women is associated with decreases in the time devoted to sleep of 1.8, 1.0, 0.9, 2.7, 1.0, and 1.3 % in France, Germany, Italy, the Netherlands, Spain, and the UK, respectively, increases in the time devoted to market work of 7.1, 5.1, 10.6, 6.2, and 8.5 % in France, Germany, the Netherlands, Spain, and the UK, and decreases in the time devoted to non-market work of 2.1, 3.1, 5.4 and 3.7 in Germany, Italy, the Netherlands, and Spain. For the remaining time-use activities, an increase of one category in the health status of women is associated with decreases in the time devoted to personal care of 2.1, 1.6, and 2.0 in France, Germany, and the Netherlands, while associated with an increase of 1.5 % in personal care in Italy and with increases in the time devoted to leisure of 2.8 % in the Netherlands and the UK.
5 Discussion and policy implications
Regarding the factors affecting the relationship between health status and time allocation decisions, differences in healthcare systems have been shown to have a significant effect in a range of factors from health to the probability of employment (Garcia-Gómez 2011), with cross-country differences in social security regimes helping to explain differences in Table 4Estimates of the effect of health status on various time-use categories using MTUS data, females
(1) (2) (3) (4) (5) (6) (7) (8) (9) (10)
Sleep Personal care Market work Non-market work Leisure
Females Sahs Good
health Sahs Good health Sahs Good health Sahs Good health Sahs Good health France (N= 3,362) −0.018a −0.029a −0.021a −0.032c 0.071a 0.113a −0.015 −0.016 0.028c 0.053c (0.004) (0.007) (0.008) (0.013) (0.024) (0.043) (0.014) (0.025) (0.014) (0.027) Germany (N= 8,701) −0.010a −0.013a −0.016a −0.028a 0.051a 0.050c −0.021c −0.026a 0.008 0.022b (0.003) (0.005) (0.005) (0.008) (0.014) (0.023) (0.008) (0.014) (0.007) (0.012) Italy (N= 8,110) −0.009c −0.007 0.015a 0.020c 0.009 0.029 −0.031c −0.050c 0.028c 0.033c (0.004) (0.005) (0.006) (0.008) (0.020) (0.027) (0.012) (0.017) (0.012) (0.017) The Netherlands (N= 6,737) −0.027a −0.059a −0.020a −0.038a 0.106a 0.238a −0.054a −0.109c 0.005 0.026 (0.004) (0.007) (0.007) (0.014) (0.019) (0.036) (0.012) (0.022) (0.010) (0.021) Spain (N= 7,927) −0.010a −0.016c 0.005 −0.004 0.062a 0.126a −0.037a −0.060c 0.005 0.001 (0.003) (0.006) (0.004) (0.008) (0.014) (0.028) (0.009) (0.017) (0.009) (0.018) UK (N= 5,326) −0.013a −0.022a 0.001 0.002 0.085a 0.168a −0.016 −0.039b −0.013 −0.032 (0.004) (0.008) (0.006) (0.013) (0.018) (0.040) (0.011) (0.023) (0.009) (0.020)
Notes:Robust standard errors in parenthesis. The sample is restricted to part- and full-time female workers between the ages of 21 and 65 (inclusive) included in the Multinational Time Use Study (MTUS) from France, Germany, Italy, the Netherlands, Spain, and the UK. Regressions include age and its square, secondary and university education, the number of children under 18 in the household, household size, whether the youngest child is under 5, whether the youngest child is 5–12, whether the youngest child is 13–17, civil status (ref.: not in couple), day-of-week dummies (ref.: Saturday), and month dummies (ref.: December).Time-use activitiesare measured in hours per day; see Additional file1: Table S2 for definitions of time-use categories
a
Significant at the 99 % level
b
Significant at the 90 % level
c
the estimates for the effects of health shocks. However, in our context, we find robust cross-country evidence of the relationship between health status, on the one hand, and the time devoted to market work, sleep, and non-market work, on the other, which may indicate that other factors are also important in explaining such relationships and not only the type of healthcare system. Cross-country differences in social security arrangements are responsible for differences in the health status of individuals, which in turn are related to inequalities in the uses of time.
Another factor that may influence the relationship between health and time allocation decisions is employment regulations. For instance, Barbieri and Cutuli (2015) find a detri-mental effect of unbalanced passive and active labour market policies on inequality, while temporary employment, if compared with unemployment, may still play a role in reducing individual subsequent unemployment risks. Additionally, working conditions seem to affect workers’ mental health (Lucifora and Cottini, 2013). In this sense, working conditions in most European countries have progressively deteriorated, with evidence of growing strain in some countries and selected workforce groups (OECD 2015). Lucifora and Cottini (2013) show a positive causal effect of adverse overall working conditions (working in shifts, performing complex, and intensive tasks and having restricted job autonomy), with labour market institutions and health and safety regulations explaining a significant part of cross-country differences in mental health.
In the current context, we have countries with large differences in labour market regulations, as labour markets are comparatively more regulated in Mediterranean countries, such as Italy and Spain, with strict rules concerning the hiring and firing of workers, and the types of employment arrangements permitted, which results in women in Italy participating less in the labour market (Del Boca, 2002). Also, the rates of temporary and full-time contracts differ by country. Also, working conditions across European countries are different (Lucifora and Cottini 2013). All these factors lead to differences in the health status of workers, and an exploration of our data shows that the health status of workers in the Netherlands and the UK is comparatively higher than in Germany, Italy, and Spain. The average health status reported by male and fe-male workers in the Netherlands (2.189 and 2.124) and the UK (2.309 and 2.270) is comparatively higher than the average health status reported by male and female workers in Germany (1.877 and 1.884), Italy (1.905 and 1.814), and Spain (2.076 and 2.057). To the extent that mental health is an important component of general health, differences in labour market regulations may lead to differences in mental health and, thus, inequalities in the use of time.
Another factor possibly affecting the relationship between health status and the time devoted to market work, non-market work, and leisure is the marginal income tax rate of the country. For instance, Alesina et al. (2005) analyse the differences in the consumption of leisure between Americans and Europeans and find that differences in marginal income tax rates affect the consumption of leisure. They note that the marginal tax rate in Europe is much higher, which makes it less attractive for people to work more hours. In this sense, when individuals suffer a health shock, the effect of it on the time devoted to market work is presumably higher in Europe than in the USA as Europeans may have more incentives (higher taxes to be paid) to stop working. Thus, income taxes affect how individuals allocate their time and the relationship between health status and inequality in the use of time. Furthermore, the price of
leisure activities may also affect the relationship between health status and the uses of time, as higher prices may reduce the elasticity of leisure activities regarding health shocks, making market and non-market work more sensitive to these shocks. Part of the price of leisure activities is composed of value added taxes (VAT) as they increase the price. If the VAT in a country is comparatively higher, the price will probably be higher, and thus the consumption of leisure will be lower. In the specific case of the analysed countries, we find cross-country differences in the marginal income tax rates and VAT, which may have an influence on the elasticity of market work, non-market work, and leisure, regarding health. Given the complexity of tax systems, we leave this issue for future research.
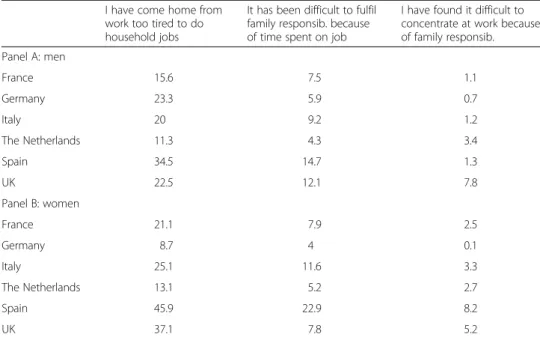
Finally, another factor that may shape the relationship between health status and time allocation decisions is that of household gender roles. Gimenez-Nadal et al. (2012) classify a group of European countries according to the gender inequality in the time devoted to childcare activities, and while France and Germany are classified among the most egalitarian, Mediterranean countries, such as Italy and Spain, are classified among the most inegalitarian, which may indicate that gender roles in those Mediterranean countries impose tougher household responsibilities on women compared to their female counterparts in other countries. Table 5 shows, for three questions related to the work-life balance (e.g. I have come home from work too tired to do household jobs; It has been difficult to fulfil family responsibilities because of time spent on job; I have found it difficult to concentrate at work because of family responsibilities), the percentage of individuals who report having problems several times a week, and we observe, first, that while there are gender differences in Italy, Spain, and the UK, where we find a higher proportion of women reporting having problems related to the work-life balance, the difference is much smaller in the other three countries. Thus, gender roles imposed though the household responsibilities of women in certain countries may be related to inequalities in both health and in the uses of time.
Table 5Work-life balance measures in analysed countries, 2003
I have come home from work too tired to do household jobs
It has been difficult to fulfil family responsib. because of time spent on job
I have found it difficult to concentrate at work because of family responsib. Panel A: men France 15.6 7.5 1.1 Germany 23.3 5.9 0.7 Italy 20 9.2 1.2 The Netherlands 11.3 4.3 3.4 Spain 34.5 14.7 1.3 UK 22.5 12.1 7.8 Panel B: women France 21.1 7.9 2.5 Germany 8.7 4 0.1 Italy 25.1 11.6 3.3 The Netherlands 13.1 5.2 2.7 Spain 45.9 22.9 8.2 UK 37.1 7.8 5.2
Notes:Authors’calculations from questions included in the European Quality of Life Survey 2003, developed by EUROFOUND. Figures represent the percentage of individuals answering‘Several times a week’to the questions shown in heading of Table5
Based on prior research (Garcia-Gómez 2011) showing that differences in healthcare systems have a significant effect on a range of factors, including wages and employment probability, one could conclude that the universalisation of health care would help to reduce such impacts, but our results show that this is not necessarily the case for in-equality in the use of time. Specifically, given the finding that differences in healthcare systems do not condition the relationship between the use of time of workers and health status, the policy implications are that more focus should be placed on analysing differences in tax systems and cultural factors. However, here, we must acknowledge that our analysis is not causal, and we can only talk about correlations between health and uses of time; thus, the results must be interpreted with caution.
6 Conclusions
This paper analyses the relationship between health status and time allocation decisions for workers in six European countries. Using the Multinational Time Use Study, we find that a better perception of own health is associated with less time devoted to sleep and non-market work, while it is associated with more time in market work.
Our paper will be of interest to economists and policymakers given the current general interest in inequality, including in the field of health. Inequalities in health are increasing in Europe, leading to increased vulnerabilities in populations as well as increased differ-ences in health behaviours and outcomes between population groups. Thus, there is an increasing interest of policy makers for health information, as shown by several projects initiated at the international level to analyse how health systems impact on inequality (see, for instance, the ‘Inequalities in health system performance and social determinants in Europe’ project being developed by the WHO/Europe, WHO/Europe Project). To the extent that leisure time has value (Kahneman et al, 2004; Kahneman and Krueger, 2006; Krueger, 2007, Sevilla et al., 2012), the evidence presented in this paper provides a promising line of research for understanding cross-country differences in well-being. Additionally, since unhealthy people work less and devote more time to personal care activities, our results help to explain a possible source of income inequality, both at the individual and the country level.
One limitation of our analysis is that our data is a cross section of individuals, and it does not allow us to identify the effect of health net of both (permanent) individual heterogeneity in preferences and of reverse causality. This is particularly important in our context, as health may be endogenous to time allocation decisions. Alternative datasets with a panel data structure, such as the British Household Panel Survey (BHPS), the Panel Study of income Dynamics (PSID), or the European Union Statistics on Income and Living Conditions (EU-SILC) (where individual fixed effects can be used to net out the effect of individual unobserved heterogeneity) become important at this stage of research. Although they do not contain information on personal care and leisure, they do contain information on market work and housework time, which would allow us to compare and measure the extent to which our results are affected by endo-geneity issues. Given the prior literature on the relationship between health and labour outcomes, we argue that our results show an upper value of the positive relationship between good health and market work hours, while identifying a lower limit for the relationship between personal care and non-market work.
Furthermore, prior findings have shown that there is heterogeneity across selected workforce groups (e.g. the self-employed, managers…) in terms of mental health and psychological well-being (Lucifora and Cottini, 2013), which may lead to differences in the uses of time across workforce groups within countries. We leave a more detailed analysis of the relationship between health and inequality in the use of time for several groups of workers as a future topic of research.
Endnotes 1
Information on the variables and on how to access the data is available on the MTUS website: http://www.timeuse.org/mtus. See Fisher et al. (2011) for a full description of the MTUS documentation. We use version W53 (accessed in October 2010) of the MTUS.
2
Given the focus of the journal on European labour markets, we focus on this group of workers. However, other groups, such as the unemployed and those who do not participate in the labour market, could also be interesting to analyse. But sample selection issues may be important in this context, and thus, we are prevented from analysing other potential groups of workers. Furthermore, workers are more restricted in their daily activities compared to non-workers, as they must fulfil their work and household responsibilities, while non-workers do not have to fulfil their market work responsibilities.However, we have analysed the relationship between health and time allocation decisions for both the unemployed and non-workers, and we still find that better health is associated with less time in sleeping and personal care, and more time in non-market work, in most countries, evidence that is similar to the main results obtained for the sample of workers. Results are available upon request.
3
Table 1 in the Appendix shows the technical information of the surveys included in the study.
4
These weights (PROPWT) are computed to take into account the distribution of the population and days of the week, and thus, all the days of the week are equally represented in the sample. To promote consistency among the datasets, and to prevent surveys from countries with larger populations swamping the surveys from countries with smaller populations, original survey weights are deflated in the computation of PROPWT. More information on how weights are computed can be found in http://www.timeuse.org/ sites/ctur/files/9727/mtus-user-guide-r7-february-2015.pdf.
5
There can be some controversy regarding the selection of alternative models, such as that of Tobin (1958), given the high proportion of non-participation in some activities such as non-market work. Foster and Kalenkoski (2013) compare the use of Tobit and linear models in the analysis of the time devoted to childcare activities, finding that the qualitative conclusions are similar for the two estimation methods.
6
We do not include the labour status of respondents (e.g., part-time or full-time), as it may lead to endogeneity problems since the labour status of individuals probably in-fluences the time devoted to all activities.
7
We do not show the coefficients for other controls (age, education, children, day of the week); they are available upon request.
Additional file
Additional file 1:Appendix: Supplementary Tables(DOCX 15 kb)
Competing interests
The IZA Journal of European Labor Studies is committed to the IZA Guiding Principles of Research Integrity. The authors declare that they have observed these principles.
Acknowledgements
This paper has benefited from funding from the Spanish Ministry of Economics (Project ECO2012-34828). Responsible editor: Martin Kahanec
Author details
1Department of Economic Analysis, Faculty of Economics, University of Zaragoza and CTUR, C/Gran Via 2, 3rd floor,
50005 Zaragoza, Spain.2CTUR, University of Oxford, Oxford, UK.3IZA, Bonn, Germany.
Received: 17 July 2015 Accepted: 7 January 2016
References
Aguiar M, Hurst E (2007) Measuring trends in leisure: the allocation of time over five decades. Quarterly J Economics 122:969–1007
Alesina, A, E Glaeser and B Sacerdote (2005) Work and leisure in the US and Europe: why so different? NBEr Macroeconomics Annual, Vol. 20: 1-100
Anderson KH, Burkhauser RV (1985) The retirement-health nexus: a new measure of an old puzzle. J Human Resources 20:321–330
Au D, Crossley T, Schellhorn M (2005) The effects of health shocks and long-term health on the work activity of older Canadians. Health Econ 14:999–1018
Banks J, Smith J (2012) International comparisons in health economics: evidence from ageing studies. Annual Rev Economics 4:7–81
Barbieri, P, and G Cutuli (2015) Employment protection legislation, labour market dualism, and inequality in Europe, European Sociological Review doi:10.1093/esr/jcv058
Barnay T (2010) In which ways do unhealthy people older than 50 exit the labour market in France?”. European J Health Economics 11:127–140
Batana YM (2010)“Evolution of social inequalities in health in Quebec?”Munich personal RePEc archive paper N° 20710 Bazzoli GJ (1985) The early retirement decision: new empirical evidence on the influence of health. J Human Resources
20:215–234
Becker GS (1965) A theory of the allocation of time. Economic J 75:493–517
Benitez-Silva H, Buchinsky M, Chan HM, Cheidvasser S, Rust J (2004) How large is the bias in self-assessed disability? J Applied Econometrics 19:649–670
Bianchi SM, Milkie MA, Sayer LC, Robinson JP (2000) Is anyone doing the housework? Trends in the gender division of household labor. Soc Forces 79:191–228
Bonke J (2005) Paid work and unpaid work: diary information versus questionnaire information. Social Indicators Res 70:349–368 Bound J (1991) Self-reported versus objective measures of health in retirement models. J Human Resources 26:106–138 Burda M, Hamermesh D, and Weil P (2013) Total work and gender: facts and possible explanations, Journal of
Population Economics 26:239–61
The full reference should be: "Burda, M., D. Hamermesh and P. Weil (2008).“The Distribution of Total Work in the US and EU,”in Working Hours and Job Sharing in the EU and USA: Are Americans Crazy? Are Europeans Lazy? Boeri, Burda and Kramarz (eds.), Oxford Univ. Press
Cai L, Kalb G (2006) Health status and labour force participation: evidence from Australia. Health Econ 15:241–261 Chirikos TN, Nestel G (1984) Economic determinants and consequences of self-reported work disability. J Health Econ 3:117–136 Connelly R, Kimmel J (2009) Spousal influences on parents’non-market time choices. Rev Economics Household 7:361–394 Crossley TF, Kennedy S (2002) The reliability of self-assessed health status. J Health Econ 21:643–658
Currie J, Madrian B (1999) Health, health insurance and the labor market. In: Ashenfelter C (ed) Handbook of Labor Economics, vol 3. Elsevier, Amsterdam
Deaton AS, Paxson CH (1998) Ageing and inequality in income and health. Am Economic Rev Papers and Proceedings 88:248–253
Del Boca D (2002) Low fertility and labour force participation of Italian women: evidence and interpretations, OECD Labour Market and Social Policy Occasional Papers No. 61, OECD
Disney R, Emmerson C, Wakefield M (2006) Ill health and retirement in Britain: a panel data-based analysis. J Health Econ 25:621–649
Dwyer DS, Mitchell OS (1999) Health problems as determinants of retirement: are self-rated measures endogenous? J Health Econ 18:173–193
Ettner SL (1996) New evidence on the relationship between income and health. J Health Econ 15:67–85
European Commission (2013) Health inequalities in the EU—Final report of a consortium., Consortium lead: Sir Michael Marmot Fisher K, Gershuny J, Gauthier A (2011) Multinational Time Use Study: user’s guide and documentation. http://www.
timeuse.org/sites/ctur/files/9727/mtus-user-guide-r7-february-2015.pdf. Accessed 13 January 2016. Foster G, Kalenkoski C (2013) Tobit or OLS? An empirical evaluation under different diary window lengths. Applied Econ
45:2994–3010
Gershuny JI (2009) Veblen in Reverse: evidence from the multinational time-use archive. Social Indicators Res 93:37–45 Gimenez-Nadal JI, Molina JA (2013) Parents’education as a determinant of educational childcare time. J Population Economics
26:719–749
Gimenez-Nadal JI, Molina JA (2014) Regional unemployment, gender, and time allocation of the unemployed. Rev Economics Household 12:105–127
Gimenez-Nadal JI, Molina JA (2015) Health status and the allocation of time: cross-country evidence in Europe. Economic Modelling 46:188–203
Gimenez-Nadal JI, Ortega R (2013) Health status and time allocation in Spain. Applied Econ Letters 20:1435–1439 Gimenez-Nadal JI, Sevilla A (2011) The time-crunch paradox. Social Indicators Res 102:181–196
Gimenez-Nadal JI, Sevilla A (2012) Trends in time allocation: a cross-country analysis. European Economic Rev 56:1338–1359 Gimenez-Nadal JI, Sevilla A, Molina JA (2012) Social norms, partnerships and children. Rev Economics of the
Household 10:215–236
Goryakin, Y, L Rocco, M Suhrcke, B Roberts and M McKee (2014) The effect of health on labour supply in nine former Soviet Union countries, European J of Health Economics 15: 57–68.
Grossman, M (1972a). On the concept of health capital and the demand for health,Journal of Political Economy80, 223-255 Grossman, M (1972b). The demand for health: a theoretical and empirical investigation (Columbia University Press for
the National Bureau for Economic Research)
Hallberg D, Klevmarken A (2003) Time for children: a study of parent’s time allocation. J Population Economics 16:205–226 Halliday T (2011) Health inequality over the life-cycle. The BE J Economic Analysis and Policy 11:5
Haveman R, Wolfe B, Kreider B, Stone M (1994) Market work, wages, and men’s health. J Health Econ 13:163–182 Hochschild A (1990) The second shift. Avon Books, New York
Jones A, N Rice and Roberts (2010) Sick of work or too sick to work? Evidence on self-reported health shocks and early retirement from the BHPS, Economic Modelling 27: 866-880
Juster T, Stafford FP (1985) Time, goods, and well-being. Institute for Social Research, Ann Arbor
Kahneman D, Krueger AB (2006) Developments in the measurement of subjective well-being. J Economic Perspectives 20:3–24 Kahneman D, Krueger AB, Schkade D, Schwarz N, Stone A (2004) A survey method for characterizing daily life
experience: the day reconstruction method. Science 3:1776–1780
Kalenkoski C, Ribar D, Stratton L (2005) Parental childcare in single parent, cohabiting, and married couple families: time-diary evidence from the United Kingdom. American Economic Rev 95:194–198
Kalenkoski C, Ribar D, Stratton L (2009) The influence of wages on parents’allocations of time to child care and market work in the United Kingdom. J Population Economics 22:399–419
Kerkhofs M, Lindeboom M (1995) Subjective health measures and state dependent reporting errors. Health Econ 4:221–235 Kimmel J, Connelly R (2007) Mothers’time choices: caregiving, leisure, home production, and paid work. J Human
Resources 42:643–661
Kreider B (1999) Latent work disability and reporting bias. J Human Resources 34:734–769
Krueger AB (2007) Are we having more fun yet? Categorizing and evaluating changes in time allocation. Brookings Papers Economic Activity 2:193–217
Lindeboom M, Kerkhofs M (2009) Health and work of the elderly: subjective health measures, reporting errors and the endogenous relationship between health and work. J Applied Econometrics 24:1024–1046 Lindeboom M, Van Doorslaer E (2004) Cut-point shift and index shift in self-reported health. J Health Econ 23:1083–1099 Lucifora C, Cottini E (2013) Mental health and working conditions in Europe. Industrial Labor Relations Rev 66:958–988 OECD (2015) Statistics in Focus
Podor M, Halliday TJ (2012) Health status and the allocation of time. Health Econ 21:514–527
Robinson JP, Godbey G (1997) Time for life: the surprising ways Americans use their time. The Pennsylvania State University Press, University Park, Pennsylvania
Schneider U, Pfarr C, Schneider BS, Ulrich V (2012) I feel good! Gender differences and reporting heterogeneity in self-assessed health. European J Health Economics 13:251–265
Schor J (1991) The overworked American: the unexpected decline of leisure. Basic Books, New York
Sevilla A (2010) Household division of labour and cross-country differences in household formation rates. J Population Economics 23:225–249
Sevilla A, Gimenez-Nadal JI, Gershuny JI (2012) Leisure inequality in the United States: 1965–2003. Demography 49:939–964 Stern S (1989) Measuring the effect of disability on labour force participation. J Human Resources 24:361–395 Stiglitz J, Sen A, Fitoussi JP (2009) Report by the commission on the measurement of economic performance and
social progress
Tobin J (1958) Estimation of relationships for limited dependent variables. Econometrica 26:24–36
Yee-Kan M (2008) Measuring housework participation: the gap between“stylised”questionnaire estimates and diary-based estimates. Social Indicators Res 86:381–400