Learning Sciences Faculty Publications
Department of Learning Sciences
2020
Reducing Withdrawal and Failure Rates in Introductory
Reducing Withdrawal and Failure Rates in Introductory
Programming with Subgoal Labeled Worked Examples
Programming with Subgoal Labeled Worked Examples
Lauren Margulieux
Briana B. Morrison
Adrienne Decker
Follow this and additional works at: https://scholarworks.gsu.edu/ltd_facpub Part of the Education Commons
R E S E A R C H
Open Access
Reducing withdrawal and failure rates in
introductory programming with subgoal
labeled worked examples
Lauren E. Margulieux
1*, Briana B. Morrison
2and Adrienne Decker
3Abstract
Background:Programming a computer is an increasingly valuable skill, but dropout and failure rates in introductory
programming courses are regularly as high as 50%. Like many fields, programming requires students to learn complex problem-solving procedures from instructors who tend to have tacit knowledge about low-level procedures that they have automatized. The subgoal learning framework has been used in programming and other fields to breakdown procedural problem solving into smaller pieces that novices can grasp more easily, but it has only been used in short-term interventions. In this study, the subgoal learning framework was implemented throughout a semester-long introductory programming course to explore its longitudinal effects. Of 265 students in multiple sections of the course, half received subgoal-oriented instruction while the other half received typical instruction.
Results:Learning subgoals consistently improved performance on quizzes, which were formative and given within a
week of learning a new procedure, but not on exams, which were summative. While exam performance was not statistically better, the subgoal group had lower variance in exam scores and fewer students dropped or failed the course than in the control group. To better understand the learning process, we examined students’responses to open-ended questions that asked them to explain the problem-solving process. Furthermore, we explored characteristics of learners to determine how subgoal learning affected students at risk of dropout or failure.
Conclusions:Students in an introductory programming course performed better on initial assessments when they
received instructions that used our intervention, subgoal labels. Though the students did not perform better than the control group on exams on average, they were less likely to get failing grades or to drop the course. Overall, subgoal labels seemed especially effective for students who might otherwise struggle to pass or complete the course.
Keywords:Worked examples, Subgoal learning, Programming education, Failure rates
Understanding how to program a computer is becoming a basic literacy skill (Scaffidi et al., 2005). The idea of computer literacy is shifting from being only a consumer of technology (e.g., using Microsoft Office and browsing the Internet) to also including being a producer of tech-nology (e.g., writing or adapting computer programs and making websites). Programming enables people to de-velop solutions that increase efficiency in their personal
and professional lives, and software development is an in-demand career path in many sectors (US Bureau of Labor Statistics,2017).
To meet the demand for programming skill, many learners engage in formal programming instruction, in-cluding tens of thousands of students enrolling in coding boot camps or introduction to programming courses at universities. Though opportunities to learn to program are growing, these opportunities have high withdrawal and failure rates. Students continue to withdraw or fail introductory programming courses at rates of 30–50% (Bennedsen & Caspersen,2007; Bennedsen & Caspersen,
© The Author(s). 2020Open AccessThis article is licensed under a Creative Commons Attribution 4.0 International License, which permits use, sharing, adaptation, distribution and reproduction in any medium or format, as long as you give appropriate credit to the original author(s) and the source, provide a link to the Creative Commons licence, and indicate if changes were made. The images or other third party material in this article are included in the article's Creative Commons licence, unless indicated otherwise in a credit line to the material. If material is not included in the article's Creative Commons licence and your intended use is not permitted by statutory regulation or exceeds the permitted use, you will need to obtain permission directly from the copyright holder. To view a copy of this licence, visithttp://creativecommons.org/licenses/by/4.0/.
* Correspondence:[email protected]
1Department of Learning Sciences, Georgia State University, Atlanta, GA 30302-3978, USA
2019), often because they find the material too difficult (Margolis & Fisher, 2003). Online tutorials boast mil-lions of users but have attrition rates as high as 90% (Jordan, 2014). Even when learners complete these courses, they still score poorly on tests of basic coding knowledge (Lee & Ko,2015).
It may be that students struggle in introductory pro-gramming instruction because the instructional material used to teach programming overloads students’cognitive resources (Garner,2002; Mason & Cooper, 2012). Better designed materials could enhance learning by reducing unnecessary load (Sweller,2010). The authors addressed this instructional challenge with subgoal labeled worked examples. Worked examples are a common tool in pro-gramming education because they demonstrate how to solve programming problems before students can solve problems for themselves (Renkl & Atkinson, 2003). These worked examples, however, include many pieces of information, primarily the problem-solving procedure, coding concepts, and syntax of the programming lan-guage. Every word and punctuation mark in a worked example can be a source of cognitive load that may not be important in learning to solve problems. To help stu-dents focus on the problem-solving procedure, we added subgoal labels, or short instructional explanations of the purpose of pieces of code. Subgoal labels have been shown to reduce the cognitive load during problem-solving in both mathematics and science (Catrambone,
1998; Chi et al., 1989; Margulieux et al., 2018) and in-crease performance in programming (Margulieux et al.,
2012; Morrison et al.,2015; Morrison et al.,2016). Prior work in programming, however, was conducted primarily in laboratory settings and for only an hour of instruction at a time. In contrast, the guiding research questions for the study were as follows:
1. How do subgoal labeled worked examples affect problem-solving throughout an introductory programming course?
2. Which learner characteristics predict whether subgoal labeled worked examples will be more or less effective?
Literature review
Learning computer programming means learning both the procedures to accomplish various goals and learning the information that is relevant to these procedures (van Merriënboer & Paas, 1990). Expert programmers can easily solve problems because they can automatically detect abstract features of problems for which they have solving schemata, or scripts for problem-solving procedures (Hansen et al., 2013). For example, they can tell when a problem will require a loop and which type somewhat reflexively, leaving their cognitive
resources available to deal with problem-specific details. Programming novices, however, struggle to match prob-lems to problem-solving schemata (Weiser & Shertz,
1983; Wiedenbeck et al.,1993). The difference is reminis-cent of Chi et al.’s (1994) study that found physics novices focused on surface features of problems, like whether they have a ramp, while physics experts focused on structural features, like whether they used Newton’s third law. Simi-larly, programming novices have not developed founda-tional problem-solving schemata and tend to focus on the surface features of problems, like whether the loop is find-ing the sum or the average, not structural features, like whether a for or while loop would be more appropriate.
Cognitive load and worked examples in programming instruction
Instructional design aims to simplify complex skills dur-ing the initial learndur-ing process to help students develop schemata while not overwhelming them. One effective method for instruction is to reduce cognitive load (Renkl & Atkinson, 2003). Cognitive load refers to the use of cognitive resources in working memory (Sweller, 1988). Cognitive load theory considers the balance between total resources available in working memory and re-sources demanded by the task (Sweller, 2010). Sources of cognitive load are distinguished by whether they are necessary for the concept or procedure. Intrinsic cogni-tive load is inherent in the procedure, such as applying Newton’s third law to a physics problem or applying a while loop to a program. In contrast, extraneous cognitive load is incidental to the problem or learning environment but not inherent in the procedure, such as a physics prob-lem involving a ramp or a program finding the average of a list of numbers. Intrinsic cognitive load can be changed only by changing the knowledge of the learner or chan-ging the task, such as providing part of a solution for a learner, but extraneous load can be changed through in-structional design techniques (Sweller,2010).
A common tool for reducing cognitive load in pro-gramming instruction is using worked examples to model problem solving instead of asking students to write code from scratch (Leppink et al., 2014). Worked examples constrain the learner’s search space. When studying the worked example, the learner has only to de-termine how the example goes from one step to the next—a very reduced search space which is a means-end search (i.e., they know the result and must only find a path to get to that one end). This instructional strategy reduces the amount of cognitive processing required from the learner (Sweller,2011).
Worked examples, however, can lead to shallow pro-cessing by learners who focus on the details of the ex-ample instead of the structure of the problem solution. Focusing on superficial details of the example causes
learners to ineffectually store procedural knowledge around superficial details instead of procedural schemata (Eiriksdottir & Catrambone,2011). To promote structural processing of worked examples and, thus, improve reten-tion and transfer, designers can manipulate worked exam-ples to promote subgoal learning. Subgoal learning refers to a strategy used predominantly in STEM fields that helps students deconstruct problem-solving procedures into subgoals, structural parts of the overall procedure, to better recognize the fundamental components of the problem-solving process and build schemata (Atkinson et al.,2003; Catrambone,1998).
Subgoal labeled worked examples
Subgoal labeling is a technique used to promote subgoal learning that has been used to help learners recognize the fundamental structure of the procedure being exemplified in worked examples (Catrambone,1994,1996,1998). Subgoal labels are structure-based instructional explanations that de-scribe the subgoal of a set of steps in a worked example to the learner. Studies (Atkinson, 2002; Atkinson & Derry,
2000; Catrambone1994,1996,1998; Margulieux & Catram-bone,2016; Margulieux et al., 2018; Morrison et al.,2015) have consistently found that subgoal-oriented instructions improved problem-solving performance across a variety of STEM domains, such as programming and statistics.
Within programming, an example assignment state-ment may look like this:
C = A + B * D/E;
For a novice programmer, there are several steps volved in determining exactly how the computer will in-terpret this statement. The major subgoals (for Java and many other typed programming languages) are deter-mining the value and data type for the expression on the right-hand side of the assignment operator (=) and de-termining the data type of the variable on the left-hand side of the assignment operator. For determining the data type and value of the expression on the right-hand side, the value and data type of each variable must be determined, the order of operations must be determined, and then the calculation occurs. An experienced pro-grammer does not necessarily break down the right side of the equation into these functional steps while pro-gramming because they have automatized the process, making their cognitive load while solving the problem much less than that of a novice.
Novice programmers find it much easier to remember how to evaluate an assignment statement if they break down the task into manageable pieces. A focus on deter-mining the parts of the assignment statement is much less overwhelming than an outcome-focused problem statement like“evaluate the assignment statement,” lead-ing to less flounderlead-ing for students who do not know where to start (Margulieux & Catrambone, 2016). In
addition, because novices who learn subgoals follow func-tional steps rather than a specific step from one example solution, they find it easier to then transfer their knowledge to other problems of the same type (Margulieux et al.,
2012; Morrison et al.,2015). Emphasizing subgoal learning has helped college students to retain knowledge longer and solve novel problems more accurately (Catrambone,1998; Margulieux et al.,2012).
By helping learners organize information and focus on the structural features of worked examples, subgoal labels are believed to reduce the extraneous cognitive load that can hinder learning but is inherent in worked examples (Atkinson et al., 2000). Worked examples introduce extraneous cognitive load because they are ne-cessarily specific to a context, and students must process the incidental information about the context, even though it is not relevant to the underlying procedure (Sweller, 2010). Subgoal labels can reduce the focus on these incidental features by highlighting the fundamental features of the procedure (Atkinson et al.,2000).
Identifying subgoals for introductory programming and designing worked examples
To select the programming topics for which to create subgoal labeled worked examples, the authors compared several introductory programming textbooks. At this stage in the project, we considered only textbooks fo-cused on teaching this material in the Java programming language. After tallying the number of times that each topic appeared across textbooks, the most common topics were expressions, selection statements, loops, methods, objects/classes, and arrays. Each of these topics was split into evaluating (i.e., reading or tracing existing code) and writing code. For methods, this split translated into calling and writing methods, and for objects/class, this split translated to using objects and writing classes.
To identify the subgoals in all 12 of these topics, the authors used the Task Analysis by Problem Solving (TAPS) protocol (Catrambone,2011). A detailed account of our application of the TAPS protocol in this project can be found in Margulieux et al. (2019), as well as a complete list of the subgoals identified and subgoal la-bels used. As a summary of this process, the TAPS protocol involves a subject matter expert and an analyst. The purpose of TAPS is for the subject matter expert to work through problems, describing how they are solving them, while the analyst creates a complete list of proced-ural steps for solving problems of a particular type. The value of TAPS is that the analyst identifies procedural knowledge that the subject matter expert has automa-tized and asks questions to help the subject matter ex-pert verbalize these processes. The analyst can identify automatized knowledge when he asks the subject matter expert why she took a certain step, and the subject
matter expert says something akin to, “that’s how it’s done,” or “based on intuition.” The task analysis is complete when the analyst can solve any novel problem using only the identified procedural steps and any de-clarative knowledge that is necessary. The identified steps become subgoal labels in worked examples. In this project, the subject matter expert was author Morrison, who has 24 years of experience teaching introductory programming, and the analyst was author Margulieux, who has 7 years of performing the TAPS protocol in various domains, including programming.
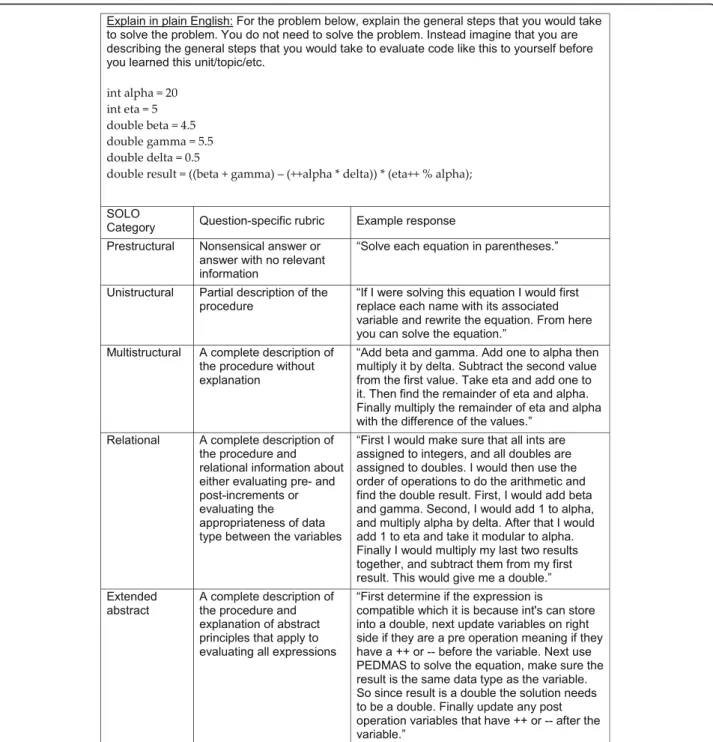
In a typical worked example for evaluating or writing se-lection statements, the student would get the problem and each step taken to solve the problem. Instructors typically walk students through the example but would likely have trouble articulating automated procedural knowledge, such as why a step was taken (Atkinson et al.,2003). Therefore, the authors added subgoal labels, as identified through the TAPS protocol, to worked examples as short instructional explanations of the procedural knowledge. In Fig. 1, the problem is evaluating a selection statement. An instructor, as a programming expert, likely considers solving this prob-lem a single functional step. Through TAPS, however, the authors found three functional steps: diagram which state-ments go together; for if statement, determine whether true or false; and follow the correct branch. The step for diagramming is particularly important for novices once
statements get more complicated because novices need practice to automate how to group lines (Hansen, Lums-daine, & Goldstone, 2012). Eventually, these subgoals will become automatized, and the novices will think of the problem as a single procedural step, like their instructor. To examine the effect of subgoal labeled worked examples throughout an introductory programming course, the au-thors compared students who learned with conventional worked examples to those learned with subgoal labels.
Present study
The present study used subgoal labeled worked exam-ples throughout a semester-long introductory program-ming course to explore the long-term and cumulative effects of subgoal labels. The experiment was conducted during Fall 2018 in five sections of a course that used Java at a Midwestern university. This research context provided both the ecological validity of a classroom-based experiment and a high level of experimental con-trol for a quasi-experiment because all sections of the introductory programming course at this university used the same curriculum, timeline for topics, quizzes, and exams. The students can register for any lab section regardless of which lecture section they are enrolled in, further ensuring that instruction is equivalent across sections. Thus, problem-solving performance and grades across sections can be directly compared.
Three of the sections used the instructional materials that are typically used in this course, and the other two sections replaced worked examples with subgoal labeled worked examples. Because the subgoal labeled worked examples developed for this research were aimed to introduce new types of problems and not more advanced procedures within each type, the new materials filled only 5 of 15 weeks of the semester. Other than the worked examples during these 5 weeks, all instruction was the same throughout the courses.
The lecture sections of the course were similar except for the design of worked examples. All sections were led by three, full-time faculty, each with at least a decade of experi-ence teaching intro programming. The course followed a flipped classroom model in which the students watch lec-tures about programming concepts and problem-solving procedures before class time. Then during class time, the instructors would present worked examples and practice problems for the students. Outside of lecture, students had homework assignments and 2-h lab sections with lab assign-ments. They took weekly quizzes and four exams through-out the semester, including a non-cumulative final exam.
The quizzes and exams provided both quantitative and qualitative data to compare the groups. The quizzes in-cluded a question that asked students to explain in plain English how they would solve a given programming prob-lem (i.e., not explain in a programming language). This type of question is common in programming instruction to measure students’problem-solving schemata because it asks students to focus on the procedural components of a solution without focusing on the code of a specific prob-lem (Corney et al.,2011; Sudol-DeLyser,2015). As others in programming instruction have done, these qualitative data were analyzed using the SOLO taxonomy to quantify the results for a large sample size (Lister et al., 2006; Sheard et al., 2008; Whalley et al., 2006). The SOLO (Structure of the Observed Learning Outcome) taxonomy was developed by Biggs and Collis (1982) to analyze how well responses to open-ended questions demonstrated learning objectives based on five levels of complexity:
1. Prestructural—little to no demonstration of understanding
2. Unistructural—single-dimensional understanding 3. Multistructural—multi-dimensional but disjointed
understanding
4. Relational—multi-dimensional and connected understanding
5. Extended abstract—demonstration of understanding based on abstract principles and concepts that can be applied beyond the immediate problem
Using these data to compare the sections with subgoal labeled worked examples to those with conventional
worked examples, the following research questions were addressed:
1. How do subgoal labeled worked examples affect problem-solving throughout an introductory programming course?
2. Which learner characteristics predict whether subgoal labeled worked examples will be more or less effective?
The first research question has been addressed with preliminary data analysis in previous conference papers. Margulieux et al. (2019) focused on the design process for identifying subgoals and designing materials, and simple comparisons between quiz and exam scores were used to demonstrate the efficacy of the new materials. In addition, Decker, Margulieux, and Morrison (2019) focused on the qualitative analysis of explain in plain English responses using the SOLO taxonomy to explore early differences in student problem-solving. This paper builds upon these previous papers by simultaneously considering all data sources and possible interactions to address the first re-search question. More importantly, this paper is the only one to address the second research question by examining the role of learner characteristics in performance. Prior subgoal studies before this project have considered learner characteristics, but they largely found no differences in the context of laboratory studies (Margulieux et al., 2012,
2018; Margulieux & Catrambone, 2016, 2019). Because this study was conducted across a semester in authentic courses, we found many significant predictors of perform-ance based on learner characteristics, and the analyses suggest that subgoal labeled worked examples are most ef-fective for students whose learner characteristics suggest they might be at risk of withdrawing or failing.
Method Research design
The classroom-based quasi-experiment manipulated one variable, the design of worked examples when students were first introduced to types of programming problems: expressions, selection statements, loops, methods, and arrays. Learner characteristics were also collected, in-cluding self-reported reason for taking the course, level of interest the course content, anxiety about course performance, age, gender, race, primary language, family socioeconomic status, academic major, full-time or part-time student status, high school GPA, college GPA, year in school, and prior experience with programming. All except prior experience with programming were col-lected with a single multiple-choice or short-answer question on a demographic survey. To report prior ex-perience, students filled out a matrix that asked them which types of programming experiences they had (i.e.,
self-taught, informal setting, formal setting), during which grades (i.e., elementary, middle, or high school), and how extensive the experiences were (i.e., a day, a week, less than 2 months, or more than 2 months). These learner characteristics were analyzed as possible predictor vari-ables, even though they were not manipulated.
The study collected data on problem-solving perform-ance through two quantitative measures and one qualita-tive measure. The two quantitaqualita-tive measures are grades on the four exams (i.e., product data) throughout the semester and the weekly quizzes (i.e., process data). Only quizzes given during each of the 5 weeks after using the subgoal labeled worked examples were analyzed to focus on the effect of the instructional materials. Qualitative data came from explain in plain English questions on the quizzes. Though given the sample size, these data were analyzed quantitatively after being scored based on the SOLO taxonomy.
Participants
Participants were recruited from five sections of an introduction to programming course, and all measure-ments used for data collection were part of their normal course requirements. A total of 307 students were en-rolled in the course at the beginning of the semester. Students were excluded from analysis if they did not complete at least one weekly quiz or one exam to account for non-participation in the course. A few
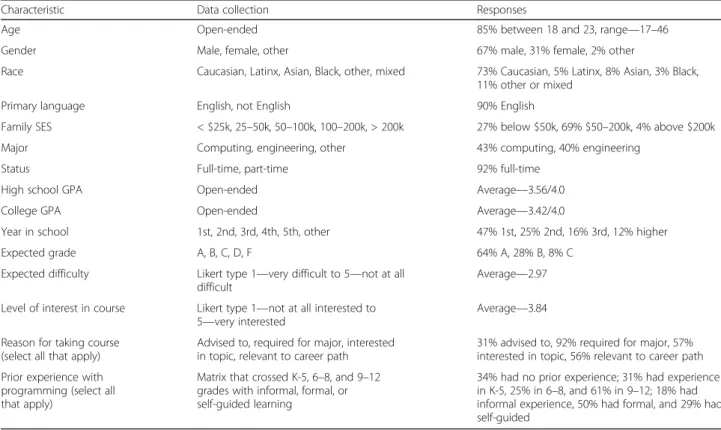
students also opted out of participating in the research study. The final sample size was N= 265 with 120 stu-dents in the two subgoal sections and 145 stustu-dents in the three control sections. One of the control sections was taught 100% online. The online control section was initially analyzed as a separate control group from the in-person sections in case students in the sections were systematically different (e.g., primarily part-time students or primarily non-majors). No differences in demographic characteristics or performance on quizzes or exams were found between the in-person and online control groups, except that the online group tended to be older. Thus, they were combined for final analyses. Participants’ demographic characteristics are summarized in Table1. Differences in characteristics between the subgoal and control group were explored via visual inspection of measures of central tendency (i.e., mean, median, or mode) and variance (i.e., standard deviation, range, or distribution), but no meaningful differences were found. The characteristics of this sample seem representative of the population of students at public universities who are taking introductory programming courses.
Data collection and analysis
The two measures of problem-solving performance were five quizzes and four exams. Quizzes included multiple-choice, short answer, and explain in plain English ques-tions. Exams included multiple-choice (a third to half of
Table 1Demographic and learner characteristics of participants
Characteristic Data collection Responses
Age Open-ended 85% between 18 and 23, range—17–46
Gender Male, female, other 67% male, 31% female, 2% other
Race Caucasian, Latinx, Asian, Black, other, mixed 73% Caucasian, 5% Latinx, 8% Asian, 3% Black, 11% other or mixed
Primary language English, not English 90% English
Family SES < $25k, 25–50k, 50–100k, 100–200k, > 200k 27% below $50k, 69% $50–200k, 4% above $200k Major Computing, engineering, other 43% computing, 40% engineering
Status Full-time, part-time 92% full-time
High school GPA Open-ended Average—3.56/4.0
College GPA Open-ended Average—3.42/4.0
Year in school 1st, 2nd, 3rd, 4th, 5th, other 47% 1st, 25% 2nd, 16% 3rd, 12% higher
Expected grade A, B, C, D, F 64% A, 28% B, 8% C
Expected difficulty Likert type 1—very difficult to 5—not at all difficult
Average—2.97 Level of interest in course Likert type 1—not at all interested to
5—very interested
Average—3.84 Reason for taking course
(select all that apply)
Advised to, required for major, interested in topic, relevant to career path
31% advised to, 92% required for major, 57% interested in topic, 56% relevant to career path Prior experience with
programming (select all that apply)
Matrix that crossed K-5, 6–8, and 9–12 grades with informal, formal, or self-guided learning
34% had no prior experience; 31% had experience in K-5, 25% in 6–8, and 61% in 9–12; 18% had informal experience, 50% had formal, and 29% had self-guided
the points), short answer, and long answer questions. All questions focused on assessing students’skill in solving problems with programming procedures. Students had 4 days to complete quizzes in an online system, and each exam took 2 h of class time. The programming problems included on the quizzes and exams were either similar to questions presented in class for easier difficulty or questions given on homework assignments for harder difficulty. Each quiz accounted for 0.44% of the students’ overall grade; thus, each quiz was low stakes because it had little effect on students’overall grades. Each test, in contrast, accounted for 7.5% of the students’ overall grade. The datasets used and analyzed during the current study are available from the authors on reason-able request.
The questions on each of the assessments were the same across all sections, as was the grading. Each quiz or exam was graded by the same member of the courses’ instructional team so that all questions were graded by the same person to reduce bias across sections. For the explain in plain English questions, if students wrote a sensical answer, they received full points and did not re-ceive feedback. Then, their de-identified responses were scored by the authors based on the SOLO taxonomy after the course had finished.
To score the explain in plain English questions, the three authors worked concurrently and with the re-sponses blinded so that they did not know which students belonged to the subgoal or control groups. For each question, the scorers first cooperatively examined about 10 responses, looking for examples of each of the five categories. The initial discussions focused on the concepts relevant to the question to help distinguish between the first three categories (prestructural, uni-structural, and multistructural) and the connections among them to distinguish between the advanced two categories (relational and extended abstract). The scorers rated each response and discussed discrepancies until agreement was reached and a general rubric for the dis-tinctions between each category was created (see Fig.2).
After the initial discussion, all three scorers rated 10 more responses before comparing answers, resolving dis-crepancies, and adding details to the rubric when appro-priate. They continued this process for the first 20% of responses. If they reached an acceptable level of interra-ter reliability within the first 20% of responses (based on initial scores, not resolved scores), the remaining re-sponses were scored by one person. If interrater reliabil-ity was not acceptable, they coded an additional 20% of responses and assessed reliability again. One question was thrown out because it was a yes/no type question, and most student responses did not lend themselves to analysis based on the SOLO taxonomy. Of the remaining four questions, three reached acceptable interrater
reliability after the first 40% of responses. The other question never reached acceptable interrater reliability, and each response was compared and discussed by the scorers.
For interrater reliability, the intraclass correlation coeffi-cient of absolute agreement, ICC(A), best suited our pur-pose. It determines whether multiple raters gave a response the same score, which is appropriate for the cat-egories within the SOLO taxonomy. Interrater reliability was deemed sufficient when it reached 0.75 or higher (Koo & Li,2016). The final rubrics for each question and examples of student responses for each category within the SOLO taxonomy can be found in Decker et al. (2019). Student scores on the explain in plain English questions are used as ordinal data, with prestructural being lowest and extended abstract being highest, to compare the sub-goal and control groups.
Students’ quiz and exam scores were calculated three different ways to compare the subgoal and control groups. Given that participation often dwindles through-out introductory programming courses, we needed a way to distinguish between quizzes and exams that were completed or not. Therefore, we calculated three scores for the quizzes and exams:
Average score—includes only quizzes and exams that students completed, excludes zeros for missing assessments
Total score—includes all grades, including zeros for quizzes and exams that students did not complete
Number of assessments—the number of quizzes and exams completed to provide an additional data point to compare the groups.
These scores account for a major source of variance in the data, whether the assessment was taken or not, and allow us to examine retention between groups.
Results and discussion
This section is organized around the two research questions for this study. First, we address the question,“How do sub-goal labeled worked examples affect problem-solving throughout an introductory programming course?” with data from the SOLO scoring, quizzes, and exams. Then, we address the second question,“Which learner characteristics predict whether subgoal labeled worked examples will be more or less effective?” by exploring the effect of demo-graphic and learner characteristics (see Table1) within the context of the results.
Explain in plain English SOLO scores
Scoring based on the SOLO taxonomy provided ordinal data. Having ordinal data means we can argue that scor-ing at higher levels of the taxonomy demonstrates better
understanding than scoring at lower levels, but we can-not use mathematical operations to describe the differ-ence between scores. For example, we cannot argue that the difference between a unistructural and multistruc-tural score is the same as the difference between a multi-structural and relational score, though we can argue that a relational score demonstrates better learner than the others. Therefore, our analysis of SOLO scores relied on descriptive statistics, specifically mode and frequencies of scores in each group. Each set of scores for the
quizzes was analyzed separately because using an aver-age or total of ordinal scores requires mathematical op-erations and, thus, is not valid.
For the first quiz, which was about expressions, the subgoal group scored higher than the control group (see Table 2). The most common score in the subgoal group was relational while the most common score for the control group was multistructural. In addition, 68% of the subgoal group achieved the top two scores at nearly twice the rate of the control group, 37%. Instead, the
control group achieved the bottom two scores at more than twice the rate (27%) of the subgoal group (11%).
The fourth quiz, which was about writing methods, follows a similar pattern as the first quiz (see Table 3). The most common score in the subgoal group was rela-tional while the most common score for the control group was multistructural. Moreover, 66% of the subgoal group gave a relational or extended abstract response, which is again nearly double the percentage in the con-trol group, 34%. The concon-trol group, in contrast, gave prestructural or unistructural responses at six times the rate (31%) of the subgoal group (5%).
For the second quiz, which was about loops, the data have a slightly different pattern, but the subgoal group still scored higher than the control group (see Table 4). Nearly half of the participants in both groups gave a multistructural response (50% for subgoals, 46% for con-trol), making it the most common response for both groups. A higher percentage of subgoal students than control students gave the additional information neces-sary to achieve a relational score (29% vs. 17%). In con-trast, the control group had a higher proportion of responses that were missing relevant information than the subgoal group, earning a unistructural or prestruc-tural score (37% vs. 18%).
The third quiz, which was about nested loops, did not follow the same trend as the other quizzes, and the re-sponses were overall worse than those on the other quiz-zes (see Table5). This quiz was the one that never had sufficient interrater reliability, and the raters discussed each response. The most common response for both groups was unistructural, suggesting that most students were missing relevant information in their answers.
Though we expected that each student would consist-ently earn higher or lower SOLO scores, we found a dif-ferent result. In total, 31 students earned an extended abstract score, and only 6 of them achieved the score twice. In addition, only 7 out of 265 students received scores of only relational or higher. The pattern is the same for the other end of the spectrum. Ten students earned more than one prestructural score, but only four students received scores of only unistructural or lower.
Most students scored a mid-level, multistructural re-sponse at least once, regardless of how poor or strong their other responses were. This finding suggests that SOLO score was not strongly predicted by the student.
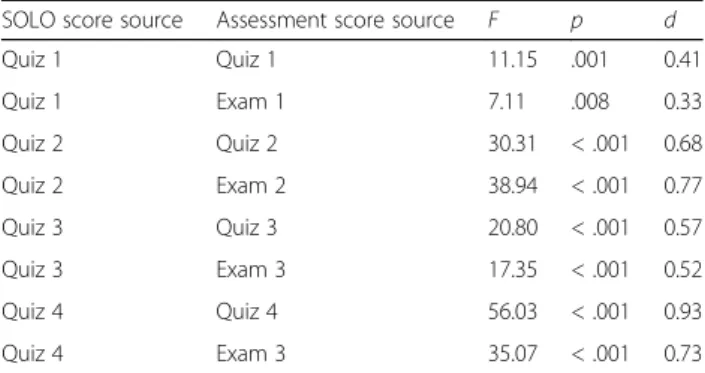
Though SOLO scores were not consistent within students, they were strong predictors of quiz and exam performance. For these analyses, we used ANOVA with quiz score as the outcome variable and SOLO scores as a random (i.e., not manipulated) predictor variable. Though the outcome and predictor variable might seem dependent on each other because the SOLO scores come from the explain in plain English questions on the quizzes, the data are independent because they are scored differently. Because students received full points on the quiz for providing any sensible answer on the ex-plain in ex-plain English question, students who did not provide a sensible answer did not receive a SOLO score. Thus, the explain in plain English question is an added constant (i.e., linear transformation without discrimin-atory value) to all quizzes in the analysis. SOLO scores were matched to the quiz for which they were given and to the next exam (see Table6). The minimum effect size was d = 0.33, and the largest effect size was d = 0.93, showing that higher SOLO scores were strongly related to higher assessment scores. These findings partially validate the SOLO scoring by providing corroborating evidence that higher SOLO scores are associated with better learning outcomes.
Quiz performance
The subgoal group’s performance was compared to the control group’s performance for all three calculations of quiz score: average score (excluding missing quizzes), total score (including missing quizzes), and number of quizzes taken. For all three calculations, the subgoal group performed better than the control group. For the average quiz score, the subgoal group (M = 48%, SD = 14%) outscored the control group (M = 41%, SD = 16%) with a medium effect size, d= 0.44, t(264) = 12.03,p= .001. This finding suggests that the subgoal group per-formed better than the control group based on only quizzes that students took. In addition, the subgoal
Table 2Mode and frequencies between subgoal and control groups on quiz 1
Prestructural Unistructural Multistructural Relational Extended abstract
Subgoal, mode = 4 1 (1%) 8 (10%) 18 (21%) 43 (51%) 14 (17%)
Control, mode = 3 6 (8%) 14 (19%) 27 (36%) 25 (33%) 3 (4%)
Table 3Mode and frequencies between subgoal and control groups on quiz 4
Prestructural Unistructural Multistructural Relational Extended abstract
Subgoal, mode = 4 1 (1%) 4 (4%) 27 (29%) 53 (58%) 7 (8%)
group (M = 12.0, SD = 5.6) performed better on total score than the control group (M = 9.5, SD = 6.3), based on a maximum score of 31 with a medium effect size,d= 0.42,U= 6703,p= .001. For this comparison, the test for homogeneity was statistically significant,p= .03, because the variance of the subgoal group was lower than that of the control group. Thus, we use the non-parametric, more conservative Mann-Whitney test instead of the parametric
ttest, which assumes homogeneity of variance. This find-ing suggests that the subgoal group took more quizzes in addition to performing better on quizzes, and it is sup-ported by the number of quizzes taken in each group. Out of five quizzes, the subgoal group (M = 3.9, SD = 1.2) completed more quizzes than the control group (M= 3.4, SD = 1.6), U = 7126, p = .01. Again, Mann-Whitney is used for a non-parametric test because homogeneity was violated due to the subgoal group having less variance than the control group,p< .01.
To explore whether subgoal materials had a consistent effect on performance over the semester or whether they were more effective on some quizzes than others, we used a repeated measures analysis. Due to the missing data points for some students, only 97 had a complete set of quiz scores that could be used for the analysis. With these limited data, we found no effect of quiz on the scores,F(4, 93) = 2.04,p= .21, nor an interaction between group and quiz, F(4, 93) = 1.31, p = .56. Each quiz tested only the topics that had been discussed in the previous week. Thus, the quizzes were not cumulative except in the way that programming concepts, like math concepts, build upon each other. This finding suggests that the subgoal labeled materials had the same effect size throughout the semes-ter, and they were not more effective at the beginning of the class when students were more novice or later in the class when concepts are more complex. Therefore, the subgoal materials seem to be effective at improving problem-solving performance shortly after a new topic is introduced, as measured by the quizzes.
Exam performance
Students in the subgoal group took more quizzes and performed better on them than the control group, but
the same pattern is not seen in exam scores. For the average exam score, excluding missing exams, the sub-goal group (M = 75%, SD = 15%) did not score statisti-cally better than the control group (M= 72%, SD = 18%) but did achieve the threshold for a small effect,d= 0.20,
U = 7975, p = .24. The variance for the subgoal group was sufficiently less than the control group to violate homogeneity,p= .02. For the total exam score, however, the subgoal group (M = 140.3, SD = 42.4) did perform statistically better than the control group (M = 128.2, SD = 51.6), based on a maximum score of 200 with a small effect size, d = 0.26, t(264) = 4.20, p = .04. This finding suggests that the subgoal group took more exams than the control group but did not perform better on them, and it is supported by the number of exams taken in each group. Out of four exams, the subgoal group (M = 3.7, SD = 0.8) took more than the non-subgoal group (M= 3.5, SD = 1.0) with a small effect size,
d= 0.22,U= 7785,p= .045. The variance of the subgoal group was again sufficiently lower than that of the control group to warrant using Mann-Whitney,p< .01.
In an authentic classroom setting, exam scores are in-fluenced by many factors other than the intervention. Students are often motivated to achieve a minimum grade, and they will change their behaviors to achieve it (Robbins et al.,2004). Even though we did not find that the subgoal group performed better than the control group on the exams, they were more likely to take all of the exams, i.e., not withdraw or fail the course, and they had lower variance in scores, i.e., fewer students perform-ing very poorly on exams. Therefore, it seems possible that receiving subgoal labeled materials helped students who might otherwise withdraw or fail the course to complete it. This possibility is supported by the difference in quiz scores between groups. Students in the subgoal group performed better on quizzes given shortly after learning materials. Therefore, they might have struggled less when initially learning the materials and thus persisted in the course.
To explore this possibility and address our second re-search question, we explored the interactions between learner characteristics and subgoal labeled materials.
Table 4Mode and frequencies between subgoal and control groups on quiz 2.
Prestructural Unistructural Multistructural Relational Extended abstract
Subgoal, mode = 3 5 (5%) 13 (13%) 49 (50%) 28 (29%) 3 (3%)
Control, mode = 3 11 (11%) 25 (26%) 45 (46%) 16 (17%) 0 (0%)
Table 5Mode and frequencies between subgoal and control groups on quiz 3
Prestructural Unistructural Multistructural Relational Extended abstract
Subgoal, mode = 2 8 (9%) 48 (53%) 23 (26%) 8 (9%) 3 (3%)
Though we did not collect self-reported effort or time spent studying because they are too error prone to be re-liable (Kuncel et al.,2005), we collected a large range of demographic and learner characteristics that have pre-dicted performance and risk of withdrawal or failure in prior work (Pea & Kurland,1983; Quille & Bergin,2019; Rountree et al., 2004). From these characteristics (see Table 1), we examined which correlated with perform-ance in our context to identify characteristics that were risk factors for withdrawing or failing the course. Then, we compared students in at-risk groups between the subgoal and control groups to determine whether sub-goal labeled materials helped to mitigate risk factors.
Demographic and learner characteristics
Because demographic and learner characteristics were not manipulated variables, we used correlations to explore their relationship with performance. For these analyses, we used average exam score to represent performance because (1) total exam score was affected by whether students took all exams and did not accurately represent their performance on the other exams, like average exam score, and (2) exams are worth a significant portion of the final grade, unlike quizzes, so they are high stakes enough to encourage students’ best effort. Average exam score was a continuous variable, so if the characteristic was also measured as a continuous variable, we used Pearson’s r
coefficient; if the characteristic used binomial data, we used Spearman’sρcoefficient.
We collected many characteristics (see Table 1) and, thus, ran many correlation analyses. Therefore, we ex-pected that some results, while statistically significant, are most likely due to type I error, or a false positive, es-pecially because we have a large sample size. To reduce the risk of making erroneous conclusions, we focus our discussion on the size of the correlation coefficient to emphasize the strength of the relationship between vari-ables. To be considered a meaningful correlation, it must have anr/ρ> 0.20, which is a small-moderate effect size (Cohen, 1988). In addition, we decreased the p value cutoff to 0.01 to be considered statistically significant. Analyses that did not meet both criteria were not con-sidered meaningful and are generally not reported to save space. However, correlations that are close to the cutoffs and aligned with other findings are reported as corroborating evidence. Correlations that surpass these cutoffs but are not aligned with other findings are likely unreliable and discussed only briefly.
Learner characteristics that correlate with performance across groups
To identify the risk factors for withdrawing or failing the course, we correlated learner characteristics with perform-ance. No demographic characteristics, such as age, gender, or race, correlated with performance, but other learner characteristics did (see Table7). These characteristics are used in later analyses as risk factors, meaning students who score close to the low end of these characteristics were more likely to perform worse on exams. Despite cor-relations between learner characteristics and performance and SOLO scores predicting performance, no learner characteristics correlated with SOLO scores.
We selected cutoffs to determine at-risk status for the continuous variables based on the participants’responses. For expected grade, the cutoff was whether students ex-pected to get an A because most students (64%) said that they expected to get an A in the course. For expected diffi-culty, the cutoff was rating expected difficult as 2 or 1 on a 5-point scale from 1—very difficult to 5—not at all diffi-cult, which is below the mean of 2.97. For high school GPA, the cutoff was below 3.6, which was the mean. For college GPA, the cutoff was below 3.4, which was the
Table 6SOLO scores as predictors for assessment scores
SOLO score source Assessment score source F p d
Quiz 1 Quiz 1 11.15 .001 0.41 Quiz 1 Exam 1 7.11 .008 0.33 Quiz 2 Quiz 2 30.31 < .001 0.68 Quiz 2 Exam 2 38.94 < .001 0.77 Quiz 3 Quiz 3 20.80 < .001 0.57 Quiz 3 Exam 3 17.35 < .001 0.52 Quiz 4 Quiz 4 56.03 < .001 0.93 Quiz 4 Exam 3 35.07 < .001 0.73
Table 7Correlations between learner characteristics and performance for all students and measures of central tendency for each group to demonstrate equivalency
Characteristic Data type Subgoal group Control group r/ρwith performance p
Interest in topic Binomial 63% 58% .24 < .001
Relevant to career Binomial 61% 59% .27 < .001
Expected grade Continuous 62% A, 32% B, 6% C 65% A, 26% B, 8% C .36 < .001
Expected difficulty Continuous M= 3.52 M= 3.65 .30 < .001
High school GPA Continuous M= 3.59/4 M= 3.55/4 .26 .001
mean and indicates that students are closer to a B average than an A average.
Correlations for students with risk factors
We conducted a series of analyses using data from only students who had risk factors to compare subgoal and control groups. We cycled through each risk factor, allow-ing us to explore the effect of subgoal labels on at-risk stu-dents within the paradigm of correlational analyses. For example, for students who expected the course to be diffi-cult, all other risk factors correlated with performance. In some cases, there was a significant correlation for both groups, but the size of the coefficient in the control group was substantially larger (see Table 8). In other cases, the correlation was significant only for the control group. Both findings suggest that the subgoal intervention miti-gated the effect of risk factors on performance.
From the results of analyses based on all risk factors, we have identified three patterns (see Table 9). The first is that expected difficulty of the course correlated with per-formance when accounting for other risk factors, but only in the control group or more strongly in the control group. These correlations were present both when analyz-ing students who had the other risk factors and when ana-lyzing students who expected the course to be difficult. Furthermore, when looking at only students who expected the course to be difficult, the average exam score in the subgoal group was close to the average for all students (74% compared to 75%) while the average in the control group was lower (67% compared to 72%). Therefore, it is likely that subgoal materials had a mitigating effect on this risk factor that prevented multiple risk factors from having a compound effect on performance
The second pattern is that college GPA correlated with performance in the subgoal group but not the con-trol group when analyzing students with risk factors. For students who did not list interest in the topic or rele-vance to career as reasons for taking the course and students with lower high school GPAs, higher college GPA related to higher exam performance only for the subgoal group. Higher college GPA often relates to higher performance because students are often internally motivated to achieve a certain grade (Komarraiu et al.,
2009; Kusurkar et al.,2013). Moreover, when looking at only students with below average college GPAs, the average exam score in the subgoal group was close to the average for all students (76% compared to 75%) while the average in the control group was lower (69% compared to 72%). Perhaps, for students with these risk factors, the subgoal materials allowed them to achieve their goals, as indicated by college GPA.
The last pattern is that age negatively correlated with performance for students with risk factors, but only for the subgoal group. This finding means that younger students with risk factors, such as not indicating interest in the topic or relevant to career, performed better in the subgoal group than the control group. In this case, students who were less than 20 years old in the subgoal group performed better than the overall average (80% compared to 75%) and those in the control group performed equivalently (72% compared to 72%). The mostly likely reason for this differ-ence is the differdiffer-ence in self-regulation and metacognitive skills between more junior and more senior college stu-dents (Kitsantas et al., 2008; Ramdass & Zimmerman,
2011; Strage,1998). Younger students with less developed self-regulation and metacognition, especially if they have
Table 8Correlations between risk factors and performance for students who expected high difficulty. Statistically significant relationships are highlighted with a gray background
risk factors, would likely benefit more from the additional guidance that subgoal labels provide on worked examples while more senior students have developed more strategies for learning with less guidance. In summary, learner characteristics can have strong relationships with perform-ance, and subgoal labels seemed to help students with risk factors to achieve better performance than those with risk factors in the control group.
Comparison of students with missing exams or failing average
To provide another perspective of students who strug-gled in the course, we explored differences between the subgoal and control groups for students who did not complete all exams and students who had an average exam score below 70%, which is failing in this course. These are the students at highest risk of withdrawing or failing the course. In both cases, we found that about half as many students in the subgoal group met these criteria as in the control group.
For students who were missing exams, the control group had higher percentages of students not take exams. The first two exams were before the deadline for with-drawing the course. In the control group, 10 students took
one exam (7%) and 19 took two exams (13%). This rate was halved in the subgoal group in which 6 students took one exam (5%) and 6 took two exams (5%).
In addition to the difference in rates, the average exam scores for students who missed at least one exam were different between groups. The sample size was too small to use inferential statistics meaningfully, but the descrip-tive statistics suggest a meaningful difference. For stu-dents who took all but one exam, the subgoal group had a mean of 69.2% and a standard deviation of 20.8%, and the control group had a mean of 59.2% and a standard deviation of 23.4%. This difference represents a whole letter grade difference between groups. For students who took two exams, the subgoal group (M = 64.0%, SD = 14.4%) again performed almost a letter grade better than the control group (M= 54.6%, SD = 17.2%). For students who took only one exam, the subgoal group (M= 63.0%, SD = 19.6%) had the same advantage over the control group (M = 54.0%, SD = 17.6%). When we consider these results in addition to previous results of exam per-formance that showed lower variance in exam scores in the subgoal group than in the control group, it is likely that fewer students in the subgoal group had failing exam grades earlier in the semester leading to fewer
Table 9Summary of correlations of compound risk factors and performance
Down the left side of the table is the first risk factor, based on factors identified in Table7, used to narrow the analysis to only students at risk based on that factor. Across the top of the table is the second risk factor
Details for risk factor cutoffs and analyses can be found earlier in the results section. The lighter shaded cells indicate the control group had a stronger correlation, and the darker shaded cells indicate that the subgoal group has a stronger correlation
NSnon-significant correlations for both groups *Statistically significant relationship
students withdrawing from the subgoal group than the control group.
To explore this possibility, we also examined students in both groups who had taken all exams and had an average exam score of 70% or lower. This cutoff, in addition to being meaningful in terms of passing or fail-ing, was close to the mean score, 73%. We again found the rate of meeting this criterion was almost double in the control group (n= 64, 44%) as in the subgoal group (n= 30, 25%). Based on findings from exam performance alone, which is a good but not perfect representative of their overall grade, students in the subgoal group were half as likely to withdraw and half as likely to fail than the control group. These findings are important because they indicate subgoals had a significant positive effect on overall course performance, even though we found that subgoals did not statistically improve average exam performance.
Limitations
This study has many of the same limitations that most classroom-based experiments do. First, we were not able to randomly assign students to groups because students select the sections that work best for their schedule, weakening arguments for causal relationships. We attempted to identify any systematic differences between sections by comparing them based on an analysis of an extensive list of demographic and learner characteristics, and we found no meaningful differences.
The second limitation was that the instructor who taught the subgoal group was part of the research team. As with many classroom implementations of instruc-tional manipulations, or at least the initial implementa-tion, having a member of the research team as the instructor ensures fidelity of implementation and that the research team can quickly adapt to errors or over-looked details. Thus, having a researcher as an instructor might have improved the integrity of the instructional manipulation, but it also introduces a potential source of bias. In our case, the researcher is a veteran introductory programming instructor with substantial prior experi-ence. Having substantial prior experience can increase consistency of instruction and reduce potential bias, but some bias is still likely in the data.
Conclusion
Our research questions asked how subgoal labeled in-structions affect problem-solving performance through-out a semester-long programming class and how learner characteristics interacted with that effect. Our results found that the group who learned with subgoals per-formed better than the group who learned with conven-tional instrucconven-tional materials on quizzes within a week of learning new problems-solving procedures. Later
problem-solving performance on exams, however, was equivalent between the two groups, suggesting that sub-goal labels promote better initial performance but not consistently better performance.
These performance findings are qualified by several re-sults that suggest students who were at risk of struggling in the control group were more likely to withdraw from or fail the course than students who were at risk of struggling in the subgoal group. First, the variance in quiz and exam scores was lower in the subgoal group than the control group, meaning that fewer students re-ceived very low grades on these problem-solving assess-ments. Second, students in the subgoal group were more likely than those in the control group to take all quizzes and exams, suggesting that they persisted until the end of the course. Third, for students with risk factors based on their learner characteristics, their performance was more likely to be related to other risk factors in the con-trol group but not the subgoal group, suggesting sub-goals might mitigate risk factors. Last, for students who did miss assignments, their scores on other assignments were more likely to be higher if they were in the subgoal group, suggesting that they were less likely to be strug-gling overall.
Because the intervention is built into the instructional materials that students receive, applying the intervention in classrooms should have a low barrier. To make adop-tion easier, our research group is developing and testing online resources that have subgoal labeled worked exam-ples and practice problems. These resources could be used in class to demonstrate problem-solving procedures with the worked examples and then practice applying procedures with the practice problems. In addition, the resources could be assigned as homework, which would be the least adoption cost for instructors.
Beyond programming instruction, this is the first classroom-based experiment of the subgoal learning framework. Prior work has found subgoal labels to be ef-fective in highly controlled classroom settings, but they were never tested as a long-term intervention or when learners have other pressures to succeed, such as to achieve a minimum grade. In the general context of the subgoal learning framework, this study contributes two important findings. First, as was theorized but not previ-ously tested, the benefit of subgoal learning diminishes as learners gain more experience with the problem-solving procedure. Subgoal labels help point out similarities in problem-solving instances before learners have enough knowledge to recognize similarities for themselves. There-fore, it fits with the framework that students who learn without subgoal labels would eventually catch up to their peers who learned with subgoal labels as they gain more knowledge. The experience of learning without subgoals, however, might be more time-intensive or frustrating than
learning with subgoals, leading to higher withdrawal or fail-ure rates from students who are at risk. Therefore, perform-ance for those who persist might end up the same, but performance for those who do not is substantially different.
The second important contribution to the subgoal learning framework is that the subgoal labeled materials were effective for each new procedure that was intro-duced. For each quiz given after subgoal labeled materials, the subgoal group performed better than the control group. This finding suggests that subgoal labeled materials are effective for new procedures even as the learners gain knowledge and experience in other problem-solving pro-cedures in the domain. Because the average exam scores were equivalent between groups in between these quizzes, we do not expect that the subgoal group gained an advan-tage early in the semester that they maintained through-out the semester, but it is possible. We think that it is more likely, however, that subgoal labels are most effective when students are learning a new procedure that they have little knowledge about and that the efficacy dimin-ishes as students gain more knowledge. Based on the dif-ference in quiz scores, equivalence in exam scores, and difference in withdrawal and failure rates, subgoal labels should be used to improve problem-solving performance, especially by those who might otherwise struggle during initial problem-solving attempts. Subgoal labels are likely not effective for improving problem-solving for those who already know the problem-solving procedure or whose personal learning strategies already help them to master new material.
Abbreviations
ANOVA:Analysis of variance; ICC(A): Intraclass correlation coefficient of absolute agreement; GPA: Grade point average; HS: High school; SES: Socioeconomic status; SOLO: Structure of the Observed Learning Outcome; STEM: Science, technology, engineering, and mathematics; TAPS: Task analysis by problem-solving
Acknowledgements
The authors would like to thank the National Science Foundation for funding this work and the instructional team and students at University of Nebraska Omaha for their support in conducting this research.
Authors’contributions
Authors Decker and Morrison selected the topics to be included in the instructional design and created the worked examples and practice problems. Authors Margulieux and Morrison conducted the task analysis procedure. Author Morrison taught the subgoal sections of the course and, thus, was responsible for most of the daily maintenance of data collection. Author Margulieux conducted the analysis to address the second research question and wrote the first draft of the paper. All authors conducted the analysis to address the first research question and revised drafts of the paper. The authors read and approved the final manuscript.
Funding
This work is funded in part by the National Science Foundation under grants 1712025, 1712231, and 1927906. Any opinions, findings, and conclusions or recommendations expressed in this material are those of the authors and do not necessarily reflect the views of the NSF.
Availability of data and materials
The datasets used and analyzed during the current study are available from the authors on reasonable request.
Competing interests
The authors declare that they have no competing interests.
Author details
1Department of Learning Sciences, Georgia State University, Atlanta, GA 30302-3978, USA.2Department of Computer Science, University of Nebraska Omaha, Omaha, NE, USA.3Department of Engineering Education, University at Buffalo, Buffalo, NY, USA.
Received: 20 December 2019 Accepted: 28 April 2020
References
Atkinson, R. K. (2002). Optimizing learning from examples using animated pedagogical agents.Journal of Educational Psychology, 94(2), 416–427. Atkinson, R. K., Catrambone, R., & Merrill, M. M. (2003). Aiding transfer in statistics:
Examining the use of conceptually oriented equations and elaborations during subgoal learning.Journal of Educational Psychology, 95(4), 762–773. Atkinson, R. K., & Derry, S. J. (2000). Computer-based examples designed to
encourage optimal example processing: A study examining the impact of sequentially presented, subgoal-oriented worked examples. In B. Fishman & S. O'Connor-Divelbiss (Eds.),Fourth International Conference of the Learning
Sciences(pp. 132–133). Mahwah, NJ: Erlbaum.
Atkinson, R. K., Derry, S. J., Renkl, A., & Wortham, D. (2000). Learning from examples: Instructional principles from the worked examples research.Review
of the Educational Research, 70(2), 181–214.
Bennedsen, J., & Caspersen, M. E. (2007). Failure rates in introductory programming.ACM SIGCSE Bulletin, 39(2), 32–36.
Bennedsen, J., & Caspersen, M. E. (2019). Failure rates in introductory programming: 12 years later.ACM Inroads, 10(2), 30–36.
Biggs, J. B., & Collis, K. F. (1982).Evaluating the quality of learning: The SOLO taxonomy (Structure of the Observed Learning Outcome). Academic Press. Catrambone, R. (1994). Improving examples to improve transfer to novel
problems.Memory and Cognition, 22, 605–615.
Catrambone, R. (1996). Generalizing solution procedures learned from examples. Journal of Experimental Psychology: Learning, Memory, and Cognition, 22, 1020–1031.
Catrambone, R. (1998). The subgoal learning model: Creating better examples so that students can solve novel problems.Journal of Experimental Psychology:
General, 127, 355–376.
Catrambone, R. (2011).Task analysis by problem solving (TAPS): Uncovering expert knowledge to develop high-quality instructional materials and training. Paper presented at the 2011 Learning and Technology Symposium. GA, June: Columbus.
Chi, M. T., De Leeuw, N., Chiu, M. H., & LaVancher, C. (1994). Eliciting self-explanations improves understanding.Cognitive Science, 18(3), 439–477. Chi, M. T. H., Bassok, M., Lewis, M. W., Reimann, P., & Glaser, R. (1989).
Self-explanations: How students study and use examples in learning to solve problems.Cognitive Science, 13, 145–182.
Cohen, J. (1988).Statistical power analysis for the behavioral sciences(2nd ed.). Mahwah: Erlbaum.
Corney, M., Lister, R., & Teague, D. (2011).Early relational reasoning and the novice
programmer: Swapping as the hello world of relational reasoning,In
Proceedings of the Thirteenth Australasian Computing Education Conference-Volume 114 (pp. 95-104). Inc: Australian Computer Society.
Decker, A., Margulieux, L. E., & Morrison, B. B. (2019).Using the SOLO Taxonomy to understand subgoal labels effect on problem solving processes in CS1. In Proceedings of the Fifteenth Annual Conference on International Computing Education Research. New York, NY: ACM.
Eiriksdottir, E., & Catrambone, R. (2011). Procedural instructions, principles, and examples how to structure instructions for procedural tasks to enhance performance, learning, and transfer.Human Factors: The Journal of the
Human Factors and Ergonomics Society, 53(6), 749–770.
Garner, S. (2002). Reducing the cognitive load on novice programmers. In Proceedings of 2002 World Conference on Educational Multimedia, Hypermedia,
& Telecommuniations(pp. 578-583). Association for the Advancement of