Cognitive Workload Analysis of Fighter Aircraft Pilots in
Flight Simulator Environment
K. Mohanavelu
#,@,*, S. Poonguzhali
@, D. Ravi
$, Pushpendar K. Singh
$, Mistu Mahajabin
$,
K. Ramachandran
$, Upendra K. Singh
#, and Srinivasan Jayaraman
!#DRDO- Defence Bioenginnering & Electromedical Laboratory, Bengaluru - 560 093, India @Centre for Medical Electronics, Anna University, Chennai - 600 025, India $DRDO-Defence Institute of Psychological Research Laboratory, Delhi - 110 054, India !Medical Device and Development, Tata Consultancy Services, Bengaluru - 560 066, India
*E-mail: [email protected] AbStrACt
Maintaining and balancing an optimal level of workload is essential for completing the task productively. Fighter aircraft is one such example, where the pilot is loaded heavily both physically (due to G manoeuvering) and cognitively (handling multiple sensors, perceiving, processing and multi-tasking including communications and handling weapons) to fulfill the combat mission requirements. This cognitive demand needs to be analysed to understand the workload of fighter pilot. Objective of this study is to analyse dynamic workload of fighter pilots in a realistic high-fidelity flight simulator environment during different flying workload conditions. The various workload conditions are (a) normal visibility, (b) low visibility, (c) normal visibility with secondary task, and (d) low visibility with secondary task. Though, pilot’s flying performance score was good, the physiological measure like heart rate variability (HRV) features and subjective assessment (NASA-TLX) components are found to be statistically significant (p<0.05) between tasks. HRV features such as SD2, SDNN, VLF and total power are found to be significant at all task load conditions. The features LFnu and HFnu are able to differentiate the effect of low visibility and secondary cognitive task, which was imposed as increased task in this study. This result benefits to understand the pilot’s task and performance at each flying phase and their cognitive demands during dynamic workload using HRV, which could assist pilot’s training schedule in optimal way on simulators as well as in actual flight conditions.
Keywords: Pilot cognitive workload; HRV; NASA-TLX; Fighter pilots; Flight simulator
1. IntroduCtIon
Over many decades, statistics on aircraft crash reveals1,2 that the human error, particularly mental stress and loss of situational awareness experienced by pilots are the cause
for plane crash. Though technology growth has contributed towards enhancement in aviation safety, the pilot’s workload requirements are superseded by the combat mission requirements. Pilots have to be trained efficiently to match with advancements in fighter aircrafts, handling weapons,
communication systems in coordination with other pilots
and ground control systems in increased tactical battlefield environments. In-field pilots were exposed to counter G forces
(acceleration), which demands extreme physical and cognitive loading, if not countered properly, the pilot will enter into grey out, blackout zone and G-induced loss of consciousness3
(G-LOC). As an effect, pilots may also experience various
neurological symptoms, seizure, spinal compression and
hemorrhages. So, it is essential to understand pilot’s cognitive workload (PCWL) during dynamic tasks and its influence
towards performance.
Several researches have been contributed to understand workload assessment, for car drivers, industrial workers, whose job nature follows a set routine with little variation4-6.
To author’s knowledge, few research group have contributed to understand the cognitive role in fighter aircraft pilots, whose
life is always under threat and high risk. Pilot uses past and current information to build a mental picture of the current and future events, where higher cognitive brain regions are involved for actions (top-down approach). It shall be stated
that the workload of pilot is not an intrinsic attribute of a pilot’s brain, but rather appears from the requirements, challenges
under which a task is performed, skills/training, behaviours
and perceptions of the pilot. The level of effort (cognitive and
physical) and attention resources expected to accomplish a task in combat mission may induce stress and fatigue due to high
PCWL.
It has been well accepted and reported in the scientific
community that attention an indirect measure of performance and, could be assessed either by objective (performance score
from simulator) or subjective techniques such as National Aeronautics and Space Administration Task Load Index (NASA-TLX)7, subjective workload assessment technique,
Received : 12 May 2019, Revised : 08 August 2019
rapid stress assessment scale, subjective workload dominance,
modified cooper-harper scale, defence research agency workload scale and dundee stress state questionnaire. On the
other hand, assessment of cognitive or physical performance
was quantitatively assessed using physiological signals4,8 CNS, such as electroencephalogram, electrooculogram, functional near-infrared spectroscopy and peripheral nervous system as measurement of heart rate, autonomous nervous system (ANS), heart rate variability (HRV)9, electrodermal activity and electromyography.
Among many physiological measures, electrocardiogram
(ECG) acquisition is a simple and effective, and, an unobtrusive technique for workload estimation; as it doesn’t interfere with the subject’s regular and high-risk operation or task. In scientific community, one of the established metrics
that could explain the ANS is HRV. A wealth of literature exists on the capacity of HRV in neurological, psychiatric, and metabolic disorders and cognitive workload10 among others. For instance, sympathetic activity increases the heart rate, constricts the blood vessels and thereby increases the blood pressure and parasympathetic activity on the other hand, it reduces heart rate and decreases the heart contractions thereby relaxing the individual. Several HRV studies conducted11–15 were able to assess pilot’s cognitive
workload for cockpit display interface evaluation and pilot’s workload measure both in a flight simulator and during actual fly for particular task or manouvering. Similarly, subjective assessment using NASA-TLX has been accepted and
reported by various researchers16. The present study aimed
to assess and understand the relation of dynamic workload
and fighter pilot’s performance, related to ANS regulation. To be specific, this study intends to empirically correlate the fighter pilot’s attention (performance) and pilot’s cognitive load during dynamic workload by physiological (ECG) and subjective measure (NASA-TLX), when pilots were flying in a high-fidelity fighter aircraft simulator.
2. ExPErImEnt
Pilots flew the fighter aircraft in the realistically fighter
aircraft simulator facility available at Defence Institute of Psychological Research (DIPR), New Delhi as shown in Fig. 1.
2.1 Study Protocol
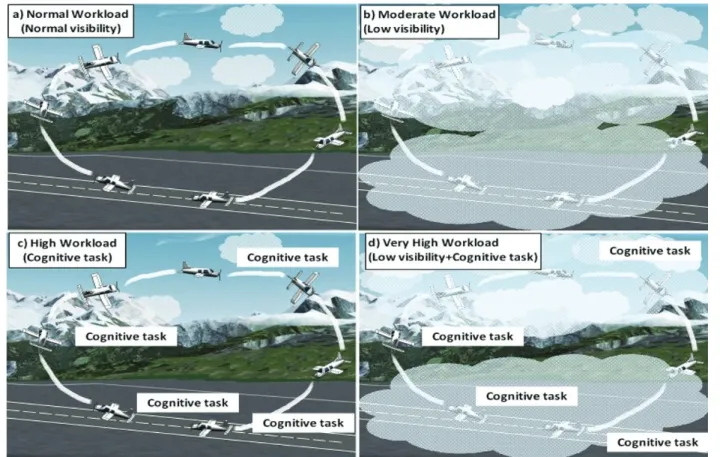
All pilots were advised to carry out four different
workload sortie such as (a) normal visibility condition
considered as normal workload (NWL), (b) low visibility condition as moderate workload (MWL), (c) normal visibility with secondary cognitive task (SCT) as high workload (HWL) and (d) low visibility with secondary cognitive task as very high workload (VHWL). Here, SCT task like adding
two integers would be displayed on the cockpit display and if result of addition is odd number, pilots are instructed to press left switch else right switch in cockpit instrumentation,
which is assumed as equivalent of responding to any kind
of warning system. During each sortie, pilot has to undergo
different segment or sub-tasks like start (60 s), take-off (approximately 60 s), cruise (approx. 300 s - 400 s), landing (60 s - 120 s) and rest after landing (60 s) as shown in Fig. 2.
Pilot’s sub-task and its required actions along with avionic
parameters (speed, altitude) and its corresponding physiological demands at each segment of workload task conditions are
explained in as detail in Table 1. Between each workload sortie, 20 min break was provided to avoid the influence of
the previous task. During each sortie, all parameters of cockpit
instrumentation and SCT data was recorded simultaneously along with physiological parameters (ECG) with markers set for each flying segment. The NASA-TLX questionnaire
form was completed by pilots during each break session. For
example, just before flying at NWL task and after completion of NWL and after each sortie of MWL, HWL and VHWL tasks respectively. The consent form was signed by each participant before flying.
2.2 Subject Selection Criteria
All subjects were well trained, with age group of
26-34 year (mean age of 28.1±1.4) and were not prone to any drugs that are known to affect or assist the heart or brain functionality. Their medical reports within 12 month were examined and all are fit to the level of combat flying in flight simulators. Out of 20 subject, only 16 subject’s data were considered for analysis, as 4 subject’s data was rejected due
to noisy signal, this could be due to electrode movement or other movement artefacts or other causes; that are yet to be investigated.
Figure 2. Flying protocol performed by test pilots at four different workload task (each task has 5 segments such as start, take off, cruise, landing and resting) (a) normal workload, (b) moderate workload, (c) high workload, and (d) very high workload.
Table 1. The sub-task at different flying segments and corresponding pilot’s action and expected demand in various task conditions
task required pilots action demand in various workload conditions
StArt
Break and throttle to idle Full brake
Increase throttle to max Check rpm and release brake
Checking engine parameters
Feel drag forces at throttling and releasing brake & ailerons, elevators, rudder control during banking
Mild physical demand but moderate to high preparedness for take-off during normal, low visible and while doing SCT (arithmetic & logic operations) in other sorties (workload conditions)
tAKE-oFF
Use pedal to maintain runway Watch for speed to 120 knot Pull stick back
Bring marker to the horizon Maintain 10º climb
Climb to 4000 ft. and heading 09 Maintain 300 knot speed
More holding and use rudder Feel dragging force
Use ailerons control to roll Straighten the flight
Close gear and elevator control to pitch (lift) Change settings dry max
Feel aircraft drag and pressure forces (use elevator) keep controlling aileron and rudder
More physical demand for handling joystick, complex psychomotor (eye, hand, leg coordination) and handed steadiness to maintain the proper rate of climb in low visible and more cognitive demand (multi-tasking, divided attention concentration) for SCT (arithmetic & logic operations) during moderate to very high workload sorties
CruISE
Maintain speed and altitude
At 5N, right turn with 45º bank, 18 heading At 7N, right turn with 45º bank, 27 heading Make 0N, then 5N, turn 45º, 36 heading Take 45º turn, 09 heading
Reduce speed to 200 knots and altitude 1000
Use all three controls
Feel 1.5–2 G approximate in actual fly only throughout cruise, use of joystick with proper eye, hand and leg coordination, checking MFD for each turn
More physical demand and more cognitive demand for eye, hand and leg coordination under low visibility condition. High perceptual demand (attention memory, spatial relation, peripheral vision) to perform SCT and manuvering simultaneously in high and very high workload (with low visibility)
LAndInG
12º alpha towards 0N
Carriage down and reduce speed 170–180, landing gear release, align with runway Touch Down with 3º glide slope Para suit on and brake
Use control to lower aircraft Reduce speed and release gear Feel drag forces and pressure
More mental and physical demand to align runway
More physical demand for motor control to align runway in all workload conditions & high perceptual load in low visibility due to rely on multiple displays (MFD). High attention switch and multitasking skills in high and very high conditions.
3. AnALySIS
Analysis section has been divided into (a) physiological monitoring, (b) subjective assessment, and (c) statistical analysis as shown in Fig. 3.
3.1 Physiological Assessment (Cardiac Signal Analysis)
Single lead (Lead-1) Electrocardiogram (ECG) of wearable remote physiological monitoring system (WRPMS) has been used to collect the ECG of the pilot. This WRPMS
system is an advanced version of smart vest17 that was
developed by Defence Bioenginnering & Electromedical Laboratory, (DEBEL) as shown in Fig. 3. It uses conductive
fabric electrode and was housed in a chest belt along with
data acquisition and wireless transmission system. ECG data is acquired and transmitted wirelessly to the recording unit, that was down sampled at 128 Hz and signal was analysed with 60 second moving window. Algorithm was developed for pre-processing, zero-phase digital filter and the dynamic threshold was set for finding R-peak and subsequently
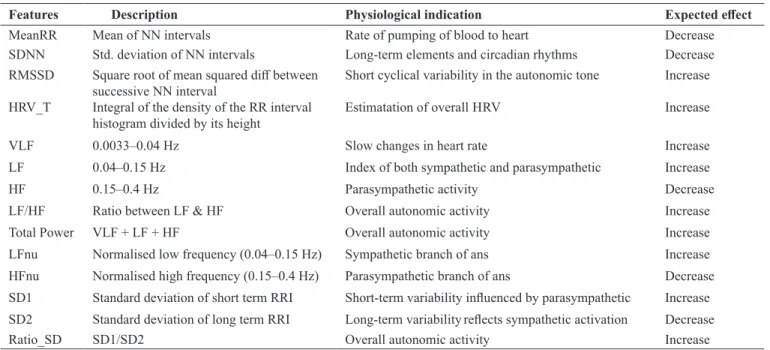
RR-peak interval (RRI). Further, the HRV parameters8,18-19 such as
time domain features (mean RR, SDNN, RMSSD), frequency domain features (HRV_T, VLF, LF, HF, Total power (TP), LFHF ratio, LFnu and HFnu) and nonlinear feature20-21 (Ratio
of SD, SD1 and SD2) were extracted from RRI and processed
using MatlabTM. HRV features, its physiological indications and their response while dynamic workload is as shown
in Table 2.
Figure 3. Functional representation of cognitive workload analysis for the pilot using wearable remote physiological monitoring system.
Table 2. HRV features and its effect expected due to increase in pilot’s workload
Features description Physiological indication Expected effect
MeanRR Mean of NN intervals Rate of pumping of blood to heart Decrease
SDNN Std. deviation of NN intervals Long-term elements and circadian rhythms Decrease RMSSD Square root of mean squared diff between
successive NN interval Short cyclical variability in the autonomic tone Increase HRV_T Integral of the density of the RR interval
histogram divided by its height Estimatation of overall HRV Increase
VLF 0.0033–0.04 Hz Slow changes in heart rate Increase
LF 0.04–0.15 Hz Index of both sympathetic and parasympathetic Increase
HF 0.15–0.4 Hz Parasympathetic activity Decrease
LF/HF Ratio between LF & HF Overall autonomic activity Increase Total Power VLF + LF + HF Overall autonomic activity Increase LFnu Normalised low frequency (0.04–0.15 Hz) Sympathetic branch of ans Increase HFnu Normalised high frequency (0.15–0.4 Hz) Parasympathetic branch of ans Decrease SD1 Standard deviation of short term RRI Short-term variability influenced by parasympathetic Increase SD2 Standard deviation of long term RRI Long-term variabilityreflects sympathetic activation Decrease
3.2 Subjective Assessment
The subjective assessment by NASA-TLX was to measure
the workload22 after completing each task. It consists of six subscales such as mental demand (MD), physical demand (PD),
temporal demands (TD), Performance (PE), Effort (EF) and Frustration (FR). The first three subscales indicate demands
on the subject and rest three scales indicates the interaction
of participant with task. The objective assessment of pilot’s flying performance score was arrived from recorded cockpit parameters and the SCT score arrived by analysing the number
of commissions, omission, and errors at each task.
3.3 Statistical Analysis
HRV feature parameters were tested for normality and found that parameters were not normally distributed; so
Friedman test was performed to identify significant difference between the measured parameters (HRV features) at five flying segments (start, take off, cruise, landing and rest) in all four conditions (NWL, MWL, HWL and VHWL) and also comparing NWL with other higher workload conditions. In addendum, the NASA-TLX score in MD, PD, TD, PE, EF and FR were compared at five flying segments in all four conditions. To identify the exact workload at which these differences existed, post-hoc wilcoxon signed ranks analysis
was performed for the cases where Friedman test result showed
significant difference. Statistical analysis was reported with a significant level at p < 0.05 and analyses were performed using
SPSSTM.
4. rESuLtS
In the fighter aircraft simulator, time taken to complete one full sortie would be approximately 550 s - 600 s. While
the pilots perform the assigned task, single lead ECG signal
was collected continuously till the end of each sortie (i.e.
600 s). Feature set matrix size of 16x60x14 for each flying
segment. In this study, HRV analysis was carried out for
two findings
(a) within workload condition, that is, start, take-off, cruise,
landing and resting in each sortie condition
(b) between workload conditions, that is, NWL (baseline
condition) is compared with other three work load
conditions (MWL, HWL, VHWL).
4.1 Within Workload Conditions
HRV features such as mean RR, SD2, SDNN, VLF, Ratio-SD and total power (TP), LFnu and HFnu were found to be significant at all five flying segments, for all four workload conditions as well. To be very specific, HRV features such as Ratio_SD, SD2, SDNN, VLF and TP has a lower mean ±standard error (14±3.2 < 28±6.1) at start and, take-off
segments when compared to cruise and, landing in most of workload conditions.
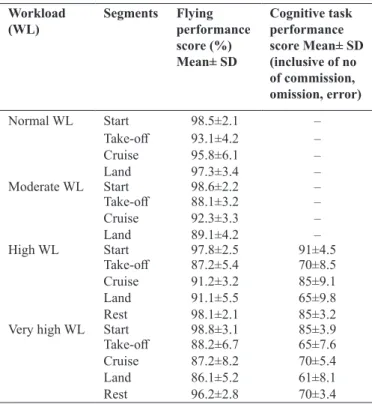
The mean flying performance score of pilots at each segment across all four task conditions and SCT score are
obtained by analysing cockpit parameters as tabulated in
Table 3. Result shows that the performance was gradually reduced at take-off, cruise and landing phase in higher workload conditions when compared to NWL. Particularly, take-off and landing performance was challenging (mean score was 86–88% with SD ±3.5) in MWL and VHWL conditions, wherein low visibility and SCT was induced. However, the overall score indicates that pilot’s mental capacity was able to
match to increased task.
4.2 between the Workload tasks
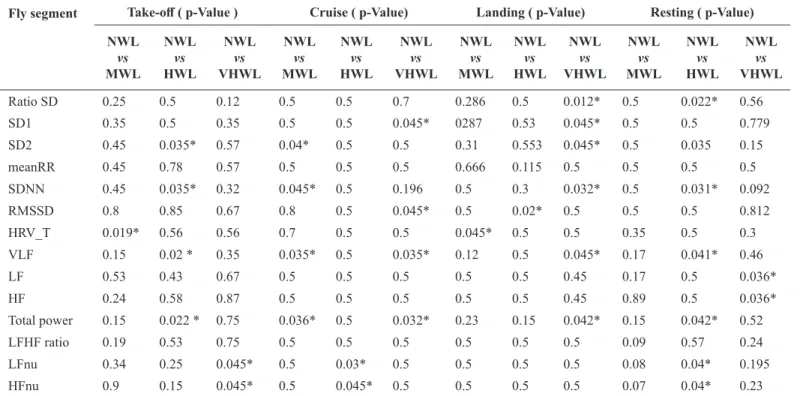
Here, normal work load was compared with moderate,
high and very high workload and its statistical significant p-values are as tabulated in Table 4 and their respective mean, and standard error plot are as shown in Fig. 4. When the NWL is compared with MWL condition: HRV_T mean value is low (p<0.05) during take-off comparing to the landing. Other features such as SD2, SDNN, VLF and TP are also significant (p<0.05) during cruise in NWL while comparing to MWL.
For assessing the NWL with HWL: Features such as VLF, TP, SD2, SDNN and HFnu are observed to be significantly low (p<0.05) during take-off (low mean value as shown in Fig. 4) and VLF, TP, HFnu and LFnu are significantly high (high mean value) during cruise and Ratio_SD, SD2, SDNN are significantly high during resting segment. Similarly between NWL with VHWL; the features LFnu and HFnu were significantly high (mean value are high) during take-off; SD1, RMSSD, VLF, TP are significantly high during cruise; SD1, SD2, Ratio-SD, SDNN, VLF, TP are significantly high during landing and, LF and HF are significantly low during resting
segment.
Overall, results as shown in Table 5 infer that, HRV features such as SD2, SDNN, VLF, TP are significant in all flying segments across all work load conditions and LFnu and HFnu could probably differentiate the task of low visibility and SCT.
table 3. Performance score and secondary task assessment of pilot in flying segments during various workload conditions (subject n=16)
Workload
(WL) Segments Flying performance score (%) mean± Sd Cognitive task performance score mean± Sd (inclusive of no of commission, omission, error) Normal WL Start 98.5±2.1 – Take-off 93.1±4.2 – Cruise 95.8±6.1 – Land 97.3±3.4 – Moderate WL Start 98.6±2.2 – Take-off 88.1±3.2 – Cruise 92.3±3.3 – Land 89.1±4.2 – High WL Start 97.8±2.5 91±4.5 Take-off 87.2±5.4 70±8.5 Cruise 91.2±3.2 85±9.1 Land 91.1±5.5 65±9.8 Rest 98.1±2.1 85±3.2 Very high WL Start 98.8±3.1 85±3.9 Take-off 88.2±6.7 65±7.6 Cruise 87.2±8.2 70±5.4 Land 86.1±5.2 61±8.1 Rest 96.2±2.8 70±3.4
Table 4. HRV features showing significant difference between various workload conditions
Fly segment Take-off ( p-Value ) Cruise ( p-Value) Landing ( p-Value) resting ( p-Value) nWL vs mWL nWL vs HWL nWL vs VHWL nWL vs mWL nWL vs HWL nWL vs VHWL nWL vs mWL nWL vs HWL nWL vs VHWL nWL vs mWL nWL vs HWL nWL vs VHWL Ratio SD 0.25 0.5 0.12 0.5 0.5 0.7 0.286 0.5 0.012* 0.5 0.022* 0.56 SD1 0.35 0.5 0.35 0.5 0.5 0.045* 0287 0.53 0.045* 0.5 0.5 0.779 SD2 0.45 0.035* 0.57 0.04* 0.5 0.5 0.31 0.553 0.045* 0.5 0.035 0.15 meanRR 0.45 0.78 0.57 0.5 0.5 0.5 0.666 0.115 0.5 0.5 0.5 0.5 SDNN 0.45 0.035* 0.32 0.045* 0.5 0.196 0.5 0.3 0.032* 0.5 0.031* 0.092 RMSSD 0.8 0.85 0.67 0.8 0.5 0.045* 0.5 0.02* 0.5 0.5 0.5 0.812 HRV_T 0.019* 0.56 0.56 0.7 0.5 0.5 0.045* 0.5 0.5 0.35 0.5 0.3 VLF 0.15 0.02 * 0.35 0.035* 0.5 0.035* 0.12 0.5 0.045* 0.17 0.041* 0.46 LF 0.53 0.43 0.67 0.5 0.5 0.5 0.5 0.5 0.45 0.17 0.5 0.036* HF 0.24 0.58 0.87 0.5 0.5 0.5 0.5 0.5 0.45 0.89 0.5 0.036* Total power 0.15 0.022 * 0.75 0.036* 0.5 0.032* 0.23 0.15 0.042* 0.15 0.042* 0.52 LFHF ratio 0.19 0.53 0.75 0.5 0.5 0.5 0.5 0.5 0.5 0.09 0.57 0.24 LFnu 0.34 0.25 0.045* 0.5 0.03* 0.5 0.5 0.5 0.5 0.08 0.04* 0.195 HFnu 0.9 0.15 0.045* 0.5 0.045* 0.5 0.5 0.5 0.5 0.07 0.04* 0.23
* Parameter that are significantly different in the flying segment (P<0.05).
Figure 4. Mean and standard error values of significant HRV features in ‘between the four workload conditions’ ((a)-(b) : NWL vs
(a) (d) (b) (f) (g) (h) (i) (c) (e) M EAN & SE M EAN & SE M EAN & SE
On the other hand, all six components of NASA-TLX index such as MD, TD, PD, FR, EF and PE were analysed and statistical significance were found across all four task workloads as shown in Fig. 5. All NASA-TLX components show the significant (p<0.05) difference at before flying than other four task load conditions. Thus, result infers that low visibility and SCT increases perceptual activity required such as thinking and decision making in-flight control. However, it was observed that there is no significance between MWL and HWL for any of the demands except the component performance (PE). The reason could be that the pilots had felt that low vision was more significant than performing multi-tasking like SCT. But, in VHWL condition, all components were significantly different when compared to before flying, NWL and HWL as it shows that there is an increased demand and frustration in VHWL task.
cognitive demands particularly in low visibility and with SCT activity. This demands a person to maintain the balance status to accomplish the targeted task, so (HRV_T at MWL and SD2, SDNN, VLF, TP at HWL and LFnu, HFnu at VHWL)
the modulation of sympathetic and parasympathetic has to maintain the balance ANS. During cruise, more physical
loading expected due to manoeuvering at 300bN speeds at 4000 feet for approximately 300 s - 500 s and more perceptual
demand (attention memory, spatial relation and peripheral
vision) are required to simultaneously handle the additional task (low visibility, with SCT) and manoeuvering the aircraft. During this phase, HRV features findings indicates the increased task performed as an effect of increased sympathetic activity (LFnu) and reduced parasympathetic (HFnu), when SCT was
performed.
In the fourth segment (landing), the complex
psychomotor response required to maintain steady rate of
descending with high perceptual process such as speed estimation, peripheral vision and depth perception due to rely on multiple displays (MFD) at increased task
conditions. HRV significant features such as HRV_T at low vision, RMSSD at SCT and Ratio_SD, SD1, SD2, SDNN, VLF and TP at VHWL infer that the fluctuation of
sympathetic and parasympathetic system occurs to maintain the balance in ANS in association with workload dynamics,
similar to take-off phase. Finally, in resting segment, no significance features were found at low visibility mode (MWL) due to no activity, but significance was observed for SCT activity.
Overall results infer that, during increasing workloads the sympathetic activities were more dominant. Thus, the
results of this study were in-line with the earlier studies of
HRV features in PCWL12-13. However, it has been observed that high parasympathetic activities were demanded during
landing in MWL and HWL condition; this is associated with pilot’s cognitive and physical task. During VHWL, pilot’s workload has even more increased and the significant feature
set infers that biological system has extended to bring a sympathovagal balance.
As a validation of HRV study and evaluate the attention
measure, NASA-TLX (Fig. 5) was performed and the result
indicates that, increased cognitive demand for maintaining
steady state of ascending, descending (during take-off, landing)
and for attention memory, spatial relation and peripheral vision
(during cruise). However, for between task NWL vs HWL (normal visibility with SCT) EF and PR are not significant, which indicates pilots handled SCT with increased MD, TD, FR. On the other hand while comparing NWL with MWL and
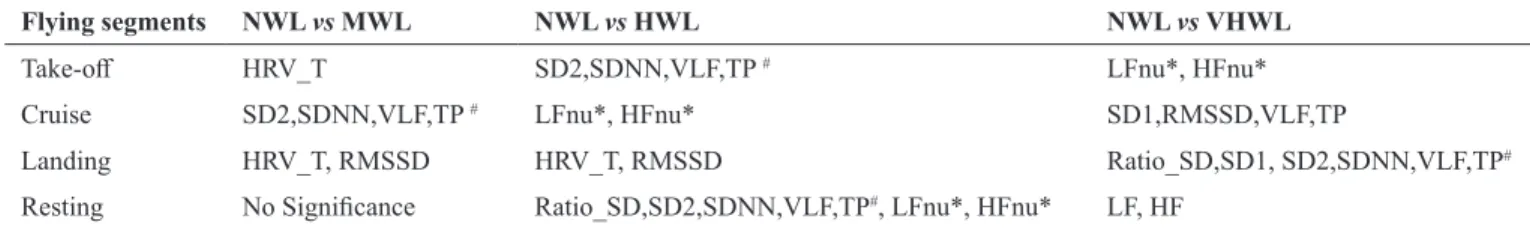
Table 5. Significant HRV features at different flying segments in different workload comparison
Flying segments nWL vs mWL nWL vs HWL nWL vs VHWL
Take-off HRV_T SD2,SDNN,VLF,TP # LFnu*, HFnu*
Cruise SD2,SDNN,VLF,TP # LFnu*, HFnu* SD1,RMSSD,VLF,TP
Landing HRV_T, RMSSD HRV_T, RMSSD Ratio_SD,SD1, SD2,SDNN,VLF,TP#
Resting No Significance Ratio_SD,SD2,SDNN,VLF,TP#, LFnu*, HFnu* LF, HF
# Significant feature in all segments across all workload conditions; * Significant feature for differentiating low visibility and secondary cognitive task
Figure 5. Mean and standard error of NASA-TLX score at before and after flying of each workload condition.
5. dISCuSSIon
This study indented to empirically understand the response of ANS using HRV parameters (ECG changes) during dynamic workload environment for pilots. Furthermore, NASA-TLX was
performed as a subjective assessment tool and correlated them
with pilot’s performance score for task performed at various
workloads, to understand the relation between the performance and attention, working memory solicitation strategies adapted for achieving the goal assigned for each workload. As shown in the result, the goal was met; statistical analysis revealed a
strong significant difference between workload with respect to
HRV parameters.
For instance, during take-off phase, pilot carried out
complex psychomotor activities such as eye, hand, and leg coordination, to maintain steady rate of climb with increased
VHWL (low visibility present at both task) the interaction components EF, PE, FR are always found significant, this
in tune indicates that higher task load was met by increased
level of effort and performance. Further, when comparing NWL vs VHWL result (as PD also becomes significant) indicates the increased psychomotor skills. Thus, NASA-TLX score supports HRV findings (cognitive workload) at various
workload tasks.
On the other hand, even though the HRV features indicate significance at various flying phases and various workload task conditions, pilot was able to fly aircraft with mean flying performance score (obtained from cockpit simulator) of 80– 97% as shown in Table 3, across all workload task. This shows, measuring PCWL and performance by subjective and objective techniques during different flying segments across dynamic workload environment demands on adaptability of pilot’s ANS to meet the required performance. In future, neuronal activities study like EEG and NIRS could be used for understanding the
functional connectivity among dynamic workload and relation between cardiac and cognitive markers.
6. LImItAtIon oF tHE Study
The main limitation of our study is the population size. This study demands skilled test pilots to maintain the study
homogeneity. In addition, to complete the full experimental protocol it takes approximately 3 h - 4 h; during this period,
subject had to wear the chest belt continuously for ECG acquisition. Second, the countering of G-forces, especially acting very high in fighter aircraft pilots in Z direction (head–
toe), else if not countered properly, the pilot shall enter into
G-induced loss of consciousness (G-LOC) at 4.5–5 +Gz in
shorter time, cannot be simulated by this simulator, hence we did not consider the impact of G-Forces towards cognitive workload and attention of pilot.
7. ConCLuSIonS
This study finding has shown the correlation among physiological workload measure and pilot’s performance
(objective-simulator score) in dynamic workload environment. Further it has been validated using the self-assessment
(subjective-NASA-TLX). These results could form as baseline to assess pilot’s cognitive capacity and improve the performance during training in flight simulator and in real flight conditions. To realise a real-time PWL indicator, we are
further extending this study to investigate a greater number of pilots during many complex manoeuvering and exercises
to classify different cognitive status in regular fighter aviation
environments, as future work, which is also useful for cockpit ergonomics study.
rEFErEnCE
1. Wiegmann, D. A. & Shappell, S.A. Human error analysis
of commercial aviation accidents: Application of the
human factors analysis and classification system (HFACS).
Aviation, Space, Environ. Med., 2001, 72, 1006–1016. 2. Causes of fatal accidents by decade -statistic-http://www.
planecrashinfo.com/cause.htm
evaluation of flame retardant outer garment for anti G
suit. Man-Made Textiles India, 1997, 40(5), 206–210. 4. Borghini, G.; Astolfi, L.; Vecchiato, G. & Mattia, D.
Measuring neurophysiological signals in aircraft pilots and car drivers for the assessment of mental workload, fatigue and drowsiness. Neurosci. Biobehavioral Rev.,
2014, 44, 58-75.
doi: 10.1016/j.neubiorev.2012.10.003.
5. Glenn, F. Wilson. An analysis of mental workload in pilots during flight using multiple psychophysiological
measures. Int. J. Aviation Psychol., 2002, 12(1), 3-18. doi: 10.1207/s15327108ijap1201_2.
6. Charles, L. R. & Jim, N. Measuring mental workload
using physiological measures: A systematic review. Applied Ergonomics, 2018, 74, 221-232.
doi:10.1016/j.apergo.2018.08.028.
7. Hart, S.G. & Staveland, E. L. Development of NASA-TLX (Task Load Index): Results of empirical and theoretical
research. Advances Psychology, 1988, 52,139-183. doi: 10.1016/S0166-4115(08)62386-9
8. Nagendra, H.; kumar, V. & Mukherjee, S. Cognitive
behavior evaluation based on physiological parameters among young healthy subjects with yoga as intervention. Computat. Math. Methods Med., 2015, Article ID 821061.
doi: 10.1155/2015/821061.
9. Lahtinen, M.M. T.; koskelo, P. J.; Laitinen, T. & Leino, k. T. Heart rate and performance during combat missions in a flight simulator. Aviation, Space, Environ. Med., 2007,
78 (4), 387–391.
10. Mohanavelu, k.; Lamshe, R.; Poonguzhali, S.; Adalarasu,
K. & Jagannath, M. Assessment of human fatigue during physical performance using physiological signals: A review. Biomed. Pharmacol. J., 2017, 10(4),1887-1896. doi:10.13005/bpj/1308.
11. Mehler, B.; Reimer, B. & Wang, y. A comparison of heart
rate and heart rate variability indices in distinguishing single-task driving and driving under secondary cognitive workload. In Proceedings of the Sixth International Driving Symposium on Human Factors in Driver Assessment,
Training and Vehicle Design, 2011, 590–597. doi: 10.17077/drivingassessment.1451
12. Mansikka, HP.; Virtanen, k.; Harris, D. & Simola, P. Fighter pilots’ heart rate, heart rate variation and performance during an instrument flight rules proficiency
test. Applied Ergonomics., 2016, 56, 213–219. doi: 10.1016/j.apergo.2016.04.006.
13. Zongmin, W.; Damin, Z.; Xiaoru, W.; Chen, L. & Huan, Z. A model for discrimination and prediction of mental
workload of aircraft cockpit display interface. Chinese J. Aeronautics, 2014, 27 (5), 1070–1077.
doi: 10.1016/j.cja.2014.09.002.
14. Sharma, S.; Baijal, R. & Sinha, A. Mental work load assessment during different simulated instrument
meteorological conditions in clouds and during dark night. Ind. J. Aerospace Med., 2012, 56(1), 11-20. 15. Jorna, P.G.A.M. Heart rate and workload variations in
36(9), 1043–1054.
doi: 10.1080/00140139308967976.
16. Rubio, S.; Diaz, E.; Martin, J. & Puente, M.J. Evaluation of Subjective Mental Workload: A comparison of SWAT, NASA-TLX, and workload profile methods. Applied Psychology: Int. Rev., 2004, 53 (1), 61–86.
doi: 10.1111/j.1464-0597.2004.00161.x
17. Pandian, P.S.; Mohanavelu, k.; Safeer, k.P.; kotresh, T.M.; Shakunthala, D.T.; Gopal, Parvati. & Padaki, V.C. Smart Vest: Wearable multi-parameter remote physiological
Monitoring system. Med. Eng. Phy., 2008, 30, 466–477.
doi: 10.1016/j.medengphy.2007.05.014.
18. Jayaraman, S. & kumar, k. Stress detection of IT professional using one minute ECG record. In 18th International Neuroscience and Biological Psychiatry Conference-Stress and Behavior, At New Orleans, LA, uSA,2012
19. Sumitha, M.; Mohanavelu. k.; Singh, S.P. & Ravindran,
G. Development of wearable HRV analysis monitor: A tool for critical care. In 2nd National conference on signal
processing, communication and VLSI Design, 2010. 20. Shaffer, F. & Ginsberg, J.P. An overview of heart rate
variability metrics and norms. Frontiers Public Health,
2017, 5, Article 258.
doi: 10.3389/fpubh.2017.00258
21. Malik, M. Heart rate variability standards of measurement,
physiological interpretation, and clinical use. Circulation,
1996, 93. 1043-1065.
22. Hart, S.G. NASA-Task load index; 20 years later. In
Proceedings of the Human Factors and Ergonomics Society Annual Meeting, 2006, 50, 904–908.
doi:10.1177/154193120605000909.
ContrIbutorS
mr mohanavelu K. obtained his BE (Instrumentation and Control) from university of Madras, Chennai and MTech (Biomedical Engineering) from IIT Madras. He is currently working as Scientist at DRDO- Defence Bioenginnering & Electromedical Laboratory, Bengaluru. His areas of research include wearable physiological monitoring, performance measurement and enhancement of military personnel, Telemedicine, brain computer interface, noninvasive brain stimulation and exoskeleton.
In the current study, he is involved in conceptualisation, study and protocol design. He conducted experiments, data collection and also carried extraction of HRV features and its statistical analyses with its correlation and validation to find the results and inference and prepared manuscript.
dr S. Poonguzhaliobtained his BE (Electronics and Instrumentation Engineering) from Annamalai university, India and ME and PhD in Medical Electronics from College of Engineering, Guindy, Anna university, Chennai. She is currently working as Assistant Professor in Dept of ECE, College of Engineering, Guindy, Anna university, Chennai, India. Her areas of research include biomedical image processing, rehabilitation engineering and medical instrumentation.
In the current study, she is involved in conceptualisation and developed the experimental protocol and review of results and manuscript.
dr d. ravi obtained PhD in Psychometrics from Bharthiar university Coimbatore. He is currently working as scientist at DRDO-Defence Institute of Psychological Research Laboratory, Delhi. Currently he is working in the field of Human factor and Aviation psychology. His areas of research include application of machine learning in pilot mental workload estimation, pilot selection system and cognitive function in high altitude.
In the current study he is involved in preparation, administration and analysis of subjective workload index (NASA-TLX). He has also designed research protocol and conducted experiments in High fidelity fighter simulator
mr Pushpendra Kumar Singh obtained his BE (Electronics & TC) from RJPV Bhopal with Honor, and MTech in Signal Processing (Electrical Engineering) from IIT kanpur. He is currently working as scientist at DIPR, DRDO Delhi. His areas of research includes system design, machine learning, cognitive science (perception and decision making), cognitive load assessment for air force pilots and BCI.
In the current study, he is involved in conducting experiments and data collections from simulator and its cockpit parameters data analysis.
ms mistu mahajabin obtained her BE (Computer Science and Engineering) from West Bengal university of Technology, Kolkata. She is currently working as scientist at DRDO-Defence Institute of Psychological Research Laboratory, Delhi. Her areas of research include measuring psychological abilities through computerise test, text analysis using machine learning and big data analysis.
In the current study, she has designed secondary task, data collection during experiments and its analyses.
dr K. ramachandran, did his Post-Graduation in Applied Psychology from Bharathiar university, Coimbatore, M.Phil in Psychology from University of Madras and PhD in Psychology from university of Delhi. Currently working as Scientist ‘H’ & Director DRDO-Defence Institute of Psychological Research Laboratory, Delhi. He has acquired specialisation in the areas of experimental and human engineering, aviation psychology and environmental psychology.
In the current study, he helped in reviewing experimental protocol, NASA-TLX questionnaire and reviewed inference manuscript.
dr upendra Kumar Singh did his M.Sc and M.Tech degree in computer Science from DAVV, Indore and obtained his doctorate from university of Hyderabad on soft computing. Currently working as Scientist ‘H’ & Director DRDO- Defence Bioenginnering & Electromedical Laboratory, Bengaluru, Bengaluru.
In the current study, he helped in reviewing algorithms, results and manuscript.
dr Srinivasan Jayaraman has completed his PhD from IIT-Madras, India. Currently working as a lead Scientist at Medical device and development division– Bengaluru. After completing his doctorate, he worked as a Scientist at TCS Innovation Labs– Bengaluru (2008-2018). His research interests include cardiac computation model, human performance and behavioral modelling, ontology, AI, personalised diagnosis system, wearable devices, and human system interface.
In the current study, he is involved in extracting HRV features, inference and review on manuscript.