East Tennessee State University
Digital Commons @ East
Tennessee State University
Electronic Theses and Dissertations Student Works
12-2015
Learning Support Effectiveness in Mathematics at a
Tennessee University
Mark Dula
East Tennessee State University
Follow this and additional works at:https://dc.etsu.edu/etd
Part of theEducational Leadership Commons,Scholarship of Teaching and Learning Commons, and theScience and Mathematics Education Commons
This Dissertation - Open Access is brought to you for free and open access by the Student Works at Digital Commons @ East Tennessee State University. It has been accepted for inclusion in Electronic Theses and Dissertations by an authorized administrator of Digital Commons @ East Tennessee State University. For more information, please [email protected].
Recommended Citation
Dula, Mark, "Learning Support Effectiveness in Mathematics at a Tennessee University" (2015).Electronic Theses and Dissertations.
Learning Support Effectiveness in Mathematics at a Tennessee University
______________________ A dissertation
presented to
the faculty of the Department Educational Leadership and Policy Analysis
East Tennessee State University
In partial fulfillment
of the requirements for the degree Doctor of Education in Educational Leadership
______________________ by
Mark Elliott Dula December 2015 ______________________
Dr. James Lampley, Chair Dr. Donald Good
Dr. Lyn Howell Dr. Jasmine Renner
2
ABSTRACT
Learning Support Effectiveness in Mathematics at a Tennessee University
by Mark Dula
Every year thousands of students graduate from high school and move on to higher education, but many of them are not yet prepared for college level courses. The Tennessee Board of Regents does not currently allow 4-year institutions to teach courses that are below college level, so many institutions are using programs such as learning support courses to assist a growing population of underprepared students. The purpose of this study was to determine if the 1-term and 2-term retention rates for
students with the same ACT mathematics subsection scores were different between students who took a regular section of Probability and Statistics and students who took a learning support section of the course.
The subjects of this study were students who enrolled in a Probability and Statistics class (either regular sections or learning support sections) at a 4-year institution from the 2013 summer semester through the 2014 fall semester. The criteria used for
selecting subjects included: (1) enrolled in a section of Probability and Statistics, (2) had a valid ACT mathematics subsection score on file with the institution, and (3) recorded a final grade in the course. Students were then grouped by ACT mathematics subsection score and type of course (learning support or regular).
3
When students were grouped by matching ACT mathematics subscores there were no real significant differences in 1-term retention, 2-term retention, or final course grade between students who took a 4-hour learning support section of probability and
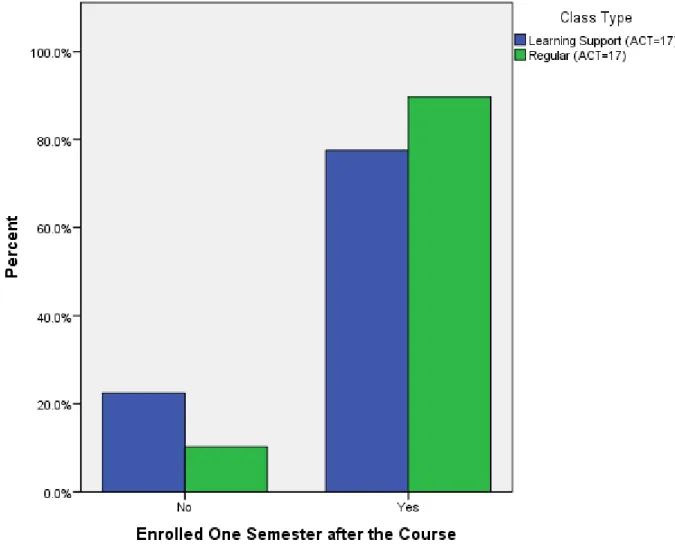
statistics and students who opted to take a regular 3-hour version of the same course, with one exception. Of students who scored a 17 on the ACT mathematics subsection, the students enrolled in a regular course had a 1-term retention rate that was
4
DEDICATION
This work is dedicated to my family Roy, Kathy, and Erin, who have always supported me honestly and enthusiastically in whatever goals I have chosen and have always been advisors and close friends. Also, to Jim Fairman who was a great
inspiration for my education and remains a great friend. Finally, to my wonderful wife Taylor, my greatest ally and greatest inspiration to be a better person. Thank you and I love you all.
5
ACKNOWLEDGEMENTS
I would like to thank my committee chair Dr. James Lampley who forfeited a great deal of his summer for this endeavor and to my committee Dr. Don Good, Dr. Jasmine Renner, and Dr. Lyn Howell. I would also like to thank the department of education at Milligan College who have supported me since the first day I walked in their door, with a special thanks to Dr. Howell, Dr. Don Schmalzried, and Ms. Karen Hill.
I would also like to thank the students of Hampton High School, who have served as a source of daily inspiration and joy.
6 TABLE OF CONTENTS ABSTRACT ... 2 DEDICATION ... 4 ACKNOWLEDGEMENTS ... 5 LIST OF TABLES ... 8 LIST OF FIGURES ... 11 Chapter 1. INTRODUCTION ... 13
Statement of the Problem ... 15
Research Questions ... 16
Significance of the Study ... 20
Limitations of the Study ... 22
Definitions of Terms ... 23
Overview of Study ... 24
2. REVIEW OF LITERATURE ... 25
Introduction ... 25
The History of Developmental Education ... 26
The Underprepared Student Population ... 28
Underprepared Student Identification ... 30
Success of Underprepared Students ... 31
Remediation ... 33
Barriers ... 34
First-year experience ... 35
Contemporary Studies on Developmental Education ... 37
Developmental Education at 4-year Universities ... 39
Tennessee High School Math ... 42
College Remediation at the High School Level ... 44
Summary ... 48
3. RESEARCH METHOD ... 50
Population ... 51
Data Collection ... 51
Research Questions and Null Hypotheses ... 52
Data Analysis ... 59
7 Summary ... 60 4. FINDINGS ... 61 Introduction ... 61 Research Question 1 ... 63 Research Question 2 ... 65 Research Question 3 ... 68 Research Question 4 ... 71 Research Question 5 ... 74 Research Question 6 ... 77 Research Question 7 ... 80 Research Question 8 ... 83 Research Question 9 ... 86 Research Question 10 ... 89 Research Question 11 ... 92 Research Question 12 ... 95 Research Question 13 ... 98 Research Question 14 ... 101 Research Question 15 ... 104 Research Question 16 ... 107 Research Question 17 ... 110 Research Question 18 ... 113
5. SUMMARY, CONCLUSIONS, AND RECOMMENDATIONS ... 117
Summary of the Findings ... 117
Conclusions... 125
Recommendations for Practice ... 128
Recommendations for Further Research ... 130
REFERENCES ... 132
8
LIST OF TABLES
Table Page
1. Number of Students Who Were Enrolled at the University 1
Semester after Taking the Probability and Statistics Course ... 64 2. Number of Students Who Were Enrolled at the University 2
Semesters After Taking the Probability and Statistics Course
and Type of Course Taken ... 67 3. Number of Students with an ACT Mathematics Score of 18
or less Who Enrolled 1 Semester after Taking the Probability
and Statistics Course and Type of Course Taken ... 70 4. Number of Students with an ACT Mathematics Score of 18
or less Who Enrolled 2 Semesters after Taking the
Probability and Statistics Course and Type of Course Taken ... 73 5. Number of Students with an ACT Mathematics Score of 18
Who Enrolled 1 Semester after Taking the Probability and
Statistics Course and Type of Course Taken ... 76 6. Number of Students with an ACT Mathematics Score of 18
or less Who Enrolled 2 Semesters after Taking the
Probability and Statistics Course and Type of Course Taken ... 79 7. Number of Students with an ACT Mathematics Score of 17
Who Enrolled 1 Semester after Taking the Probability and
Statistics Course and Type of Course Taken ... 82 8. Number of Students with an ACT Mathematics Score of 17
Who Enrolled 2 Semesters after Taking the Probability and
Statistics Course and Type of Course Taken ... 85 9. Number of Students with an ACT Mathematics Score of 16
Who Enrolled 1 Semester after Taking the Probability and
9
10. Number of Students with an ACT Mathematics Score of 16 Who Enrolled 2 Semesters after Taking the Probability and
Statistics Course and Type of Course Taken ... 91 11. Number of Students with an ACT Mathematics Score of 15
Who Enrolled 1 Semester after Taking the Probability and
Statistics Course and Type of Course Taken ... 94 12. Number of Students with an ACT Mathematics Score of 15
Who Enrolled 2 Semesters after Taking the Probability and
Statistics Course and Type of Course Taken ... 97 13. Number of Each Grade Earned Separated by Category and
Course Type ... 100 14. Number of Each Grade Earned Separated by Category and
Course Type (ACT<19) ... 103 15. Number of Each Grade Earned Separated by Category and
Course Type (ACT=18) ... 106 16. Number of Each Grade Earned Separated by Category and
Course Type (ACT=17) ... 119 17. Number of Each Grade Earned Separated by Category and
Course Type (ACT=16) ... 112 18. Number of Each Grade Earned Separated by Category and
Course Type (ACT=15) ... 115 19. Percentage of Students Who Were Enrolled at the University
1 Semester after Taking the Probability and Statistics
Course ... 119 20. Percentage of Students Who Were Enrolled at the University
2 Semesters after Taking the Probability and Statistics
Course ... 121 21. Percentage of Students Failing a Probability and Statistics
Course Separated by ACT Mathematics Subscore and
10
22. Summary of 1-Term Retention, 2-Term Retention, and Final Course Grade Separated by ACT Math Sub Section Score
11
LIST OF FIGURES
Figures Page
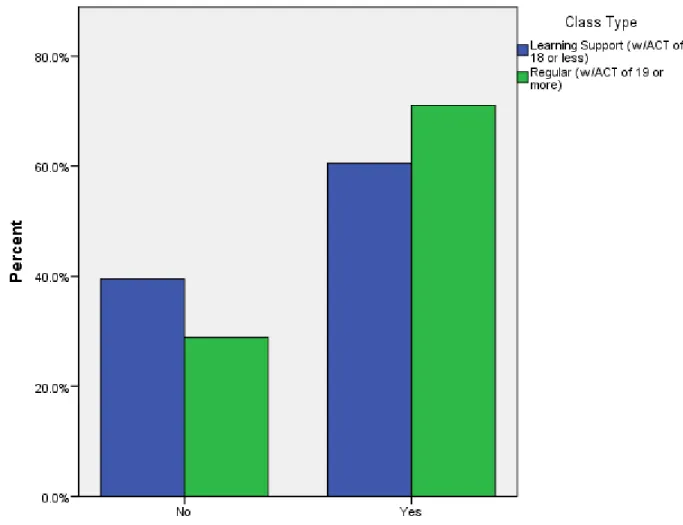
1. Percentage of Students who Enrolled 1 Semester after Taking a Probability and Statistics Course and Type of
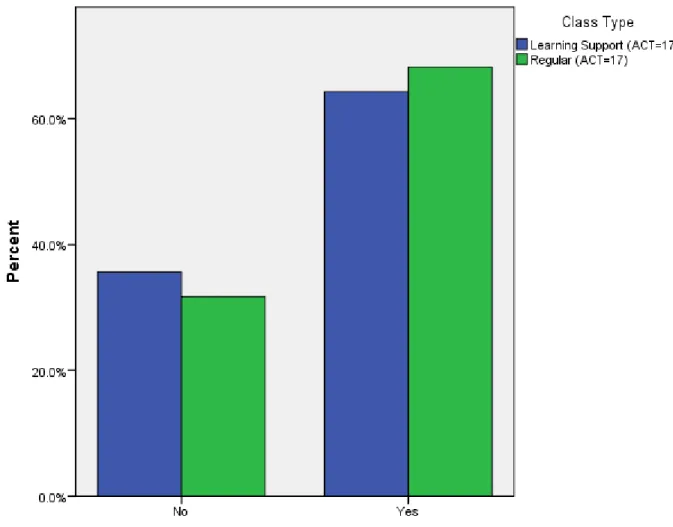
Course Taken ... 65 2. Percentage of Students Who Were Enrolled 2 Semesters
after Taking a Probability and Statistics Course and Type of
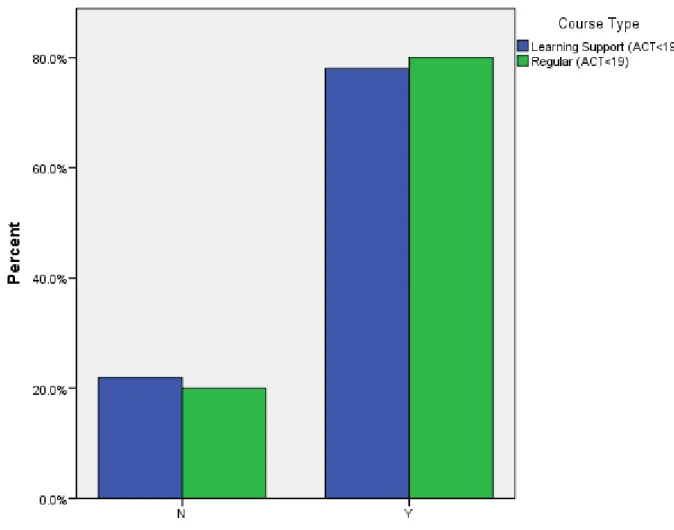
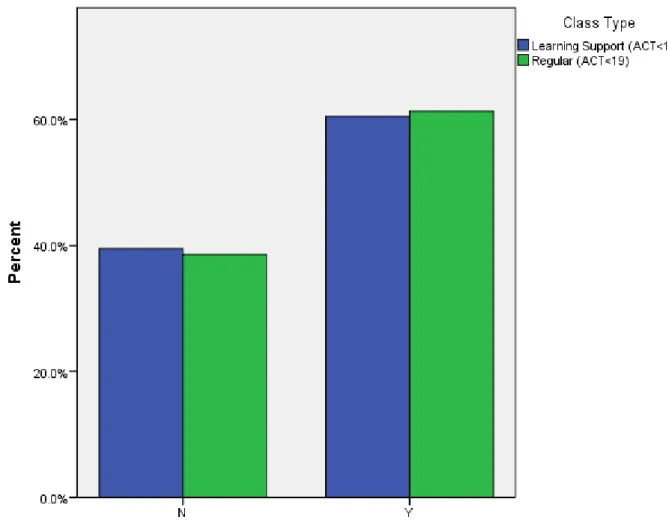
Course Taken ... 68 3. Percentage of Students who Enrolled 1 Semester after a
Probability and Statistics Course (ACT<19) ... 71 4. Percentage of Students who Enrolled 2 Semesters after
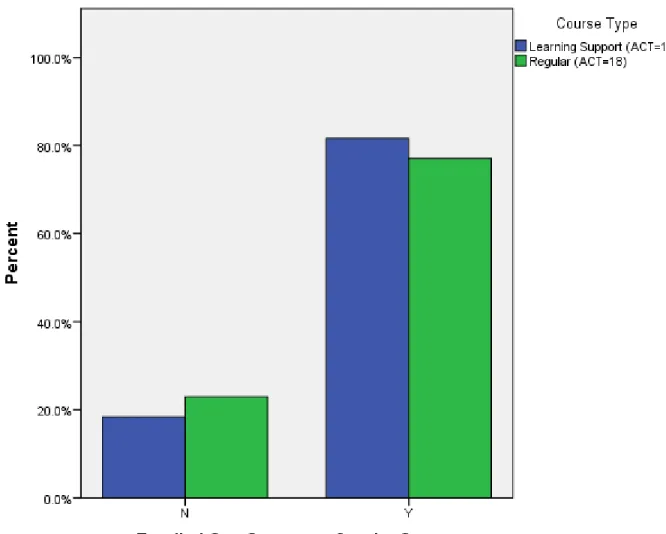
taking a Probability and Statistics Course (ACT<19) ... 74 5. Percentage of Students who Enrolled 1 Semester after a
Probability and Statistics Course (ACT=18) ... 77 6. Percentage of Students who Enrolled 2 Semesters after a
Probability and Statistics Course (ACT=18) ... 80 7. Percentage of Students who Enrolled 1 Semester after a
Probability and Statistics Course (ACT=17) ... 83 8. Percentage of Students who Enrolled 2 Semesters after a
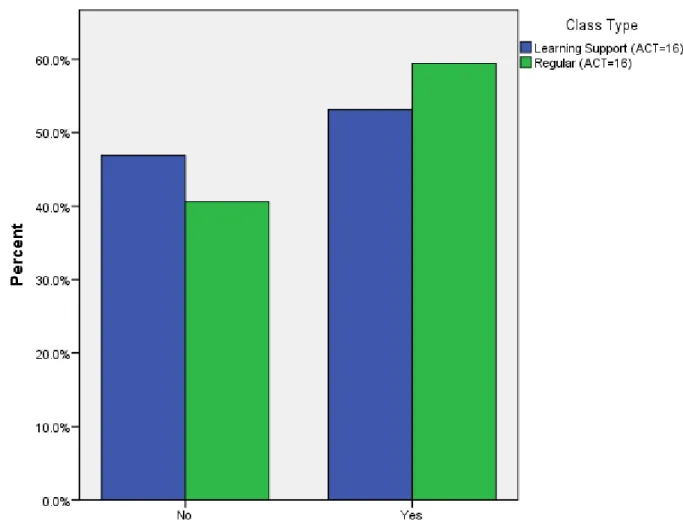
Probability and Statistics Course (ACT=17) ... 86 9. Percentage of Students who Enrolled 1 Semester after a
Probability and Statistics Course (ACT=16) ... 89 10. Percentage of Students who Enrolled 2 Semesters after a
Probability and Statistics Course (ACT=16) ... 92 11. Percentage of Students who Enrolled 1 Semester after a
Probability and Statistics Course (ACT=15) ... 95 12. Percentage of Students who Enrolled 2 Semesters after a
12
13. Percentage of Grades in Each Category Separated by Type
of Course Taken ... 101 14. Percentage of Grades in Each Category Separated by Type
of Course Taken ... 104 15. Percentage of Grades in Each Category Separated by Type
of Course Taken ... 107 16. Percentage of Grades in Each Category Separated by Type
of Course Taken ... 110 17. Percentage of Grades in Each Category Separated by Type
of Course Taken ... 113 18. Percentage of Grades in Each Category Separated by Type
of Course Taken ... 115 19. Percentage of Students who Enrolled at the University 1
Semester after Taking a Probability and Statistics Course ... 120 20. Percentage of Students who Enrolled at the University 2
Semesters after Taking a Probability and Statistics Course ... 122 21. Percentage of Students Failing a Probability and Statistics
Course Separated by ACT Mathematics Subscore and
13
CHAPTER 1
INTRODUCTION
Every spring, millions of students graduate from high schools across the country and prepare for the next step in their lives. The next step for about two thirds of high school graduates is to continue their education at a college or university (NCES,
2014a). Many of these students already have a college in mind, some have started the enrollment process, and a large number have applied for funding to pay for this venture. It may seem that these students are ready to take the step into higher education, but unfortunately, most of these students are not academically prepared; especially in the area of mathematics.
The ACT is a standardized test used nationwide as a predictor of college
success and is broken down by subject area. The mathematics benchmark is set at 22 out of a possible score of 36. Based on this benchmark, a student is given a 50% chance of attaining a grade of B or higher and a 75% chance of attaining a grade of C or higher in their introductory mathematics course in higher education (ACT, 2013). At a 5-year average only 45% of our nation’s graduates are meeting this benchmark from 2009 to 2013 (ACT, 2012). To combat this under-preparedness colleges and
universities have put programs in place to help bring these students up to college level; systems vary in name and execution from institution to institution. These programs have typically been called developmental or remedial classes. Some have counted as credit toward graduation while others have not. Some have been a 1-hour tutoring session per week, while others have been 5-credit-hour classes (Ayecaster, 2001). Sometimes students are charged extra tuition fees for the extra hours, and other times
14
students pay the same tuition as they would for a regular course. Research in this area is still ongoing; therefore, no singular method has been deemed most effective.
However, many of these methods have been removed as an option for 4-year universities in Tennessee (TBR, 2014).
Complete College America (CCA) conducted a 2009 study on graduation rates and student success that was broken down by state levels. A report was submitted to Tennessee’s then governor, Phil Bredesen, which highlighted suggestions that
projected to improve graduation rates and student success for higher education institutions in Tennessee. Removing remedial courses from 4-year universities was among the suggestions stating, “remedial and developmental instruction should be eliminated at 4-year universities and only provided at community colleges where it can be provided at a lower cost to students and the state and where new models for more effective developmental education are being required” (p. 8). This suggestion was adopted by the Tennessee Board of Regents (TBR) in 2010 with full implementation to be completed by 2013 (TBR, 2014). While this change was not important to highly selective institutions, it provided a great strain on 4-year state institutions who rely heavily on the enrollment of students from less qualified populations with lower ACT scores. Many of these state institutions have incoming classes with median ACT scores that do not reach the benchmark of 22 (About Education, 2014). These institutions would face financial hardships if they had to reduce their admitted students by 50%, so they were forced to find innovative methods to help unprepared students to succeed without using remedial or developmental courses. One of these methods was the use of “learning support” courses that is the current method at the university being studied.
15
Learning support is defined by TBR (2014) as “academic support needed by a student to be college ready as established by the ACT college readiness benchmarks and standards” (p. 4). One way that universities have met this guideline is by offering a 1-hour support class for freshman level courses. For example a student registering for probability and statistics who does not meet college readiness standards for
mathematics may still enroll in the course but will be required to participate in a 1-hour per week mathematics support class in which fundamental concepts will be reviewed and specific deficits addressed. This concept is relatively new, and very little research exists at the University being studied on the effectiveness of such supports in both catching underprepared students up to their prepared classmates and providing enough support to retain students who are behind.
This study was designed to determine if the 1-term and 2-term retention rates for students with the same ACT mathematics subsection scores were different for students taking a regular 3-hour probability and statistics course and students taking a 4-hour learning support version of the same course.
Statement of the Problem
The problem for this study is that it is not known if the learning supports put into place at the participating university are (1) providing adequate support to ensure successful completion of a college level mathematics course for underprepared
students and enable them to obtain similar grades averages as college ready students, or (2) retaining learning support students from the semester following the learning support class and into the following year. This study will serve to measure the success in one mathematics course of underprepared students who are taking a learning
16
support mathematics class versus students not needing learning support as well as compare the retention rates of students participating in mathematics learning support to the retention rate of those students not participating in learning support.
Research Questions
An ACT score of 19 was used as the benchmark for college readiness because it is the benchmark used by the university being studied. One-term retention was used because it represents retaining a student through the semester in which they enroll in probability and statistics at the university into the next term, and 2-term retention was used because it represents retaining a student from their first year into their second, a time that has been shown to produce the highest levels of attrition (Murtaugh et al., 1999). The learning support program being studied was formed to support a first year probability and statistics course, for all students who are required to take it in their first year.
The questions included in this study are:
1. Is there a significant difference in the 1-term retention rates between students who score a 19 or greater on the mathematics section of the ACT (and take a 3-hour Probability and Statistics course) and students who score less than 19 (who take a 4-hour learning support version of the same course)?
2. Is there a significant difference in the 2-term retention rates between students who score a 19 or greater on the mathematics section of the ACT (and take a regular 3-hour Probability and Statistics course) and students who score less than 19 (who take a 4-hour learning support version of the same course)?
17
3. For students scoring less than a 19 on the mathematics section of the ACT, is there a significant difference in the 1-term retention rates between students who take a regular 3-hour Probability and Statistics course and students who take a 4-hour learning support version of the same course?
4. For students scoring less than a 19 on the mathematics section of the ACT, is there a significant difference in the 2-term retention rates between students who take a regular 3-hour Probability and Statistics course and students who take a 4-hour learning support version of the same course?
5. For students scoring an 18 on the mathematics section of the ACT, is there a significant difference in the 1-term retention rates between students who take a regular 3-hour Probability and Statistics course and students who take a 4-hour learning support version of the same course?
6. For students scoring an 18 on the mathematics section of the ACT, is there a significant difference in the 2-term retention rates between students who take a regular 3-hour Probability and Statistics course and students who take a 4-hour learning support version of the same course?
7. For students scoring a 17 on the mathematics section of the ACT, is there a significant difference in the 1-term retention rates between students who take a regular 3-hour Probability and Statistics course and students who take a 4-hour learning support version of the same course?
8. For students scoring a 17 on the mathematics section of the ACT, is there a significant difference in the 2-term retention rates between students who take a
18
regular 3-hour Probability and Statistics course and students who take a 4-hour learning support version of the same course?
9. For students scoring a 16 on the mathematics section of the ACT, is there a significant difference in the 1-term retention rates between students who take a regular 3-hour Probability and Statistics course and students who take a 4-hour learning support version of the same course?
10. For students scoring a 16 on the mathematics section of the ACT, is there a significant difference in the 2-term retention rates between students who take a regular 3-hour Probability and Statistics course and students who take a 4-hour learning support version of the same course?
11. For students scoring a 15 on the mathematics section of the ACT, is there a significant difference in the 1-term retention rates between students who take a regular 3-hour Probability and Statistics course and students who take a 4-hour learning support version of the same course?
12. For students scoring a 15 on the mathematics section of the ACT, is there a significant difference in the 2-term retention rates between students who take a regular 3-hour Probability and Statistics course and students who take a 4-hour learning support version of the same course?
13. Is there a significant difference in the proportion of students falling into each of the letter grade categories (A, B, C, D, or F) for Probability and Statistics between those taking the regular 3-semester hours version of the course and those taking the 4-semester hours learning support version of the course?
19
14. For students scoring less than a 19 on the mathematics section of the ACT, is there a significant difference in the proportion of students falling into each of the letter grade categories (A, B, C, D, or F) for Probability and Statistics between those taking the regular 3-semester hours version of the course and those taking the 4-semester hours learning support version of the course?
15. For students scoring an 18 on the mathematics section of the ACT, is there a significant difference in the proportion of students falling into each of the letter grade categories (A, B, C, D, or F) for Probability and Statistics between those taking the regular 3-semester hours version of the course and those taking the 4-semester hours learning support version of the course?
16. For students scoring a 17 on the mathematics section of the ACT, is there a significant difference in the proportion of students falling into each of the letter grade categories (A, B, C, D, or F) for Probability and Statistics between those taking the regular 3-semester hours version of the course and those taking the 4-semester hours learning support version of the course?
17. For students scoring a 16 on the mathematics section of the ACT, is there a significant difference in the proportion of students falling into each of the letter grade categories (A, B, C, D, or F) for Probability and Statistics between those taking the regular 3-semester hours version of the course and those taking the 4-semester hours learning support version of the course?
18. For students scoring a 15 on the mathematics section of the ACT, is there a significant difference in the proportion of students falling into each of the letter grade categories (A, B, C, D, or F) for Probability and Statistics between those
20
taking the regular 3-semester hours version of the course and those taking the 4-semester hours learning support version of the course?
Significance of the Study
More than half of United States high school graduates score below the college readiness benchmark of 22 on the mathematics section of the ACT. However, a large portion of these students are moving on into higher education. High school students in Tennessee average 19 on the mathematics section of the ACT, this is two points behind the national average of 21 (ACT, 2012). Regardless of this, thousands of these
students will be accepted into community colleges and regional universities. This may not be a major concern for highly selective universities, but regional universities that have a 70+% acceptance rate and cater to local populations simply cannot afford to turn this underprepared population away. Declining enrollment can lead to major budgeting concerns, classes cut, and entire programs being discontinued at some universities (Voket, 2015).
The TBR has suggested that community colleges are better equipped to deal with underprepared students (CCA, 2014). Four year universities cannot simply refer these students to a local community college for remediation with the expectation that they will return. Members of the Community College Research Center (CCRC) discovered that students who skipped a suggested remedial course and went directly into a college level course were less likely to succeed than their college-ready peers; however, they were more likely to succeed at a college level course than the students who completed the remedial class (Bailey, 2008). The reason for this is that most students who completed the remedial class never enrolled in its college level
21
counterpart. Many 4-year universities have implemented new ways to help students who are not performing at college-readiness levels succeedwithout using remedial or developmental courses. Institutions of higher education have an interest in retaining this population of underprepared students and seeing them graduate.
One solution is using a 1-hour learning support course, sometimes referred to as a “side cart,” to go alongside a college level course to assist in filling knowledge gaps leading up to the course and providing extra assistance for difficult concepts during the semester. Institutions use these classes to give underprepared students an increased opportunity to succeed and increase their likelihood of remaining at the university. Another solution has been to build this 1-hour course into the regular program, thus creating a 4-hour learning support course; however, only 3 hours would count for credit. Multiple programs have been implemented by the university being studied since the TBR mandate.
This study was designed to seek to determine the effectiveness of the 4-hour learning support method at a Tennessee university. If it is shown to be effective, it will be more plausible for other universities to use their own versions of this method of learning support. If it is found to be ineffective, the institution being studied or other institutions may look at this program in an effort to modify or abandon it altogether. In either scenario, this study will add to the body of knowledge currently being formed to assist 4-year universities in the selection and implementation of these important programs.
22
Limitations of the Study
This study was limited by the appropriateness of the theoretical framework in determining the success of students enrolled in a learning support program for Probability and Statistics. It was assumed that students who did not re-enroll in semesters following the probability and statistics course dropped out of school.
However, it is possible that many of these students transferred to another institution, but those data were not available. It was assumed that the ACT mathematics subsection score was an accurate representation of a student’s ability to succeed in a college level mathematics course. It was also assumed that information gathered from the office of institutional research was valid and reliable. It was further assumed that the
methodology used adequately addressed the research questions. It was assumed that the chi-square tests used were appropriate for the data and would have the power to detect significant differences in the data. Finally, it was assumed that students in the 2-year sampling frame were representative of the typical cohort of students at the
university being studied.
This study was delimited to students who had a valid ACT mathematics score that had been reported to the university being studied. Students who participated in the learning support program but did not have an ACT mathematics score on file with the university were excluded from the study. This study was further delimited by isolating letter grade in the course and 1-term and 2-term retention as the only measures of student success in the learning support program. Therefore, results from this study may not be generalizable to other settings or populations.
23
Definitions of Terms
Essential terms are defined so that the study may be more clearly understood. The following terms are defined as used in this study.
1. 1-term retention – When students who enrolled in a section (either learning support or not) of Probability and Statistics re-enrolled in the institution the following term, then the institution has retained them for 1-term.
2. 2-term retention – When students who enrolled in a section (either learning support or not) of Probability and Statistics re-enrolled in the institution the following 2 terms, then then institution has retained them for 2-terms.
3. ACT mathematics - American College Test. The ACT is a college readiness exam whose scores are accepted across the country as a benchmark for acceptance and an identifier for knowledge deficiencies. It is split into four subsections (English, Reading Comprehension, Science, and Mathematics) and these subsections are averaged to create a Composite score. For purposes of this study, only the Mathematics subsection was used.
4. College ready - Students who scored a 19 or above on the ACT mathematics subsection are considered by this particular university to be ready for introductory college level mathematics. The benchmark for college readiness set by the ACT is 22.
5. COMPASS - The COMPASS is a diagnostic test that is used to identify specific subject areas where students may have deficiencies. It is typically used as a placement tool and at this particular university it can be used as a second option for students who have not met the college readiness benchmark to test out of a
24
requirement for learning support. The COMPASS diagnostic test is created by the same company that creates the ACT exam.
6. Developmental Courses – Developmental courses are courses that are taught in a higher education setting that cover concepts that are not college-level (Parmer, 2007).
7. Remedial Courses - “While some researchers have distinguished differences between all of these terms (remedial, developmental, etc.), they are typically used interchangeably to refer to the same thing; coursework offered by a
postsecondary institution that is below college-level work” (Parmer, 2007). - see also Developmental Courses
Overview of Study
Chapter 1 contains an introduction to the study to include a description of its relevance and purpose, the statement of the problem, research questions, definitions of terms, limitations of the study, and a brief overview of the study. Chapter 2 provides a review of literature related to the topics of identifying the underprepared student population, common barriers to success for this population, contemporary studies in developmental education, and whether or not developmental education should be provided by 4-year institutions. Chapter 3 is a description of the study design,
population, data collection methodology, and procedures for data analysis. Chapter 4 offers an analysis of the data for each research question and information on the findings. Chapter 5 contains the summary, conclusions, implications, and
25
CHAPTER 2
REVIEW OF LITERATURE
Introduction
Policies over the past several decades have slowly increased the accessibility of higher education to all students; however, an increase in accessibility has not also equated to an increase in preparedness. This has led to a substantial rise in the population of underprepared students in higher education. Institutions have been wrestling with the issues of identifying this population, locating particular deficits in their education, and remediating these deficits so that they can succeed on the same level as their peers who entered college ready.
Many studies have been conducted at the institutional level to determine efficient and effective methods of remediation, but no national system has been proposed. The issue that is being debated at the state and national level is whether or not
developmental education should exist at 4-year universities. To eliminate remedial classes from 4-year universities, states have looked at programs at the secondary level that could eliminate the need for remediation and also move remediation to community colleges that may be better equipped to handle it. Having more college prepared students would be welcomed by 4-year universities, but losing the underprepared population of students, even for a year, may not be an option because of financial
concerns. An examination of literature has shown a relative consensus of views on how to identify underprepared students, various studies on the effectiveness of remediation, and differing opinions on whether remediation should exist in higher education.
26
The History of Developmental Education
In 1977 the majority of discussions about developmental programs in higher education involved ways to ignore or even eliminate them (Cross, 1976; Roueche & Snow, 1977). The topic of developmental education was typically avoided and, much like current discussions, the main ideas presented were that remedial classes should be either be eliminated from 4-year institutions and handled by community college or
completely eliminated from higher education. The only journal at this time dedicated to developmental education was the Journal of College Reading and Learning (JCRL). The JCRL exists today as the College Reading and Learning Association. The only professional association at the time was the National Association for
Remedial/Developmental Education in Postsecondary Education; now known as the National Association for Developmental Education (Boylan & Bonham, 2007).
The most influential work in the field of developmental education was published in 1979 by Martha Maxwell. It cited a great deal of research and gave many practical examples that are still used. The most recent edition was published in 1997. In 1980 the Kellogg Institute for the Training and Certification of Developmental Educators was established at Appalachian State University in Boone, North Carolina. This was the first professional development and certification program specifically for developmental
educators in the United States. It is still in operation; therefore, it is currently the longest running developmental education training program (Boyland & Bonham, 2007).
In 1984 the National Center for Educational Statistics (NCES) published a report on developmental education. This was notable because it was the first time that the U.S. Department of Education recognized developmental education as an area that was
27
important enough to warrant research. Since that time, three more reports have been published and developmental education is now included in “The Condition of
Education,” the U.S. Department of Education’s annual report.
In 1985 the National Center for Developmental Education conducted a national study of the best programs and practices in developmental education. The results of the study were used to compile a directory of exemplary developmental programs. This led to a national conference in Atlanta, Georgia on best practices in developmental education in 1986. At this time Grambling State University in Louisiana established the nation’s first doctoral program in developmental education, further legitimizing the field of developmental education (Boyland & Bonham, 2007).
The National Center for Developmental Education conducted a national study in 1990 that gathered information on 5,000 randomly selected students across 120
different colleges and universities. This study examined relationships between
methods, courses, organizational structures, and student outcomes (Boylan & Bonham, 2007). The results of the study were reported at the first National conference of
Research in Developmental Education in 1992. By providing empirical data, the national study validated various practices and improved the effectiveness and professionalism of developmental education.
In 1996 several of the major organizations in developmental education
established the American Council of Developmental Education Associations to promote collaboration; organizations include the College Reading and Learning Association, the National Association for Developmental Education, the Midwest College Learning
28
Center Association, the National Center for Developmental education, and the National Tutoring Association. It presently operates under the same name and is the
organization that names Fellows of the American Council of Developmental Education Association. This award is a recognition of outstanding contributions to the field of developmental education and is the highest honor in the field.
In 2004, the importance of developmental education was made clear when the field received publically stated approval and financial support. A $100 million dollar initiative named Achieving the Dream (www.achievingthedream.org) sought to improve the success of students with weak academic skills at 84 community colleges, naming developmental education as a part of its core (Bailey, 2008, pp. 27-28).
At a 5-year average, only 45% of our nation’s graduates met the ACT college readiness benchmark from 2009 to 2013 (ACT, 2012), making developmental education as widespread a need today as it has ever been. Even with all of the previous research and conferences, and with research continuing to emerge, the effectiveness of
developmental education is still debated and there is currently no consensus as to which practices in developmental education are the most valuable and effective (Levin & Calcagno, 2008).
The Underprepared Student Population
Millions of students are graduating from public and private high schools across the United States and are applying to and being accepted by institutions of higher education. Unfortunately, a large percentage of this population, approximately 68%, is
29
not yet ready for college level work (Bettinger, 2013). This population of students is identified as “underprepared.”
Students can be underprepared in many areas, but the majority of this
underprepared population will be deficient in mathematics and there are many different reasons. One reason is that mathematics is a stair-step subject where a deficiency in one area can affect a student’s ability to complete a task in another area. Another reason is that, similar to a foreign language, it is constant use of the concepts learned that promotes long term retention. A majority of high schools in the United States only require three mathematics courses to graduate. The typical student takes all three of these required courses by the end of their junior year of high school. This leaves an entire calendar year between when the student last applied these concepts and the start of their freshman year in higher education. This, along with the fact that many students use technology (cellular phones, calculators, etc.) to handle minor calculations needed in their day to day lives, leads to a large amount of knowledge being lost before
students even enter college (Boylan, 2011).
The entry point to higher education for 80% of 4-year students and nearly all two-year students will be a nonselective university, meaning that the bulk of the
responsibility of dealing with the underprepared population will fall on these nonselective universities (Bettinger, 2013). These institutions will be tasked with identifying the underprepared students and bringing them up to speed for college level courses.
30
Underprepared Student Identification
The tool used most often by institutions to identify deficiencies in student knowledge is the American College Testing (ACT) college readiness assessment. Students are measured on the exam as a whole using the composite score and on the subsections of the test including English, Mathematics, Reading, Science, and Writing. These subscores are used by most institutions as a baseline identifier of students who are underprepared in a certain area with the typical cut-score for preparedness being set at 19. Students who score under this threshold are typically assigned some form of remediation in that area.
The subscores are often used to identify deficiencies in particular areas; however, the composite score also has uses. Reason (2004) has shown the ACT composite score to be a powerful predictor of student retention with a one point difference in composite score equating to approximately a 1.6% increase in odds of retention. There are many factors that affect student retention, but the ACT composite score is often used as a baseline predictor of student retention in order to examine the efficiency of programs aiming to increase retention.
Unfortunately, these measures cannot be used universally as non-traditional students often have an outdated ACT score or no score at all. These students are given a wide variety of tests, the choice of which test is accepted being made by the admitting institution, to determine individual deficiencies; the most often used exams for these situations are the ACCUPLACER exam developed by College Board and the COMPASS exam developed by ACT. The COMPASS exam is also used as second
31
chance for students who scored below the ACT benchmark to test out of required remedial courses.
Success of Underprepared Students
Critics of remediation, mandatory remediation in particular, argue that remedial classes do not advance students toward degrees (Richardson, Fisk, & Okun, 1983). Levin (1999) summarized research supporting this viewpoint stating that students who are required to take multiple remedial courses often become discouraged and drop out; further, those who complete their remedial requirements and persist to graduate do so because of prior ability and motivation, not from skills acquired in the remedial courses. Levin also stated that a lack of research following up on students who participated in remedial programs was preventing administrators from evaluating long-term success the programs were generating (Levin, 1999).
In contrast, Schoenecker, Bollman, and Evans (1998) found evidence supporting remedial education. Schoenecker et al. split community college students into two groups: those who had been recommended to a remedial class and chose to attend, and those who had been recommended to a remedial class and chose not to attend. Schoenecker et al. found that the group who actually attended the recommended remedial class had higher average GPAs and 1-term retention rates than did their counterparts who did not attend the course. Further, Schoenecker et al. found that students who participated in a recommended remedial writing class passed the following college-level composition course at a rate 5% higher than the students who opted out of the remedial course. While this second result was not statistically
32
Looking past the 1-term or 2-term retention rate, the outcomes for underprepared students look significantly more bleak. The National Study of Developmental Education suggests that taking fewer remedial courses increases retention rates and graduation rates (Boylan & Saxon, 1999) suggesting that remedial courses are acting as a barrier for graduation. A study on a state community college system by the Little Hoover Commission (LHC) also shows an association between remedial course placement and low probabilities for degree completion (LHC, 2000). The LHC went on to examine all public community colleges in California for the 1998-1999 academic year and found that 80% of students completed their remedial courses, but only 24% of those students went on to take even a single higher level course. Transfer rates were also found to be incredibly low. Only 3% of California public community college students transferred to a 4-year school even though all students who completed 2 years at the community
college with a 2.0 or higher GPA were admissible (LHC, 2000).
Berkner, He, and Cataldi (2002) conducted a 6-year longitudinal study across the United States and found a much more favorable transfer rate of 25% from community colleges to 4-year universities. However, this transfer rate dipped considerably for students participating in developmental education. McCabe (2000) argued that remedial courses can improve a student’s life in many ways that cannot be measured by GPA, retention rates, or transfer rates, and that the economic benefits of helping even a small portion of underprepared students would outweigh the costs.
Students who complete the transfer from a 2-year to a 4-year institution may still face more obstacles; it is possible that they are less prepared than they realize. Friedl, Pittenger, and Sherman (2012) took the academic transcripts of 417 students at the
33
University of Tennessee Chattanooga and split them into groups based upon whether they had completed their remedial intermediate (high school level) algebra course at a 2-year or a 4-year institution. Students who had transferred their intermediate algebra course credit from a 2-year institution had significantly higher grades, on average, than students who had taken the course at the University of Tennessee Chattanooga or had transferred the class credit from another 4-year institution. However, students who had transferred the credit in from a 2-year institution showed substantially less success in subsequent math courses. This result suggested that grade inflation at 2-year
institutions may be allowing students who are less prepared than they seem to be to transfer to 4-year universities, leading to lower graduation rates for transfer students (Friedl et al., 2012).
In Tennessee, where essentially all students can attend their first 2 years of community college for free (through the program Tennessee Promise), there is more reason than ever for students to attend a 2-year institution. However, many states are also passing incentives for 4-year universities to raise graduation rates. This could create an atmosphere where students are encouraged by the state to attend a 2-year institution, but 4-year institutions are encouraged not to allow these students to transfer their credits as it may lower the institution’s graduation numbers (Friedl et al., 2012).
Remediation
The term remediation has been used along with terms such as developmental education, learning support, and non-traditional coursework. Some researchers have
34
distinguished differences between all of these terms, but they are typically used interchangeably to refer to the same thing; coursework offered by a postsecondary institution that is below college-level work (Parmer, 2007). Some institutions offer remedial classes and others offer developmental programs, but any difference between the two will not be found in the title. Differences found in programs are most often in how each institution is addressing the wide variety of barriers that underprepared students face.
Barriers
Minority populations have historically faced many barriers in the access to and success in higher education, and while access to higher education has increased over the last several decades, success has remained stagnant. One of the major barriers in access to higher education is financial aid which has been reformed multiple times. This barrier has led to populations that have been underrepresented due to issues of affordability and access to funds. Unfortunately, many of these students who are now able to attend a college or university find under preparedness for college level work to be an enormous barrier (Brock, 2010).
Remedial education has historically acted as “a gatekeeper and quality control mechanism in most institutions. It allows underprepared students access to campus facilities and resources, yet clearly divides them from students considered to be college ready” (Brock, 2010, p. 116). These underprepared students are attending colleges and universities, but are graduating at a much lower rate than their college ready peers. Forty-three percent of non-remedial students are attaining a 2 year degree within eight and one-half years of entry, but only 28% of remedial students are attaining their
35
degree. These numbers change to 78% and 52% respectively when examining completion rates at 4-year institutions (Brock, 2010).
First-Year Experience
Several institutions have put programs in place to bridge this retention and completion gap between prepared and under prepared students, with many of these programs focusing on social supports. These supports have been called First-year experience (FYE) programs and focus on guiding students through their freshman year (Upcraft & Gardner, 1989). All students will necessarily have an experience, whether it is a good one or a bad one, in their first year of college. A university in California
instituted a FYE program for all students, hoping to provide a more scripted experience that could help students, particularly underprepared students, persist through their first year and continue on through graduation (Barnes, 2012). These FYEs typically consist of orientation programs, freshman seminar courses, summer bridge offerings, or
learning communities (Barnes, 2012, p. 28). This particular college in California, along with several other institutions using FYE type interventions, found these programs to be successful in increasing retention of underprepared students (Barnes, 2012).
Kuh, Cruce, Shoup, Kinzie, and Gonyea (2008) conducted a similar study in which the relationship between first-year student engagement, academic achievement, and retention were examined. In Kuh et al’s study, engagement was defined as time spent studying, time spent in cocurricular activities, and a global measure of
engagement in effective educational practices; many of these measures being points of emphasis for FYE programs. Kuh et al. found that student engagement did have a positive relationship with both academic achievement and retention, and that this effect
36
was greater in at risk populations, one of the populations defined as at risk being underprepared students. Kuh et al. also observed that academic preparedness was a significant factor in academic achievement and retention in the beginning, but by the end of the first year it is far less significant than factors such as student engagement. This was exemplified by a surprising number of students with high ACT/SAT scores, good first year grades, and no financial barriers for re-enrolling in their second year.
Taylor (2015) focused a study specifically of freshman orientation and its effect on grade point average and retention at an Alabama community college in 2012. Taylor found that freshmen who attended orientation were more likely to have higher grade point averages, higher fall-to-spring persistence, and higher fall-to-fall persistence than freshmen who did not attend orientation. Taylor also found that placement into
developmental courses had no relationship with these variables.
The United States government, as well as state governments, attempted several times to reform developmental education in an attempt to increase retention and
success of underprepared students. However, these reforms have rarely been
evaluated in a way that establishes relationships between the reforms and educational attainment (Brock, 2010). This is not to say that studies on developmental education do not exist, just not on a nationwide scale. Several studies have been conducted on the effectiveness of developmental classes. (Ayecaster, 2001; Bettinger, Boatman, & Bridget, 2013; Bettinger & Long, 2004; Boylan & Saxon, 2001;;). Each study points to different factors that may help or hinder developmental education. Currently, there is no consensus between policy makers, teachers, students, or scholars as to which practices
37
in developmental education are the most valuable and effective (Levin & Calcagno, 2008, p. 132).
Contemporary Studies on Developmental Education
According to a study from 2004, although developmental education can help bridge the gap between prepared and under prepared students, it does not put them on the same level. The subjects of this study were students who enrolled in a
microeconomics class (ECON 101) and were also required to take developmental math (DEV 101) at a large Midwestern university. Some had already completed DEV 101 while others had put the class off, as it was not a requirement for ECON 101. It was shown that although students who required DEV 101 did not perform at the level of students who did not require the class, of the students who required DEV 101, those who had taken DEV 101 did outperform those who had not yet taken it (Johnson, 2004). Johnson claimed that students did benefit from the developmental course; however it did not fully prepare them to perform on the same level as their peers who did not require the developmental course.
A study at a different university was performed in the same year on another microeconomics course in which 1,462 microeconomics students were examined in four categories involving mathematics to see if any were predictors of success in the course. The categories were ACT Math Score, if they had taken Calculus, if they had taken a remedial mathematics course, and a test score on basic mathematical concepts. All four were found to be significant predictors (Ballard, 2004). Being enrolled in a remedial class showed a reduction in predicted achievement. Taking calculus at the high school level showed an increase in predicted achievement.
38
Ballard and Johnson also used the basic math skills test in combination with class history. If a student scored poorly on the test and had taken remedial math, that student was less likely to succeed in the class (Ballard, 2004, p. 17). A comparison of students who required a remedial class but had not yet taken it versus students who had already completed the remedial class was not made at the participating university as the developmental course was a prerequisite to the microeconomics class if
required.
According to Woodard (2005), simply increasing the amount of time that students spend in developmental classes does not necessarily equate to higher rates of retention and success. A community college in Southwest Virginia compared the success rates of students who took a 5-hour developmental math class to those who took a 3-hour version of the same course. The results showed no significant difference in the exit exam scores of these two classes but did show a decreased enrollment in the 5-hour course, leading Southwest Virginia Community College to cancel future sections of the 5-hour course (Woodard, 2005).
A community college in Northeast Tennessee was examined to determine how much of an impact remedial courses had on a student’s chance to graduate. Yates (2010) examined 2,326 students to determine if the number or type of developmental courses they were taking significantly affected their odds of graduating within 3 years at a community college. The results showed that taking a remedial course lowered your chance of graduation. The number of developmental courses taken was also shown to have an effect on graduation to the point that only 7.2% of students studied who took
39
developmental classes in all three areas (math, English, and reading) persisted to graduate in 3 years (Yates, 2010, p. 55).
Developmental courses have in some cases been shown to reduce the gap in knowledge between prepared and under prepared students, but they have not
completely eliminated the discrepancy and in some cases have served as a grim predictor of failure. This has led some to question who should be handling remedial education, or if it should exist in higher education at all.
Developmental Education at 4-Year Universities
The majority of policy makers in the United States believe that all students should have access to higher education; however, there has recently been a movement for 4-year institutions to become more selective and thus push developmental education and underprepared students toward 2-year colleges (Brothen, 2004). This is the stance that has been adopted by the Tennessee Board of Regents in recent years. TBR has
moved the responsibility of remediating underprepared students to community colleges and has ordered 4-year universities to stop teaching courses that are not college level.
Opponents of this course of action have argued that many developmental students have deficiencies in only one or two areas, that these students have been successful in 4-year educational programs, and that asking them to complete one class in a community college before entering a 4-year university would be unreasonable (Dameshek, 1999). Another issue arises in the economics of this situation. Four-year universities may not be able to afford to lose these students when it is argued that the remedial classes pay for themselves. Not all 4-year universities find themselves in the
40
same financial position. Major and private universities such as Harvard and Duke could cut out remedial education relatively easily, but this might not be as simple a task for state universities who often serve populations that are chronically underprepared. Brothen and Wambach (2004) concluded that remediation of some form will always exist in higher education stating “it’s simply a matter of how educators choose to go about handling the responsibility of seeing to it that basic skills are improved while quality content is taught and standards are maintained” (Brothen & Wambach, 2004, p. 22).
Regardless of 2-year institutions’ preparedness to effectively remediate underprepared students, 4-year institutions may not be able to simply refer
underprepared students to a community college with expectations that they will return. Members of the Community College Research Center (CCRC) discovered that
underprepared students who skipped their suggested remedial course were more likely to succeed at a college level course than students who completed the remedial class (Bailey, 2008). On its face this would seem to point toward remedial courses being ineffective, however Bailey cited the reason for this being that a large portion of students who completed a remedial course never enrolled in its college level
counterpart. Remedial students who completed the course tended not to continue on to the next course.
Another barrier between completing needed remedial work at a community college and then continuing on to attain a 4-year degree is the transfer itself. Bailey found that students who completed a remedial course possibly never transferred to the 4-year institution that likely required the course. Other studies have shown that transfer
41
status is negatively related to persistence (Pascarella & Terenzini, 2005). An
information problem exists because whether a student who does no re-enroll chose to transfer or to drop out is often not clear. Bettinger (2004) cited this issue when he found that students placed in a remedial course, particularly into remedial math, tended to be more likely to drop out, but he could not know how much of this effect was due to the “institution-transfer-swirl” phenomena in which students persist to their baccalaureate degree, but through multiple institutions, and this information never makes it back to previous institutions (Kuh, 2008).
This is a disturbing trend for most 4-year institutions as losing the underprepared population would cut down a great deal on their enrollment. With a 1 year limit on remedial work, 4-year universities in California expelled 7% of their freshman class for “failing to master basic English and Math skills” in fall of 2001 (Trounson, 2002). Many schools simply cannot afford this. Highly selective universities will suffer virtually none from losing this population as they were likely never admitted. The 25th percentile ACT
score for admitted freshmen at Harvard College is 31 (NCES, 2014b), but for the nonselective 4-year institutions that make up approximately 85% of all postsecondary schools (Kirst, 2004), this loss could be devastating. Declining enrollment has led to major budget concerns for many 4-year universities. South Carolina State University has pointed to reduced enrollment as a cause to shut down the institution altogether (Voket, 2015). It is possible that barring some form of financial relief, referring
underprepared students to different institutions to complete remedial work may not be an option.
42
Tennessee High School Math
There is no national set of standards for education in the U.S.; therefore, states are allowed to set their own standards and requirements. Tennessee, as most states, requires Algebra I, Geometry, and Algebra II (or Math I, II, and III) along with one advanced mathematics course in order to graduate high school. Math I, Math II, and Math III are referred to as the integrated curriculum as they integrate ideas from both algebra and geometry and teach them in levels of increasing difficulty. An advanced math in Tennessee can be any of the following courses: Advanced Algebra and
Trigonometry, Bridge Math, Calculus, Discrete Mathematics, Precalculus, Senior Finite Math, Probability and Statistics, and most recently SAILS math (Tennessee Department of Education, 2015). Tennessee also requires students to take a math class every year, not just four math classes. For example, if a student took Algebra I and Geometry their freshman year and Algebra II their sophomore year, although this is already 3 credits, they would still be required to take an advanced math their junior year and another their senior year. The reasons for this requirement are unclear and no other high school subject area shares this requirement.
There are data supporting the requirement of an advanced math before
graduation. Long, Conger, and Iatarola (2012) found that students who took rigorous courses were substantially more successful in college level courses than those who did not. The estimated effect was even greater for disadvantaged students or students who attended schools in poor neighborhoods. Belfield and Crosta (2012) found similar results. Using a statewide community college system, they were able to obtain transcripts for every community college student in their state from the fall 2008
43
semester to the summer 2010 semester. Belfield and Crosta found that there was a significant positive relationship between the number of honors classes that a student took in high school and both their college grade point average and number of college credits earned. They also discovered that there was a significant positive relationship between the number of math classes taken in high school and both college grade point average and number of college credits earned.
Dual-Enrollment classes, college credited higher education classes offered by institutions of higher education to high school students through a partnership, have also shown benefits to high school students (Struhl & Vargas, 2012). Jobs for the Future (JFF) followed over 32,000 Texas students from the 2004 high school graduating class. JFF used a propensity score matching model to account for students’ backgrounds so that the benefits of Dual-Enrollment classes could be examined. JFF found that
students participating in Dual-Enrollment programs were 2.2 times more likely to enroll in a Texas 2-year or 4-year college, 2 times more likely to return for a second year of college, and 1.7 times more likely to complete a college degree. The increase in likelihood of earning an associate’s degree only went from 6.8% (non-Dual-Enrollment group) to 8.9% (Dual-Enrollment group); however, the likelihood of earning a bachelor’s degree showed a drastic increase going from 30.2% (non-Dual-Enrollment group) to 47.2% (Dual-Enrollment group). These studies would suggest that students who are taking more math courses and more rigorous math courses are more likely to be successful and have higher retention rates in college.
44
College Remediation at the High School Level
One solution has been to provide Early Assessment Programs (EAP). In an EAP used in the state of California, students are given a diagnostic exam during the second semester of their junior year of high school. Students who fail a portion of the exam, are told that their “skills are not yet sufficiently strong to succeed in required college English courses” (CSU, 2008).
Even if the EAP indicates to students that they are not prepared for college level work before their senior year begins, it does not put a plan in place to prepare the student. Rather, it gives recommendations for ways the students can prepare themselves, some of whom, for example, are taking a senior level English or math class, the student would have already done on their own. Unfortunately, the majority of students who fail this exam are students in systems that lack quality instruction to begin with (Tierney, 2008). Asking these students to seek out their own solutions for college readiness when their system is ill-equipped to help them has shown to be ineffective (Tierney, 2008)
Another high school level solution has been to increase the number of advanced classes offered to students with the hope that taking more rigorous courses would better prepare students for the college level. Long (2008) showed this to be effective. In Long’s study, Floridian students showed a positive relationship between college
readiness and highest level of mathematics taken in high school, with the largest boost coming from Algebra 2. However, this relationship was not equal among racial and socioeconomic factors; black, Asian, and low socioeconomic students saw small returns. Another shortcoming of this strategy was shown with the EAPs, in locations
45
where quality instruction can help college preparedness, students do not have access to it. All students in Tennessee have the opportunity to take Algebra 2, shown to have the greatest effect of the math classes on college readiness. However, as of 2011, less than one half of Tennessee’s students were proficient in the subject (TDOE, 2013).
One issue affecting students’ preparedness for college is that there is a large gap between students’ high school experience and what is expected in college. Students are finding that the work and thought processes that are required for college-level classes are fundamentally different that those that were successful at the high school level (Conley et al., 2006).
Conley (2007) suggests four improvements that could be made on the high school level to increase college preparedness:
1. Align high school curriculum and instruction with college expectations. High schools can work with local colleges to examine the content difficulty of freshman level college courses. This would be used to better pace high school curricula so that the gap from a senior high school course to a college freshman course is not so large.
2. Develop high-quality syllabi. College syllabi are subject to external review while high school syllabi rarely are. This leads to vast differences in the content covered from course to course at the high school level, even amongst courses with the same name. By requiring high school courses to present high-quality syllabi, course content could be standardized and better aligned with college expectations. Furthermore, this would encourage teacher collaboration within departments and better understanding of course expectations by both students and their parents.
3. Implement senior seminars. A senior seminar course is a high school level course that is taught with college expectations. A course such as media and culture can be offered at the high school level, but the pace, rigor, feedback, and questioning would mirror that of a college level course. Students participating typically see increases in reading comprehension, technical writing, and critical-analysis skills.
46
4. Add missing content to high school courses. Several skills such as increasing the amount of quality writing and requiring students to defend mathematical solutions are not a part of class expectations in many high schools. Adding these as course expectations at the high school level allow students time and practice to develop these needed skills.
One program in Tennessee is introducing the college developmental math
curriculum to students during their senior year of high school. The Seamless Alignment and Integrated Learning Support (SAILS) program is essentially allowing students to take a needed college remedial math class before leaving high school. Students typically take the ACT during their junior year of high school. After receiving results, juniors will already know if they will require some form of learning support in English, mathematics, or reading at their chosen college or university. The SAILS program will allow students who are deficient in mathematics to fulfill their learning support
requirements during their senior year of high school (Volunteer, 2015).
The SAILS program has shown promising results. The program pilot was in 2013 and involved 600 high school seniors in Tennessee. Of the 200 students from the Chattanooga region 83% completed their college remedial requirements. Also, 25% of those students went on to complete a credited college math course (nonremedial) before high school graduation; essentially completing all of the mathematics they would need at the college level before even arriving at their college (Fain, 2013). The program has received $1.1 million dollars in funding from the state of Tennessee and has
expanded to 114 high schools serving more than 6,500 students. It is expected that the program will soon be offered by every high school in the state (Fain, 2013).