Essays on the Economics of Education and
Labour
A thesis submitted for the degree of Doctor of Philosophy in
Economics
by
Greta Morando
Institute for Social and Economic Research
University of Essex
Declarations
No part of this thesis has been submitted for another degree.
Chapter 2 is co-authored with Professor Emilia Del Bono. The other chapters in this thesis are exclusively mine.
An early draft of Chapter 3 has been previously published in the ISER Working Paper Series (No. 2014-29, September, 2014) as “Partner ethnicity and ethnic minority socio-economic occupation. Evidence from the UK”.
Acknowledgements
I am very grateful to the Economic and Social Research Council for the generous scholarship and other opportunities that it has offered me, especially the pos-sibility of visiting overseas universities. I am particularly grateful to Professor Marianne Page who made possible the visiting period at the University California Davis, where I found a wonderful research environment, which was both challeng-ing and very friendly at the same time.
I started the PhD under the supervision of Dr Alita Nandi and Dr Maria Iacovou, whom I both thank. I am very grateful to Professor Emilia Del Bono who became my first supervisor from the second half of my second year of PhD. She introduced me to the economics of education and increased my confidence as a researcher. I am particularly grateful to Professor Mike Brewer who became my second supervisor in the second year of my PhD. He has always been very present and helpful and has had an important impact on all my PhD chapters.
I am grateful to the Economics Department of Essex for providing me the possibility of teaching economics courses and for the support at the end of the PhD in the transition to the job market.
I am grateful to all my friends whom made this journey particularly pleasant. Thanks to my parents and to my grandmas for their constant support. A huge thanks to my companion for life for always being at my side. Thanks Adam.
Summary
Chapter 1 provides the first evaluation of a recent educational reform in England which reduced the content of the mathematics module studied by pupils aged 16-18. Using the National Pupil Database we look at the reform’s impact on the probability that secondary school students will choose mathematics, and their attainment. We use information on previous academic achievement and other individual characteristics to understand which students have been mostly affected. We show that this reform sheds new light on one of the most important questions in education research: why women are less represented in STEM fields.
In Chapter 2, we exploit variation in the labour demand to investigate whether the first job destination of graduates from different socio-economic backgrounds is differently affected by the business cycle. We use the Destination of Leavers from Higher Education survey and the Labour Force Survey across the period 2003-12. When the labour market is tight graduates from disadvantaged backgrounds are more likely to choose to study for a professional qualification. Those who become active labour market participants have more trouble finding a job, and those who find employment experience lower job quality. We provide evidence of the importance of social capital in explaining these findings.
In Chapter 3 we contribute to a recent branch of the economic literature on how social integration affects labour market opportunities. This literature compares the labour market outcomes of ethnic minorities who are in a co-ethnic partner-ship to those who choose a partner in the majority population . An important pre-requisite of these analyses is the extent to which these two types of partner-ships can be compared. We analyse this hypothesis formally using a propensity score approach in Understanding Society data. The characteristics of these part-nerships are such that they should not be compared even within narrowly defined subgroups.
Contents
1 Gender and the choice of Maths at post-secondary school:
ex-ploiting a curriculum reform 1
1.1 Introduction . . . 1
1.2 Related literature and our main contributions . . . 7
1.3 Data and institutional setting . . . 10
1.3.1 The English educational system . . . 10
1.3.2 Data and sample selection . . . 11
1.3.3 The Maths Curriculum Reform . . . 13
1.4 Empirical framework . . . 17
1.5 Results . . . 20
1.5.1 Who responded to the MCR? . . . 22
1.5.2 Threat to identification . . . 26
1.6 Has the MCR affected boys and girls differently? . . . 28
1.6.1 Gender and Maths ability . . . 29
1.6.2 Is gender composition important in determining subject choices? 32 1.7 Summary and conclusions . . . 38
Appendices 55 A1 The Maths courses . . . 55
A2 Sample selection and other adjustments to the original data . . . 57
A3 Available statistics on A-level entries . . . 58
A4 The MCR in detail . . . 61
2 For some, luck matters more: the impact of the Great Reces-sion on early careers of graduates from different socio-economic
backgrounds 71
2.1 Introduction . . . 71
2.2 Institutional settings . . . 76
2.3 Empirical strategy . . . 78
2.4 Data and descriptive statistics . . . 82
2.4.1 Data . . . 82
2.4.2 Sample selection . . . 83
2.4.3 The SES index . . . 85
2.4.4 How do students with different SES differ? . . . 87
2.4.5 Measuring labour demand . . . 89
2.5 Results . . . 91
2.5.1 The consequences of graduating in bad times . . . 91
2.5.2 Heterogeneity: gender, STEM field, and quality of university 95 2.6 Possible mechanisms . . . 97
2.7 Robustness checks . . . 100
2.8 Is graduating in bad times having longer-lasting consequences? . . 102
2.9 Conclusion . . . 105
Appendices 129 B1 University groups . . . 130
3 On the comparability of ethnic minorities in inter-ethnic and co-ethnic partnerships 133 3.1 Introduction . . . 133
3.2 Empirical strategy . . . 139
3.2.1 Implementation of PSM . . . 142
3.3 Data and descriptive statistics . . . 144
3.3.2 Description of the covariates and the labour market outcomes146
3.4 Results . . . 149
3.4.1 Modelling the selection equation . . . 149
3.4.2 Are inter- and co-ethnic partnerships comparable? . . . 151
3.4.3 Sub-sample analysis . . . 154
List of Tables
1.1 English educational system . . . 45
1.2 Summary statistics . . . 46
1.3 AS uptake: different specifications . . . 47
1.4 Effect of the MCR on uptake and attainment . . . 48
1.5 Ability composition in Maths classrooms . . . 48
1.6 School heterogeneity . . . 49
1.7 Gender heterogeneity . . . 50
1.8 AS Maths uptake by gender: KS4-school FE model . . . 51
1.9 AS Maths uptake: mixed/single-sex schools switching endoge-nous regression . . . 52
1.10 AS Maths uptake: gender heterogeneity by share of female class-mates . . . 53
A1 List of Maths courses in the NPD . . . 56
A2 Sample selection and restrictions . . . 57
A3 Changes in Maths curriculum . . . 62
A4 Robustness checks . . . 63
A5 Gender heterogeneity: attainment . . . 64
A6 Heterogeneity effect of the MCR across different socio-economic and demographic groups . . . 65
A7 Signals of academic ability by type of school and gender . . . . 69
2.1 SES index . . . 113
2.2 Summary statistics of main explanatory variables . . . 114
2.4 The effect of graduating in bad times by SES - Job quality . . 116
2.5 Quantifying the contribution of the recession to the SES gap . 117 2.6 Heterogeneity: activity status . . . 118
2.7 Heterogeneity: job quality . . . 119
2.8 The effect of graduating in bad times by SES - Mechanisms . . 120
2.9 Conditioning on pre-university academic attainment: activity status . . . 121
2.10 Conditioning on pre-university academic attainment: job quality 122 2.11 Imputed (ln) salary . . . 123
2.12 Non-response . . . 124
2.13 Are the 6 months outcomes good indicators of the 3.5 years outcomes? . . . 125
2.14 Outcomes at 3.5 years after graduation . . . 126
2.15 Regret and career satisfaction at 3.5 years after graduation . . 127
B1 Sample selection . . . 129
3.1 Sample selection and restrictions . . . 161
3.2 Summary statistics: men . . . 162
3.3 Summary statistics: women . . . 164
3.4 The determinants of being in an inter-ethnic partnership . . . . 166
3.5 PSM estimates: men . . . 169
3.6 PSM estimates: women . . . 170
3.7 Subgroups: men . . . 171
List of Figures
1.1 A-level and AS Maths entries 1996-2013 . . . 42
1.2 A-level and AS Maths by KS4 cohort . . . 43
1.3 Uptake and attainment of Maths by ability group . . . 44
A1 A-level Maths uptake by different data sources . . . 59
A2 Gender differences in academic attainment . . . 70
2.1 SES indicators . . . 107
2.2 Labour market outcomes - Activity status . . . 108
2.3 Labour market outcomes - Employed graduates only . . . 109
2.4 Unemployment rate by graduate/non-graduate population . . . 110
2.5 Graduate unemployment rate by field of study . . . 110
2.6 Unemployment rate between and within LAD . . . 111
2.7 Mechanisms . . . 112
B1 Job found through... . . 132
3.1 Labour market outcomes: inter- and co-ethnic partnerships . . 158
3.2 PS kernel densities: men . . . 159
Chapter 1
Gender and the choice of Maths
at post-secondary school:
exploiting a curriculum reform
1.1
Introduction
The supply of workers in the fields of Science, Technology, Engineering, and
Math-ematics (STEM)1 is a primary concern for policy makers. This concern dates back
to the 1980s with the US report “A Nation at Risk. The Imperative For
Edu-cational Reform”.2 This was one of the first public recognitions of how the
edu-cational system and its standards, in particular in Maths and scientific subjects, are fundamental for the socio-economic well-being of a country. Although in more recent years a debate has emerged on whether there is a real shortage of STEM
workers,3 increasing the supply of such workers remains a relevant concern in most
corners of the world. To increase the supply of STEM workers some countries, alongside educational programmes to increment the internal supply, have adopted
1The acronym STEM is widely used and stands for Science, Technology, Engineering, and Mathematics. More generally, it is used to indicate the whole spectrum of subjects and fields which require a good level of mathematical skills.
2Gardner, Larsen, Baker, Campbell, and Crosby (1983).
more generous migration policies to retain or attract STEM high-skilled workers.4 In England, the country on which we focus in this study, the supply of STEM workers has been recognized as an important issue in several reports and
gov-ernment enquires.5 For example, the Council for Industry and Higher
Educa-tion (CIHE) in a 2009 report (Herrmann, 2009) states that “[c]urrently we are vulnerable as a nation as our businesses and university STEM departments are over-reliant on overseas postgraduates in particular. [...] Businesses are recruiting Maths graduates from India and other Asian nations.” The CIHE argues that the root of the problem lies in the post-secondary schooling system, the educational stage which is the focus of our analysis.
In this paper we exploit a reform that has changed the cost of studying Maths in post-compulsory education to investigate who the marginal students are, i.e. those that can be moved to study Maths. The reform that we study was introduced in 2005 and affected the Maths curriculum with the aim of increasing the low demand for Maths from students during post-compulsory school (16+ years old). From now on we refer to this reform as the Maths Curriculum Reform (MCR). The MCR was a large scale reform involving all post-compulsory schools in England,
i.e. year 12 and 13.6 This level of education is referred to as Key Stage 5 (KS5).
About half of the population of students completing compulsory schooling keeps studying at KS5, the other half undertakes vocational courses or enters the labour market. This reform reduced the amount of material across the two-year course of Maths by dropping one module in Applied Maths. We use this change of curriculum in England as a natural experiment that provides a variation in the (expected and actual) cost of studying Maths and we look at its impacts on the
choices made by students, and their attainment in this subject.7
4An example of these are the HB1 visa and the STEM Job Act 2012 and 2015 in the USA or the Blue Card Directive in Europe. The rationale behind these policies is that STEM workers are important not only for the industries and sectors in which they are employed, but they are also relevant in promoting growth through the creation of jobs in other sectors - for example, see Peri, Shih, and Sparber (2015).
5BIS (2014); DTI (2004).
6This is equivalent to the 11thand 12thgrades in senior high school in the US.
Furthermore, we will show that this reform sheds new light on one of the most important questions in education research: why women are less represented in STEM fields. Girls are under-represented among students in STEM subjects in secondary and Higher Education, and among workers in STEM fields (Botcherby & Buckner, 2014). Decreasing the gender gap in STEM subject participation is crucial for promoting gender equality in opportunities and increasing the overall population in those fields. We know that jobs related to STEM fields are more
remunerative that those in non-STEM fields.8 If, as it has been showed, girls
on average perform as good as, if not better than, boys in Science and Maths in compulsory school (DfE, 2007; C. Smith, 2014), then it is crucial to understand why they choose to opt out from the study of these subjects in post-compulsory schooling. In fact, when specialization occurs in the educational system, both boys and girls tend to specialize in those fields dominated by their gender, conditioning on previous academic performance (C. Smith, 2014). In our sample of high Maths-ability achievers, on average 47% of boys and 30% of girls study Maths in year 12 and 33% of boys and 19% of girls study Maths in year 13. The cohorts affected by the reform show an increase in the average uptake of Maths at year 13 which is of 1 percentage point for boys and of 2 percentage points for girls.
A variety of studies in economics and other disciplines (discussed in the follow-ing section), show that social forces are important in explainfollow-ing why girls decide that those fields are not for them, highlighting the importance of gendered atti-tudes and expectations. We therefore investigate whether boys and girls of high Maths ability responded equally to the fall in the cost of studying Maths. The main hypothesis is that if they both are equally aware of their ability they will respond in similar ways.
Before investigating the relevance of gender in the choice of whether to study
8(Dolton & Vignoles, 2002) focus on grade 12 in England and the labour market returns of the advanced Maths curriculum (known as further Maths). By analysing a cohort study on individuals born in the first week of March 1958 they find that, when keeping ability constant, studying advanced Maths A-level corresponds to a 7%-10% wage premium. This is mainly because of the way that this subject is highly valued in the labour market.
Maths, we first have to evaluate the overall impact of the MCR. We are the first to provide an exhaustive evaluation of this national curriculum reform and to exploit it as a large-scale experiment to contribute to the literature on the determinants in human capital investment. To assess whether the MCR has had any impact on uptake and attainment of Maths we use a before/after design. We compare uptake and attainment of students in Maths in post-compulsory school who obtained their compulsory schooling one and two years before the introduction of the MCR, with the uptake and attainment of those affected by the MCR. More precisely, we compare the cohorts of students who obtained their compulsory schooling in 2002 and 2003 to those who obtained it in 2004 to 2007. The reform was introduced in year 2005. The first cohort affected is the one that finished compulsory schooling in 2004 and that enrolled in year 12 in 2005. The other cohorts that we observe in our data that have been affected by the reform are those who finished year 11 in years 2005, 2006, and 2007. Students obtaining their compulsory schooling in 2002 and 2003 were meant to enter into post-compulsory school in years 2003 and
2004 respectively, and hence could not be affected by the MCR.9
We find that the MCR increased Maths uptake by 7% in the first year of post-secondary school. However, this did not result in a significant expansion in the following year of schooling, because the rise in uptake was offset by a fall in pass rates and grades at the end of the first year. We shed light on the heterogeneous effects of the reform across the ability distribution of students. The reform has increased the uptake of Maths by the most academically able students. Interestingly, those who have been affected by the MCR in terms of uptake are not the same students who bring the average attainment down in the post-MCR period, both in terms of passes and grades. We suggest that changes in class size and ability composition could explain these findings. We finally provide evidence of the heterogeneity of uptake and attainment by school type suggesting that some
9This is true unless they took gap year(s) between the two stages of education. This would be a problem especially if it occurred because of the announcement of the implementation of a curricular change in the post-compulsory school. However, given that the MCR was implemented in a sudden manner we can exclude any anticipation effect.
schools had more resources than others to enable their students to take advantage of the incentive offered by the MCR.
In the second year of post-compulsory schooling we find that the MCR has significantly affected the likelihood of students acquiring Maths for girls only. After the MCR, there has been a rise in Maths uptake for girls of 6% in year 13. We do not find that this is the case for boys who do not experience any statistically significant change in Maths uptake in the second year. This result is driven by an initial divergence in the change of Maths uptake in the first year by boys and girls after the MCR. The changes in the composition of students within Maths classes have in turns affected attainment - there is a significant decrease in Maths passes and grades for boys only. Because it is difficult to disentangle all these direct and indirect effects of the MCR, in the second part of the paper we will focus on one outcome in particular, the uptake of Maths in the first year of post-compulsory schooling and how and why girls and boys have been differently affected by the MCR.
We assume that individuals maximize their utility by choosing to study those subjects in which they fare best. However, it could be that the signal of one’s own ability is a function of the social environment in which individuals interact with their peers and build the perception of themselves. For example, the gen-der composition of peers with respect to which the signal of one’s own ability is created, could affect how individuals interpret that signal, or in other words, the weight or strength that they give to it. If academic subjects are affected by a gender stereotype (they are either for boys or girls) and if gender characteristics are stronger in a context where gender definition is more important, we could expect that the same signal of ability could be weighted differently depending on whether this is formed in an environment with a low/high share of same-sex individuals. Since we are studying the uptake of Maths, a “subject for boys”, we could expect that the share of same-sex peers would be an issue especially for girls (we would expect boys to be more affected by peer gender if we were considering,
for example, English literature).
We test this hypothesis empirically by comparing pupils who were in single-sex and mixed-sex schools at the educational stage just before the one affected by the MCR (i.e. when the decision on what to study at KS5 is made). We find that the percentage of girls studying AS Maths after the reform has increased much more in mixed-sex schools than in single-sex schools. For boys, the change is ap-proximately the same in both types of schools. These estimates might be affected by endogeneity given that students select into these schools. After accounting for selection by using the endogenous switching regression model, our results change. Being allocated to an environment in which there are only girls increases the like-lihood of girls positively responding to the MCR by taking Maths at KS5. We find consistent results when we consider the population of students in mixed-sex schools only, which does not present the problem of selection, where we exploit the idiosyncratic variation in gender composition of Maths classmates within KS4 school. When the share of females is high, the MCR makes girls more likely to study Maths at KS5, while for boys we do not find any statistically significant effect. One possible explanation that we offer is that girls weigh their Maths abil-ity differently from boys. This is what makes them the marginal students who responded to the incentive offered by the reform.
The remainder of the chapter is structured as follows. Section 1.2 considers the main branches of the economics literature this paper relates to and highlights the main contributions to them. Section 1.3 describes the institutional context and the dataset that we use. Section 1.4 explains the empirical strategy that we adopt to evaluate the effects of the MCR. Section 1.5 describes and comments on the results on Maths uptake and attainment, and Section 1.6 focuses on the gender analysis. Finally, Section 1.7 concludes.
1.2
Related literature and our main
contribu-tions
We contribute to the literature in interventions on the Maths curriculum at secondary school (Cortes & Goodman, 2014; Cortes, Goodman, & Nomi, 2015; E. Taylor, 2014). The interventions studied in the cited papers are short-lived or implemented in a small setting and consist in an increase in the time (classes) allo-cated to Maths teaching. They are usually targeted to particular ability groups of students.10 The MCR differs from all these interventions because, first, it affected a whole nation, second, it was not addressed to a particular group of students, and, third, it involved a change in the cost of studying Maths (rather than a compulsory change in exposure to the subject).
An intervention that is closely related to ours is studied in Joensen and Nielsen (2009, 2014), who look at the impact of choosing to study Maths on school and labor market outcomes. They study a change to the secondary school curriculum that took place in Denmark in 1988, and which lowered the cost of studying Ad-vanced Maths by introducing the option of choosing a combination of AdAd-vanced Chemistry and Maths alongside the standard option of Advanced Physics and Maths. Joensen and Nielsen (2009, 2014) use the pilot of this reform in an IV ap-proach and find a causal relationship between Maths and earnings, mainly driven by a resulting increase in Higher Education participation. This is true especially for high Maths ability girls, who are more likely to go to more Maths-intensive college degrees and to reach more prestigious careers.
While the papers of Joensen and Nielsen are highly related to ours, there are
10Cortes et al. (2015) and Cortes and Goodman (2014) show that that Double Dose Algebra classes have had positive effects on academic achievement at high school (especially for low-ability readers) as well as on school graduation and enrolment rates. In line with it, E. Taylor (2014) shows that the remedial classes in Miami schools have had positive effects in Maths achievement in the first year of high school. The effects then gradually become smaller in the following two years. Goodman (2012) instead looks at the introduction for the first time of a minimum number of years in Maths required to acquire a high school diploma. He finds that this reform closed one fifth of the earnings gap between black and white males by positively affecting black male students in non-white schools.
some important differences. First, Joensen and Nielsen look at the effect of the introduction of the option of pairing Maths with Chemistry alongside the
Maths-Physics option.11 Instead, we provide evidence on the effect of reducing the cost
of studying Mathsper se. Second, Joensen and Nielsen do not observe the
Maths-specific ability of students (they only have average GPA score), while we condition on prior Maths-specific and general academic achievement. Finally, we dig deeper into the reasons why we find a gender differential in the response to the reform in terms of uptake.
This paper also contributes to the literature on human capital investment and, in particular, to the literature on the choice of the field to study. The latter focuses mostly on the choice of study at university by using elicitation of beliefs, structural models, and a mix of both (Arcidiacono, 2004; Arcidiacono, Aucejo, & Hotz, 2016; Malamud, 2010, 2011; Stinebrickner & Stinebrickner, 2014; Wiswall & Zafar, 2015). We contribute by using a quasi-experimental approach that works as an incentive (a fall in the cost of studying Maths) to make certain human capital investment.
There is a large literature which is interested in understanding how gender differences in human capital accumulation emerge. The fact that females with high mathematical ability do not choose to pursue studying Maths could be related to cultural and environmental factors which shape gender characteristics such as self-confidence in one’s own ability, competition taste, and risk aversion (Niederle & Vesterlund, 2007, 2010; Niederle & Yestrumskas, 2008; Pope & Sydnor, 2010). For example, Booth and Nolen (2012a, 2012b) in a randomized experimental setting show that girls’ attitudes towards risk increases in a single-sex environment, while competitiveness decreases. These hypotheses are consistent with the theory at the base of the economics of identity (Akerlof & Kranton, 2000), which suggests that conformity with the traits that defines one’s identity plays an important role in the utility maximization problem. Making choices in fields that have a higher
11They argue that this intervention has mainly affected girls because Chemistry is a less male-stereotypical subject than physics.
gender-biased connotation, like whether to study STEM subjects when it is well known that this is over-represented by males, can be particularly affected by this behaviour of conformism.
This could explain why the gender gap in STEM subjects, both in terms of choices and performances, is reliant on cultural norms and environment as it has been shown by several studies. Pope and Sydnor (2010) show that the gender gap in several subjects correlates with gender attitudes within states in the US. Consistent results are found across PISA countries where the Maths gender gap is strongly correlated with the gender culture in the country (Guiso, Monte,
Sapienza, & Zingales, 2008). However, Fryer and Levitt (2010) show that in
Muslim countries, little or no gender Maths gap is found, suggesting that there is heterogeneity within cultures with strong gender oriented attitudes.
There is also much evidence on the impact of gender composition within social institutions (such as family) on choices on whether to specialize in STEM subjects,
with females usually being the most affected gender.12 In the context of school,
Favara (2012) shows that single-sex schools in England are associated with less
stereotypical choices in terms of gender compared to mixed-sex schools.13 This
is especially true for girls, and it remains even after controlling for selection into single-sex versus mixed-sex schools. Favara exploits complete gender segregation, while other studies exploit the idiosyncratic gender variation across cohorts. For example, it has been found that in high school a higher exposure to male peers causes boys to choose male-dominated college majors (Anelli & Peri, 2015b) while at university girls exposed to a higher share of girls are less likely to enrol in STEM subjects (Hill, Corbett, & St Rose, 2010; Z¨olitza & Feld, 2016).
Our contribution here is to analyse the interaction of the gender composi-tion of peers at school with an educacomposi-tional reform to provide evidence on how gender stereotypes can have important consequences in the education production
12Anelli and Peri (2015a); Oguzoglu and Ozbeklik (2016).
13The difference between single-sex and mixed-sex schools is also exploited to investigate gender differences in achievement, e.g. Lee, Turner, Woo, and Kim (2014).
function, through the choice of field of study.
1.3
Data and institutional setting
1.3.1
The English educational system
The different levels of the English educational system are called Key Stages. Table 1.1 summarizes the equivalent achievement in terms of school years, the age of the students, the duration of the course, and the qualification acquired in each Key Stage (KS). For example, the fourth row of Table 1.1 shows that when students finish their KS4, which is the end of compulsory schooling, they are 16 years old and the name of the qualification obtained is GCSE, which stands for General Certificate of Secondary Education and it is equivalent to year 11. From now on we will denote the cohorts of students by the year in which they finished their KS4. For example, cohort 2002 stands for the cohort of students who finished KS4 in the academic year of 2001/2. This cohort started KS5 in 2002/3 and finished in 2003/4.
This paper focuses on KS5 because this is where the MCR was implemented.14
A-levels (usually obtained at 18 years old, equivalent to year 13) are usually taken by students who want to go onto Higher Education. In fact, most university departments’ admission policies require students to have achieved certain A-levels, and most departments also require certain grades. However, entry requirements depend on the subject studied and the university applied to. For example, if a student wants to study an undergraduate course in Economics at the University of Exeter s/he needs to have at least a combination of three A-levels with grades A*AA or AAB, including Maths. For the same undergraduate course at Oxford University, the requirements are instead at least two A-levels with grade A and
one A-level with grade A* and one of these A-levels must be in Maths.15 In the
14Note that we focus on the academic route of this level, which leads to the acquisition of A-levels because the MCR affected this route only. There is also a vocational KS5 track.
15Other examples of entry requirements for undergraduate courses in other subjects for the university of Exeter (Oxford): the Faculty of English requires A*AAAB, GCE
A-first year of KS5 (year 12), students take exams in the chosen subjects and can obtain an AS (Advanced Subsidiary) qualification per subject. This could be left as a stand alone qualification or the subject can be studied in year 13 to obtain the full A-level qualification.16
1.3.2
Data and sample selection
We use the National Pupil Database (NPD). This is an administrative educa-tional dataset with information on educaeduca-tional performance and characteristics of pupils in the state sector and non-maintained special schools in England. It has rich information on the socio-economic and demographic characteristics of pupils, such as ethnicity, free school-meal (FSM) eligibility,17 and whether any special ed-ucational needs (SEN) are required. These are collected through the Pupil Level
Annual Schools Census (PLASC).18 Alongside individual socio-economic and
de-mographic characteristics, this dataset provides students’ attainment at different stages of education from KS1 until KS5 (or KS4 if the individual is not observed studying after compulsory education). An identifier for the school attended by students in each stage of education is also provided.
Our sample includes those young people who acquired their KS4 qualification
level English Literature grade A, GCSE English Literature or English Language grade A, and candidates may offer either GCE A-level English Literature or English Language and Literature (A-level in English Literature or in combined English Language and Literature with a standard conditional offer AAA, e.g. at least 3 A-levels with grade A). For an un-dergraduate course in Engineering the requirement instead is AAA-ABB including A-level Maths grade B, another science subject at grade B, and candidates may offer A-levels Fur-ther Maths (A*A*A to include Maths and Physics. The A*s must be in Maths, Physics or Further Maths if taken). Sources: http://www.exeter.ac.uk/undergraduate/degrees and
http://www.ox.ac.uk/admissions/undergraduate/courses-listing
16This was the system operating at the time that we consider in the paper. Since 2015 it has been gradually modified to drop the AS and become a 2-year A-level course.
17This is a commonly used indicator to proxy the socio-economics of pupils. It indicates whether students are eligible for free meals at schools. In order to be eligible, pupils have to come from a household recipient of benefits.
18Some schools (i.e. independent) do not provide information on socio-economic and demo-graphic characteristics of their students. In the whole sample of students who left KS4 in the years 2002-2007 around 7% of pupils attended independent schools. Since we want to include them in the analysis, in the regression we include a missing information dummy that is equal to 1 for all these schools and 0 otherwise. In this manner we can keep the educational informa-tion of the pupils going to independent schools even if they do not provide any informainforma-tion on students’ individual characteristics.
in 2001/2 to 2006/7, as these are the cohorts that we can follow through KS4 to KS5 in the NPD. We separate the students into different cohorts according to the year in which they obtained their KS4. Those students who finished their compulsory education (year 11) in years 2004-7 have been facing the new system introduced by the reform. The MCR was for the first time implemented for year 12 students in 2005 and for year 13 students in 2006. Thus, KS4 cohorts 2002-3 have been studying in the regime pre-MCR, and KS4 cohort 2004-7 in the regime post-MCR. We follow students for two academic years since the year in which they start their KS5 to observe whether they have obtained an AS or A-level qualification (the standard duration to get A-level qualification is of two years). If an exam is re-taken we consider only the first attempt.
We keep only full time students from non-special schools. Our intermediate sample is composed of 1,648,282 young people. Furthermore, since to study Maths
at KS519 it is necessary to have a high grade in Maths at KS4, we restrict the
sample to those students with grade A*, A, and B in KS4 Maths. These consist
of 31% of all pupils who left KS4 in the years 2002-2007.20 Our sample is then
composed of 990,689 pupils.21
Notice that in England some schools offer both KS4 and KS5 in sixth forms, while others, the colleges, offer KS5 qualifications only. If students studied KS4 in a sixth form school they have the option to keep studying their KS5 qualification in the same school, otherwise they have to change school. In the rest of the paper we hence refer to KS4 schools and KS5 schools. For half of the sample the school attended for KS4 qualifications coincides with the school attended for KS5 qualifications. We keep only those KS5 schools that we observe for each cohort of students, achieving a final sample of 969,862 pupils who are observed studying in 14,892 KS5 schools.
19In this paper we focus on a non-advanced course in Maths. However, at KS5 there are other courses on advanced Maths that could be chosen alongside the standard one. Appendix A1 shows all the Maths courses available in our sample and briefly comments on them.
20Students with a grade A*-B in KS4 Maths represent 98% and 96% of overall A-level and AS Maths takers, stable across all cohorts considered.
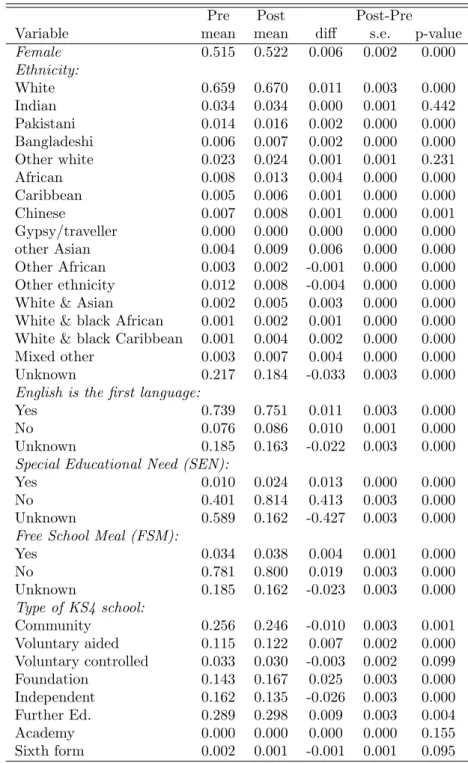
Table 1.2 shows the summary statistics of the main socio-economic and de-mographic variables that we use in our analysis. The first two columns show the mean of the variables for the whole sample divided by the KS4 cohorts who have not been affected by the MCR (2002-3), “pre”, and those who have been affected (2004-7), “post”. We then report the difference of the means of the two sub-samples, followed by standard errors, and p-value of the t-test when imple-menting clustering at KS5 school level. We can see that most of the differences between the two periods of time, pre- and post-MCR, are statistically significant, although their magnitude is very small - most of the differences are <0.010. The most important differences arise because of the improvement of the quality of the data collection and the consequent decrease in missing values - the first year that we have in our sample coincides with the first year of data collection of the NPD. For example, the missing values of variables such as ethnicity, SEN status, and FSM eligibility decrease over time.
1.3.3
The Maths Curriculum Reform
To understand why the MCR was introduced and to predict its possible impli-cations, it is important to know the historical context and the determinants of
its implementation.22 Until the KS5 examination year 2000/1, all courses were
linear. Students decided what they wanted to study in the first year of post-compulsory schooling and took exams in these (usually 3) subjects at the end of
22Notice that this reform has been one of several measures implemented by governments in the last years to increase the quality and the quantity of STEM students and teachers in England. In 2005 the Higher Education Funding Council for England (HEFCE) has invested around 50 million pounds to support programmes to increase the number of students in STEM subjects. In the same year, the Further Maths Support Programme (FMSP) started a pilot in some areas in England to promote and support post-16 Maths. After more than ten years the FMSP is still running successfully. In 2011, a generous bursaries scheme to bring graduates in STEM subjects to teach in schools has been implemented. Furthermore, in the last decades there have been several curricular and systemic reforms at secondary level. A Triple Science option was introduced in 2008 at secondary school - De Philippis (2016) evaluates this intervention and finds that the offer of more intensive scientific courses has positively affected the scientific orientation and preparation of students in STEM subjects up to university level. All these initiatives, however, do not overlap in terms of time with the cohorts that we consider in this paper because they mainly affect more recent cohorts of pupils. In Section 1.5.2 we will expand on the possible threats to our empirical strategy.
the second year. This system generated a concern that, especially in certain sub-jects, a high number of students failed the exams in their second year. There was also demand for widening the KS5 curricula, which was considered very narrow, especially compared with other European countries.
These were the main reasons for the introduction of an earlier reform,
Cur-riculum 2000. This reform introduced amodular system at KS5 (AS and A-level).
With the modular system students decide what they want to study in the first
year (usually 4 subjects) and at the end of this year they have exams that give AS qualifications (a stand-alone qualification). This qualification was not meant to be considered by universities for entry requirements, and usually it is not, but it might be considered by prospective employers. After the first year pupils can drop the subject in which they fared worse or did not like, and keep the others23 in the second year, for which, after the final exam, they would get A-level qualifications.
Even though the Maths curriculum was unchanged by thismodular system, a few
years after its implementation, the uptake of A-level Maths had dropped by 20% (Kidwell, 2014). In this year the number of A-level Maths entries was little more than half the number it had been 25 years previously (MEI, 2005). This
hap-pened because the changes in the way this subject was taught (i.e. from linear to
modular) and examined (i.e. one exam at the end of each year instead of a unique exam at the end of the second year) made the study of this subject particularly difficult. Students could not cope with the amount of the material to study within the new timetable (A. Smith, 2004).
The Curriculum 2000 reform changed the composition of students studying
Maths at A-levels: after the modular system was introduced those doing Maths
were generally more able students. Figures 1.1.a-1.1.d show the changes that
oc-curred in KS5 qualification uptake and attainment by KS5 year of examination.24
23Usually universities require three A-levels.
24This time series on AS and A-level entries for each academic year is provided by the Department for Education. This is not the data that we will use in the analysis of this paper (since it does not contain any further information than what is displayed in the graphs) but it is useful for looking at the trends given the large number of years available. A description of this dataset and its comparison with the dataset that we use in our analysis (National Pupil
The three vertical lines denote the first KS5 cohort of students affected by
Cur-riculum 2000 (long-dash line), by the MCR (solid line), and by other changes25
(short-dash line). After the implementation of Curriculum 2000, the uptake in A-level Maths fell (Figure 1.1.a) while passes and grades increased (Figure 1.1.c). AS and A-level, if not failed, are graded from A (A* was introduced for A-level in 2010), the highest mark, to E, the lowest mark.
The decline in post-16 Maths study was so important that an enquiry was launched (A. Smith, 2004). This enquiry even envisaged the possibility of intro-ducing financial incentives to bring more students to study Maths after compul-sory school if the situation did not improved. The fall in the number of entries in Maths at secondary school negatively affected the enrolment in STEM sub-jects at university and some STEM departments had to be incorporated in others
or shut down (MEI, 2005).26 Higher Education representatives, employers, and
other parts of the society asked for another change in the system only four years after the reform (year of KS5 exams 2001/2-2004/5). This is when the MCR was introduced.
The main aim of the MCR was to adjust what was considered as a disastrous outcome of Curriculum 2000 for the provision of Maths at KS5. The MCR ex-clusively changed the curriculum of Maths. Changes in the AS Maths curriculum were introduced in the academic year 2004/5 and changes in the A-level Maths curriculum in the academic year 2005/6 so that the first cohort of students affected was the one that obtained secondary education qualifications in 2004. The main change was a reduction in the Maths curriculum which was achieved by drop-ping one module of Applied Maths. A more detailed explanation of the reform is available in the Appendix in Section A4.
Database) is available in the Appendix A3.
25The changes that affected firstly the cohort obtaining their A-levels in 2010 are the following: introduction of A* and reduction of modules to study from 6 to 4 for all subjects except than for Maths and natural sciences at KS5; introduction of 2-tier GCSEs at KS4.
26Here note that universities and UCAS (the central organisation through which applications are processed for entry to Higher Education) did not change their entry requirement when the reform was introduced.
After the introduction of these changes the uptake of A-level Maths gradually increased, and nowadays A-level Maths is the most taken subject. While the trend in uptake during the period before the MCR is stable (apart from the sudden drop due to the Curriculum 2000 reform), it monotonically increases after the introduction of the MCR for both AS and A-levels (Figures 1.1.a and 1.1.b). More specifically, since the year of the introduction of Curriculum 2000 there was a decreasing trend in AS uptake which reversed after the introduction of the MCR.
Grades and pass rates, especially for AS Maths, have changed as well.27 Passes
slightly increased for both AS and A-level for the cohorts affected by the MCR. Average grade also increases, mainly driven by a decrease in B grades (Figure 1.1.c) and a decrease in C/E grades (Figure 1.1.d). In our data we observe two cohorts pre-MCR and four cohorts post-MCR and these coincide with the KS5 exam year 2003/4 and 2005/9 in Figures 1.1.a-1.1.d. From the KS4 cohort 2008, while the MCR remained unaltered, other changes both at KS4 and at KS5 were implemented. The changes in the trends after 2008 are to be attributed to these. Figure 1.2.a shows the average percentage of AS and A-level uptake by KS4 cohort in the National Pupil Database in our analysis population (described in the previous subsection). The first two cohorts (2002 and 2003) are the pre-reform cohorts and the others (2004-2007) are the post-reform cohorts. The uptake of AS Maths has gradually increased over these cohorts from 38% in 2002 to 40% in 2007, while the uptake in A-level Maths has increased by two percentage points (from 25% to 27%). Notice that, as shown in Figure 1.1.a, there is a downward trend for AS uptake in the pre-MCR period resulting in a drop from 2002 to 2003. If we consider the sub-population of students who took AS Maths, the percentage of students getting A-level Maths did not change much, i.e. the line A-level|AS Maths. Figures 1.2.b and 1.2.c show that after the implementation of the MCR, there is an increase in A grades and a decrease in B grades for A-level Maths. For AS Maths, the proportion of A grades increased, of C/E decreased, and the
27However, it is difficult to get a comparison in terms of the Maths ability of students with the previous systems because of the curricular changes.
percentage who failed fell for AS Maths.
From the mentioned figures it appears that the MCR has increased both the uptake and attainment of AS and A-level Maths. However, these are only raw data. In order to establish whether the MCR has had any effect at all, we need to condition on the composition of the cohorts.
1.4
Empirical framework
Our main outcomes, y, are: whether Maths has been chosen to be studied (0/1),
whether a pass grade has been achieved (0/1), and the grade. We denote the choice of studying Maths “uptake”. At year 13 we have two different uptake outcomes. One is on the overall population and the other is on the population of students who studied AS only, i.e. A-level|AS uptake. While the former shows the total effect of the reform across the two years of schooling, the latter provides information on whether the students change their likelihood of continuing to study Maths from year 12 to year 13. Grades range from A to E. We attribute to each of them a numerical value, five to A, four to B, and so on until one to E. Then, we normalize them to have the mean equal to zero and the standard deviation equal to one within each cohort to address the possible issue of grade inflation over time.
We have a before/after design where we compare two cohorts of students who have not been affected by the MCR (those who completed KS4 by 2003) to four cohorts of students who have been affected (those who finished compulsory
school-ing from 2004 onwards). The effect of the MCR is captured by the dummyP ost:
P ost= 0 for individuals in the pre-MCR cohorts (KS4 years 2002-3) andP ost= 1 for individuals in the post-MCR cohorts (KS4 years 2004-7).
Our main aim is to identify the true effect of the MCR and disentangle it
from other time trends. For example, practitioners and students could have taken some time to adapt to the new system. To show how we do this we implement several specifications as shown in the equations below. In each equation subscript
i stands for individual and s for school. y denotes one of the outcomes listed above. The individual and school characteristics, which we describe at the end of this subsection, are represented by the matrixX. Equation 1.1 is the most flexible one because it allows the effect of the reform to differ by each post-MCR cohort. Equation 1.2 instead captures in the coefficientβ the average effect of the reform.
Equation 1.3 adds a linear control for time T rend, and Equation 1.4 allows the
trend pre-MCR to differ from the trend post-MCR through the interaction of the
P ost dummy with the linear time trend.
1. Cohort dummies: yis =α+ 2007 X k=2004 βkCohorti+Xis0 δ+φs+µis; (1.1) 2. Post dummy: yis =α+βP osti+Xis0 δ+φs+µis; (1.2)
3. Post dummy with linear time trend:
yis =α+βP osti+γT rendi+Xis0 δ+φs+µis; (1.3)
4. Post dummy interacted with linear time trend:
yis =α+βP osti+γT rendi+ζP osti∗T rendi+Xis0 δ+φs+µis. (1.4)
We cluster the standard error by KS4 school because all characteristics in Xis
are collected by KS4 schools. In order to account for KS5 school-specific and time invariant characteristics, we include KS5 school fixed effects (φs).
In the results section we will discuss the estimates of all specifications. For this specification we also show the Average Marginal Effect (AME from now on) of the reform. This considers the effect of the MCR on both the level and trend of the outcome of interest at one point in time. More specifically, the AME is calculated
as (ˆζ∗T rend) + ˆγ. T rend is equal to 3.5, i.e. the average value of T rend which takes the values from 1 to 6 where 1 identifies cohort 2002 and 6 identifies cohort 2007. Thus, the AME gives us the predicted mean of the outcome of interest at approximately one year and a half after the introduction of the MCR by taking into account the changes in both the level and in the trend.
In all these specifications we treat the first two cohorts (2002-3) as the control group. However, this is not a proper counterfactual group, i.e. a group showing what would have happened if there was no MCR. This is because the pre-MCR cohorts could have been affected by different factors alongside the MCR compared to the post-MCR cohorts just because they studied in different years. The main assumption underlying our before/after strategy is that the MCR was the only phenomenon that affected uptake and attainment of Maths over the time period considered. Among all specifications, 4 is our favourite because it partly reduces this drawback of the empirical framework by including a time trend which should capture what would have otherwise happened if the MCR was not implemented. In section 1.5.2 we discuss the limitations of our empirical strategy and implement some robustness checks to show evidence for the plausibility of the assumption that the changes in uptake and attainment of Maths is attributable to the MCR only.
The school and individual characteristics we condition on are: gender, eth-nicity, month of birth, free-school meal eligibility (FSM), indicator of the depri-vation of the area where student is from (Income Depridepri-vation Affecting Children Index, IDACI, rank divided into 50 quantiles), whether the child has been classi-fied as having Special Educational Need (SEN), and the type of KS4 school (e.g. Academy, Community, Independent) attended.
We also condition on KS4 attainment as a proxy for general academic ability. A reasonable way of dividing students in ability groups is to use the total score that they obtained in the previous stage of education (KS4). This is plausibly exogenous because the MCR was introduced suddenly and we do not see how
students or teachers could have anticipated it and adjusted to it accordingly, for example by changing the effort taken in studying/teaching certain subjects at KS4. This ability measure is capped which means that it is based on the sum of the grades achieved in the best eight GCSEs (or fewer if the individual has
less that eight GCSEs).28 We divide the pupils in five ability-groups (quintiles)
by each KS4 year. This measure of ability is rather general because it is based on a general score grouping different subjects. However, students at KS4 already choose, under the advice of schools, the number and subjects that they study (the only compulsory subjects are Maths, English, and Science, either single, double, or triple). We assume that students prefer, and hence choose the optional subjects in order to maximize their grades. Thus, this score, even if it allows for some specialization, should reflect their ability.
1.5
Results
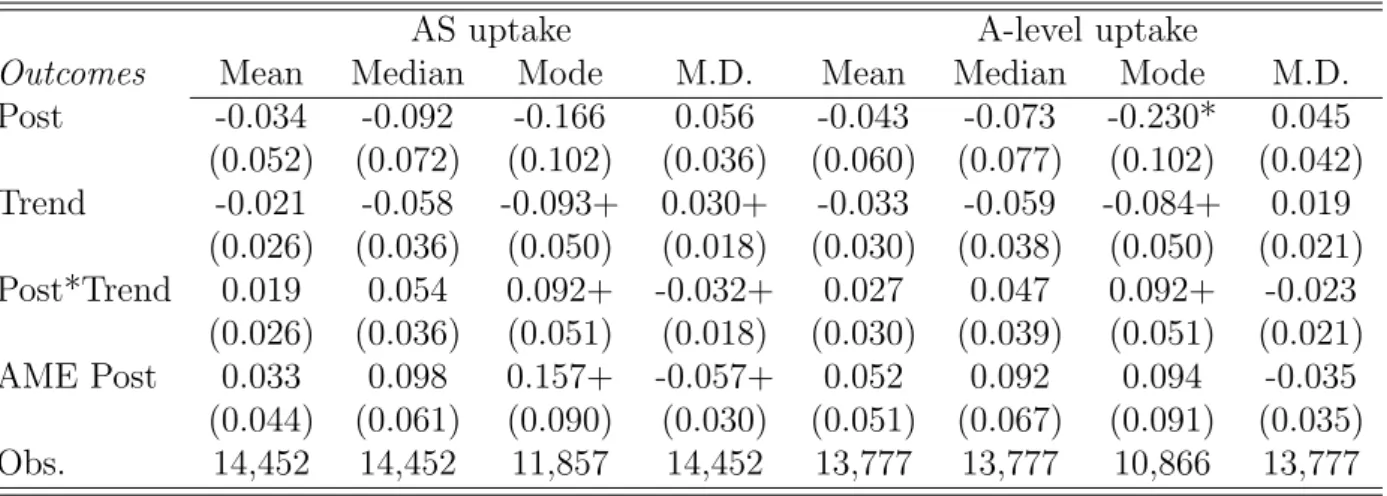
We first investigate how the uptake and attainment in Maths has been affected by the MCR. We implement the four different specifications described in section 1.4. Results are shown in Table 1.3. For each of them we first include as covariate(s) the variable(s) capturing the effect of the MCR only (column 1); a specification follows with the inclusion of the covariates on the characteristics of students and KS4 schools (column 2); we then add fixed effects by KS5 school to control for all unobserved differences fixed in time within each school (column 3). In the final specification, we cluster the standard errors by KS4 school given the potential error correlation across individuals within schools (column 4).
For brevity, we discuss the different results of the specifications with respect to one outcome only, AS Maths uptake, as shown in Table 1.3. Specification I shows the effect of the reform on each post-MCR cohort. Overall, the uptake of AS Maths increases over time and the impact of the MCR is highly statistically significant.
28The average number of GCSEs taken by individuals is 9 in each cohort. Note that this capped score is used as measure of ability in other papers, such as Nicoletti and Rabe (2016).
In column 2 we condition on the characteristics discussed in Section 1.4 and the effect of the MCR increases with respect to column 1. It slightly decreases when conditioning on unobserved time-invariant characteristics at school level (column 3). These changes suggest that there is heterogeneity across schools. Allowing for the error term to be correlated within KS4 school does not importantly affect the standard errors (column 4).
The same patterns are found for Specification II, where the effect of the MCR
is now captured by the coefficient on a dummy variable, P ost, which identifies
whether the cohort has been affected by it. In Specification III, where alongside theP ostdummy we include a general linear time trend, we find instead a negative average effect of the MCR on uptake. This is attenuated, and becomes no longer statistically significant, once we include the covariates and the school fixed effects. This result could be explained by the fact that the inclusion of the linear time trend absorbs the positive effect of the MCR. This is consistent with the results of Specification IV where the coefficient of the time trend is negative, indicating a downward slope in uptake before the MCR, while the coefficient of the interaction
term (P ost ∗T rend) is actually positive indicating a positive trend after the
introduction of the MCR. The P ost coefficient shows that the average level of
uptake was lower in the pre-MCR period compared to the post-MCR period. The last row of Specification IV shows the average marginal effect (AME) of the MCR in column 4. This is calculated at one point in time, which is at one year and half after the introduction of the MCR. The AME shows that the average uptake of Maths increased by 2.5 percentage points, which is statistically significant at the 1% level. This is the same as the coefficient on P ost in Specification II and it is the average of the non-linear effects across cohorts found in Specification I. We hence choose the fourth Specification as seen in column 4 as our preferred one, and we will use it in the rest of the analysis.
Table 1.4 reports the coefficients of interest and the AMEs for each of the outcomes of interest. The slope coefficient on AS uptake for the post-MCR cohorts
is positive and statistically significant at the 5% level. By considering both the change in the intercept as well as in the slope, the increase in the share of pupils who study Maths just after the implementation of the MCR is equivalent to a 7% change with respect to the average AS uptake rate. There is an increase in students failing AS Maths and the average AS grades falls - see column 2 and 3, respectively. As a result, when we restrict the sample to those students who studied AS Maths, we find that the cohorts affected by the MCR are less likely to continue studying Maths in the second year (a reduction of 6%). The positive impact of the MCR on Maths uptake in the first year of school fades out after the first year of schooling. We do not find any statistically significant effect on the uptake of A-level Maths (column 7) because not all students continued studying Maths in the second year (column 4). Finally, we do not find any statistically significant effect on A-level attainment.
Some of these results, mainly the negative impact of the MCR on AS attain-ment and the null effect on A-level uptake, differ from what we would expect by looking at the raw data discussed in section 1.3.3. This is because in the regression analysis we condition on several characteristics of pupils and schools which allows us to control for changes in the composition of students across cohorts.
Unlike most educational interventions, the MCR was not targeted at a particu-lar ability group of students. Furthermore, our empirical strategy is an intention-to-treat strategy and is informative about the average effects of the MCR. In the next subsection we investigate whether the MCR has had heterogeneous ef-fects across the students’ ability distribution and schools. We accomplish this by implementing several interactions of the main variables with student and school characteristics, as described below.
1.5.1
Who responded to the MCR?
a. Heterogeneity in academic ability
on uptake and attainment across the ability distribution. Any changes in patterns of uptake of Maths could lead to changes in average class size or in the ability composition of classes. These in turn could affect attainment.
We look at the change in the ability composition within Maths classrooms
in two ways. First, we use pupil level data and we implement our preferred
specification (specification 4 in section 1.4) with an interaction of quintile of the KS4 academic ability score with the variables capturing the impact of the MCR, i.e. P ost ∗Ability, T rend∗Ability, and P ost ∗T rend ∗Ability. Second, we investigate how the MCR separately affected school-level mean, median, mode, and absolute deviation from the mean ability.
Figures 1.3.a-1.3.g shows the AME of Post across the different ability quintiles. The first three figures (1.3.a, 1.3.b, and 1.3.c) show that the MCR has had a positive impact on AS uptake for the individuals with the highest academic ability (quintiles four and five) by 6 and 7 percentage points, respectively. However, those pupils in the lowest three quintiles have seen a decrease in their passes and grades. As a result, these groups of students are less likely to keep studying Maths in the second year of schooling, as shown in Figure 1.3.d. We do not find any statistically significant effects across ability groups for A-level passes (Figure 1.3.e). However, those students in the second and third quintiles see a decrease in the average Maths grades because of the MCR (Figure 1.3.f). The average impact of the MCR on uptake of A-level Maths for the whole population of students has been negative for the two lowest ability quintiles, and positive for the two highest ability quintiles (Figure 1.3.g). These results suggest that the composition of AS level classes has changed such that we have a higher average ability, and even more so at A-level, as those at the bottom of the ability distribution are now less likely to proceed with A-level.
Next, we estimate the impact of the MCR on measures of ability composition within KS5 school/KS4 cohort cells. Results are shown in Table 1.5. The mean, median, and mode of the ability distribution rise while the absolute deviation
from the mean falls. This is true for both years of schooling, and it means that there has been a rise in the average ability of students in Maths classes which has made classes more homogeneous. However, these estimates are not statistically significant at the conventional levels.
We conclude that the MCR has affected the ability composition in Maths classrooms by increasing the share of high ability students. However, those with low general academic ability have experienced a fall in attainment. This could have been driven by the increase in the number of classmates or the increase in the share of students with higher general academic ability, although we do not separate these two effects.
b. School heterogeneity
Because the intervention affected all schools in England, we can examine which sorts of schools have been affected most by the MCR. Because of sorting, students within the same school share similar observable and, presumably, unobservable characteristics. Additionally, through social interaction in the school, peer effects arise. These are usually further magnified by social multiplier effects (Glaeser, Sacerdote, & Scheinkman, 2003). We hence expect that the impact of the MCR varies across the different types of schools. We investigate this by interacting the characteristics of interest with the variables capturing the policy change. We focus on: the funding status of the school, its “propensity” towards Maths, and whether it is a single-sex or mixed-sex school. Given that here we are interested in the heterogeneous response of individuals across different types of schools, alongside the school and individual characteristics described in Section 1.4, we also condition on several characteristics at the KS5 school and KS4 cohort level: whether the school is single-sex or mixed sex, its size, the share of students who are FSM eligible and have SEN, the share of students in each of the seventeen ethnicity groups, and the share of students within each national ability quintile.
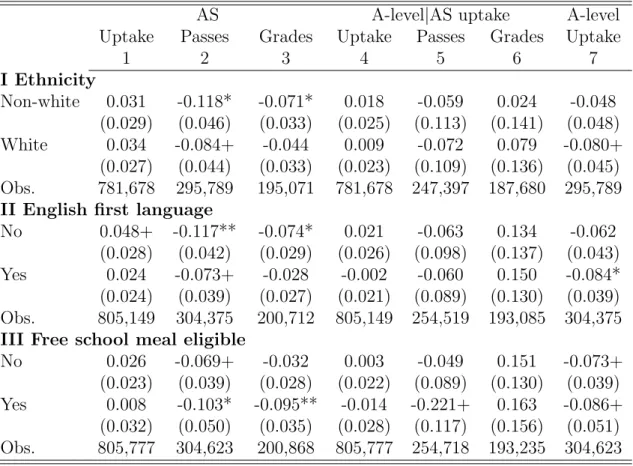
Across all schools, independent or private schools are the only ones charging fees and, because of this, their intake is mainly composed of pupils coming from
wealthy households. In these schools, 27% of students in the pre-MCR sample obtained A-level in Maths, versus 22% of students in government funded schools. The average ability of students in these schools in our sample of students with grade A*-B KS4 Maths is 3.4 (on a scale from one to five, i.e. the ability quin-tiles), while for non-private schools this is 2.6. We condition on this characteristic. However,ceteris paribus, we still expect that students in non-private schools might have replied differently to the changes in the Maths curriculum compared to stu-dents in private schools, because pupils in these schools are subjected to a different investment by their families and school.
Panel I in Table 1.6 shows that, on average, there have not been any statisti-cally significant different responses of AS uptake between private and non-private schools. However, in private schools there has been an increase of four percentage points in A-level Maths uptake after the implementation of the MCR. This is mainly driven by the increase in the percentage of AS passes or the increase in students who kept studying Maths after the first year of schooling.
Next, we divide schools into five quintiles depending on the share of students studying A-level Maths in the pre-MCR period. The first quintile has a share of students ranging [0,0.14], the second (0.14,0.20], the third (0.20,0.25], the fourth (0.25,0.32], and the fifth (0.32,0.89]. We call this measure the “Maths propensity” of the school and it indicates how specialized the school is in teaching Maths.
Panel II of Table 1.6 shows that the higher the “Maths propensity” the greater the attainment in Maths after the MCR, both in year 12 and 13 - suggesting that the overall negative effect of the MCR on attainment is driven by those schools who are not specialized in teaching Maths. For the schools with the highest “Maths propensity” this results in an increase in A-level uptake driven by an increase of students continuing study Maths in the second year. These results could be explained by the fact that schools where the demand for Maths was traditionally relatively high have better resources (in term of teaching experience) to deal with the changes brought about by the MCR.
Finally, we consider differences in the outcomes by the share of female students within KS5 school and KS4 cohort, and between schools that are single-sex versus mixed-sex schools.29 This analysis will give us insight into gender differences that will explored in more detail later.
Panel III of Table 1.6 shows that the share of female students within KS5 school has no statistical significant interaction with the MCR effect for any of the outcomes considered. Panel IV shows that single-sex schools responded more positively to the MCR both in terms of uptake and passes of AS and A-level Maths than mixed-sex schools. Finally, Panel V shows that the results for uptake are not driven by boys-only or girls-only schools, and that those for attainment are mainly driven by the difference in response of boys in single-sex and mixed-sex schools, i.e. after the MCR boys in single-sex schools fare better in AS passes and grades than boys in mixed-sex schools.
Given that our empirical specification conditions on school’s fixed and changing-over-time characteristics of its student intake, these differences in the response to the MCR can be attributed to variation in schools’ resources and organiza-tion. Students in private schools, in schools with a high “Maths propensity”, and single-sex schools are those who benefited the most from the MCR both in terms of uptake and attainment.
1.5.2
Threat to identification
Since we are evaluating the impact of a policy reform, the first threat we can think of is whether the reform had already been anticipated. If this were the case, teachers or students could have changed their effort put into teaching or studying Maths in the previous educational stage (KS4) to increase the students’ chances of being able to study A-level Maths at KS5. This hypothesis is ruled out by the late announcement of the policy, which occurred around one academic year before
29Notice that in our sample 43% of boys-only schools are private and 50% of girls-only schools are private, so that gender segregation importantly overlaps with the private status of KS5 schools.
its implementation (Porkess, 2003). Furthermore, all high-stake exams in England are externally marked and so it is not possible for the teacher to systematically affect the grades of their students (classwork accounts in a negligible way towards the final marks of both KS4 and KS5 qualifications).
Another concern is that KS5 schools might have responded to the MCR (and the consequential higher demand for Maths) by changing the number of classes and ability sorting within them, or by increasing the number of Maths teach-ers. Unfortunately, we do not have any information on these potential responses. However, given the scarcity in the supply of Maths teachers in secondary and post-secondary schools, the fact that the MCR was implemented suddenly, and that we observe the cohorts immediately affected by it, we doubt that schools managed to respond so quickly to the changes produced by the MCR. It is more plausible therefore that the changes in the attainment are driven by the change in exposure to Maths classmates of different ability.
Another threat to our strategy is that we might capture the effect of the MCR in a manner that confounds it with the effect of other phenomena. The interaction
between P ost and T ime should help in cancelling out any other confounding
trends affecting our outcomes of interest. One important change that took place across the period that we consider is the gradual increase in the provision of Triple Science at KS4, which has been shown to have increased the uptake in
STEM subjects at subsequent levels of education (De Philippis, 2016).30 In our
sample, we see that the percentage of students who went to a KS4 school that offered the Triple Science option has increased from 18% within the 2002 KS4 cohort to 20% within the 2007 KS4 cohort. More specifically, there is a difference of 45 KS4 schools that offered this option between KS4 cohort 2002 and 2007 in our sample. As a robustness check, we re-run the main model to investigate the average effect of the MCR by including an additional variable: whether the
30However, the increase in the period that we consider is small, especially if compared to the increase in the provision of Triple Science that has taken place since KS4 cohort 2008. Figure 1 in De Philippis (2016) offers a time-line of the average offer of Triple Science from KS4 cohort 2002 to 2013.
KS4 school attended by students offered Triple Science. Panel A of Table A4 in the Appendix shows the coefficients of interest. It is evident that including the provision of Triple Science by school and cohort does not affect our results, suggesting that the effect that we attribute to the MCR is not confounded with possible changes deriving from the policy of increasing the offer of Science at KS4.
1.6
Has the MCR affected boys and girls
differ-ently?
We now investigate whether girls and boys have been affected differently by the MCR. We implement a strategy similar to what we have just undertake to capture the heterogeneity across student ability and school characteristics; that is, we
interact the variables that capture the effect of the MCR with the dummyF emale.
Panel A of Table 1.7 shows the difference in the trend of uptake between girls and
boys after the MCR (given by the coefficient on the interaction of P ost, T rend,
and F emale), the coefficients on ability quintiles, and the AME of P ostfor boys and girls, separately. Girls, on average, are more likely to respond positively to the MCR in terms of uptake. The coefficient of the interaction term suggests that girls in the cohorts that have been affected by the MCR have seen an average increase in the uptake of Maths by 1 percentage point more than boys, both for AS and A-level. The MCR increased AS grades and pass rates for girls more than for boys. The AME for girls shows a statistically significant increase of 3.3 and 1.5 percentage points in AS and A-level uptake. For boys, we see an increase of 1.5 percentage points for AS only, which is only marginally statistically significant. Furthermore, the changes in AS and A-level passes after the MCR is mainly driven by a fall in the attainment of boys. This suggests that the change in the composition of the classroom might have had a detrimental effect on boys’ performances. Overall, the MCR has benefited the female population in terms of studying Maths. One year after the implementation of the MCR, girls’ uptake of
A-level Maths increased by 8%.
1.6.1
Gender and Maths ability
Why are girls the marginal students, i.e. those who are mainly affected the MCR? In order to reply to this question we need to further explore the definition of abil-ity. In the Appendix A5 we set out a simple theoretical model that explains the importance of perceived ability for subject choice. Girls, on average, are higher academic achievers than boys, especially at this stage of education. Figure A2.a in the Appendix shows that the share of girls within ability quintiles increases with abili