New Jersey Institute of Technology
Digital Commons @ NJIT
Theses Theses and Dissertations
Fall 2013
Comparison of different differential expression
analysis tools for rna-seq data
Junfei Zhu
New Jersey Institute of Technology
Follow this and additional works at:https://digitalcommons.njit.edu/theses
Part of theBioinformatics Commons, and theComputer Sciences Commons
This Thesis is brought to you for free and open access by the Theses and Dissertations at Digital Commons @ NJIT. It has been accepted for inclusion
in Theses by an authorized administrator of Digital Commons @ NJIT. For more information, please [email protected].
Recommended Citation
Zhu, Junfei, "Comparison of different differential expression analysis tools for rna-seq data" (2013).Theses. 194.
Copyright Warning & Restrictions
The copyright law of the United States (Title 17, United
States Code) governs the making of photocopies or other
reproductions of copyrighted material.
Under certain conditions specified in the law, libraries and
archives are authorized to furnish a photocopy or other
reproduction. One of these specified conditions is that the
photocopy or reproduction is not to be “used for any
purpose other than private study, scholarship, or research.”
If a, user makes a request for, or later uses, a photocopy or
reproduction for purposes in excess of “fair use” that user
may be liable for copyright infringement,
This institution reserves the right to refuse to accept a
copying order if, in its judgment, fulfillment of the order
would involve violation of copyright law.
Please Note: The author retains the copyright while the
New Jersey Institute of Technology reserves the right to
distribute this thesis or dissertation
Printing note: If you do not wish to print this page, then select
“Pages from: first page # to: last page #” on the print dialog screen
The Van Houten library has removed some of the
personal information and all signatures from the
approval page and biographical sketches of theses
and dissertations in order to protect the identity of
NJIT graduates and faculty.
ABSTRACT
COMPARISON OF DIFFERENT DIFFERENTIAL EXPRESSION ANALYSIS TOOLS FOR RNA-SEQ DATA
by Junfei Zhu
In molecular biology research, RNA-seq is a relatively new method for transcriptome profiling. It utilizes the next generation sequencing technology to provide huge amount information about the variety and abundance of RNA present in an organism of interest at a specific state and a given time. One of the most important tasks of RNA-seq analysis is finding genes that are expressed differently in different subject groups. A lot of differential expression analysis tools for RNA-seq have been developed, but there is no golden standard in this field. In this research, four commonly used tools (DESeq, edgeR, limma, and cuffdiff) are studied by comparing their performances in the normalization of different subject group data, and also in the sensitivity and specificity of selection of genes with differential expression. In addition, their performances on genes which only express in one condition are compared. The data used are SEQC and melanoma. The result shows that in differential expression analysis, DESeq is slightly better than other tools in normalization, while DESeq, edgeR, and limma, in general, display good sensitivity and specificity, and limma outputs less false positive predictions. In cases where genes of interest are absent in one of the conditions, limma has the best performance.
COMPARISON OF DIFFERENT DIFFERENTIAL EXPRESSION ANALYSIS TOOLS FOR RNA-SEQ DATA
by Junfei Zhu
A Thesis
Submitted to the Faculty of New Jersey Institute of Technology
in Partial Fulfillment of the Requirements for the Degree of Master of Science in Bioinformatics
Department of Computer Science
APPROVAL PAGE
COMPARISON OF DIFFERENT DIFFERENTIAL EXPRESSION ANALYSIS TOOLS FOR RNA-SEQ DATA
Junfei Zhu
Dr. Zhi Wei, Thesis Advisor Date
Associate Professor of Computer Science, NJIT
Dr. Usman Roshan, Committee Member Date
Associate Professor of Computer Science, NJIT
Dr. Dimitri Theodoratos, Committee Member Date
BIOGRAPHICAL SKETCH
Author: Junfei Zhu
Degree: Master of Science
Date: January 2014
Undergraduate and Graduate Education:
• Master of Science in Bioinformatics,
New Jersey Institute of Technology, Newark, NJ, 2014 • Bachelor of Science in Biotechnology,
Nanjing Forestry University, Nanjing, P. R. China, 2008
Major: Bioinformatics
v
ACKNOWLEDGMENT
I would like to express my sincere gratitude to the thesis advisor, Dr. Zhi Wei, for his long term support of my study and research, not only in the thesis, but also in my whole one and a half year’s learning in NJIT. I also would like to thank the committee member, Dr. Usman Roshan and Dr. Dimitri Theodoratos, for their excellent teaching and guidance. In addition, I would like to thank my fellow students, Wei Wang and Xiao Ling, for their help and encouragement.
Finally, I want to thank my parents, Peijun Zhu and Shuhong Chen and my wife Ruoqing, for their supporting me all through my studies in NJIT.
vi
TABLE OF CONTENTS
Chapter Page
1 INTRODUCTION …...……...…………..………. 1
1.1 Objective and Methods ……...………….………... 1
1.2 Background Information ……….……….…... 2
2 DATASET ………..……… 4
2.1 SEQC ……….……….. 4
2.2 ERCC RNA Spike-In Mix and qRT-PCR ……….………….….……… 4
2.3 Melanoma Dataset ……….………….….……… 5
3 ALIGNMENT AND GENE COUNTS ……….……… 6
3.1 Sequence Alignment ……...…...………...……….. 6
3.2 Gene Counts …...…….…………...……….……… 7
4 RESULTS ...………... 9
4.1 Normalization………..……… 9
4.2 Differential Expression Analysis ………..…….…………. 11
4.3 Test of Type-I Error ………...………. 15
4.4 Performance When Genes Expressed in Only One Condition ...…....……...….. 15
5 DISCUSSION ……….……..……….………….... 17
APPENDIX A DISTRIBUTION OF RAW AND NORMALIZED COUNTS OF SEQC DATASET ...………...………. 18
APPENDIX B DISTRIBUTION OF RAW AND NORMALIZED COUNTS OF MELANOMA ...………...………..………. 20
vii
TABLE OF CONTENTS (Continued)
Chapter Page
APPENDIX C CLUSTERING OF SEQC ………...……….. 24
APPENDIX D CLUSTERING OF MELANOMA ………...……….... 25
APPENDIX E DUNN CLUSTER VALIDITY INDICES ………..………….. 29
APPENDIX F RMSD CORRELATION WITH TAQMAN FOLD CHANGES…….. 30
APPENDIX G OVERLAPPING CORRELATION OF DIFFERENTIAL
EXPRESSION ANALYSIS TOOLS ...………...…………. 31
APPENDIX H DISTRIBUTION OF P VALUES ……….………..………….. 32
APPENDIX I CORRELATION BETWEEN SIGNAL TO NOISE RATIO AND
P VALUES ……….………...………...…………. 34
APPENDIX J ROC CURVE WHEN SIGNAL TO NOISE RATIO 3 IS SET
AS CUTOFF ………..…………...………...…………. 39
viii
LIST OF TABLES
Table Page
2.1 Description of the Melanoma Dataset ……..……….……...…. 5
3.1 Summary of the Alignment of SEQC Dataset ………...……….……...…. 6
3.2 Summary of the Alignment of Melanoma Dataset ………...…..……...…. 7
4.1 Numbers of Detected Differential Expressed Genes by Tools in SEQC ……..…. 11
4.2 Sensitivity and Specificity of Differential Expression Detection ………..…...…. 12
ix
LIST OF FIGURES
Figure Page
3.1 Illustration of the effect of the models in HTSeq-count………... 8
4.1 Hierarchical clustering based on the raw counts ………...…………... 10
4.2 Overlapping correlation of differential expressed genes by four tools .………... 12
4.3 ROC analysis of differential expression detection in ERCC control.…………... 13
1 CHAPTER 1 INTRODUCTION
1.1Objective and Methods
The objective of this study is to compare the performance of some of the most commonly used differential expression tools on RNA-seq data. These tools include DESeq1, edgeR2, limma3 and cuffdiff4. Several features such as the normalization, sensitivity and specificity of differential expression analysis, false positive rate, and performance when genes only express on one condition are taken into consideration.
For the normalization comparison, a clustering was carried out based on the samples, and the distribution of the normalized counts was generated by boxplot. Normalization is a process to remove variances in data caused by differences in read coverage or other experimental procedure rather than by real biological differences. If the replicates of normalized data can cluster in the same condition group as the original data, it will be considered that the normalization procedure is acceptable. Also the differences of medians of samples should be reduced by normalization.
For the sensitivity and specificity comparison, SEQC data was used in the study. Since a set of synthetic RNAs from the External RNA Control Consortium (ERCC) at known concentrations is mixed, the accuracy can be tested in different tools. Furthermore, there are around 1000 genes’ expression have been test by qT-PCR, a more comprehensive comparison can be conducted.
To test the false positive rate of different tools, samples from the same condition were compared to detect the differential expressed genes. As expected, the distribution of p-value should be uniform6.
2
To test the performance of differential expression analysis tools when only one condition has expressed, such subset of genes were selected, and the ratios of signal to noise were computed6. A better model should assign more significant p-values to these genes which have higher ratio of signal to noise.
1.2Background Information
Instead of microarray, RNA-seq has been used as a powerful tool in transcriptome profiling. One of the key tasks of transcriptome profiling is to quantify the expression levels of each transcript in different conditions, such as normal and cancer, or different time points. Several tools have been developed for this purpose, for example, DESeq, edgeR, limma and cuffdiff. These tools base on different statistics models, such as negative binomial, or Bayes.
For the differential expression detection, there are two important steps. The initial step is normalization. During the preparation of libraries, due to different platform, the library sizes can differ in a large range6. To detect the differential expression genes, normalization is a core step7. The fundamental assumption for RNA-seq differential expression analysis is the number of reads which are aligned to the genes can present the expression level of these genes. Therefore, there are two biases: sequencing depth and gene length8. During the library preparation, larger library sizes will generate more reads. And the longer genes will have more reads aligned. One simple way to figure out the biases is to divide the counts number for each gene by the gene length and library size. FPKM4 (Fragments Per Kilobase of exon per Million fragments mapped) is introduced in cuffdiff to deal with such issue. However, according to the experiment experience, there
3
are always small amount genes which can generate larger proportion of reads9. They can affect the library size. It means that the proportions of reads which are generated by genes are dependent on other genes.
After the normalization step, differential expression analysis will be conducted. To model the distribution of number of reads which are aligned to different genes, it is very common to think about Poisson distribution. But for the Poisson distribution, there is only one parameter λ. The mean and variance both equal to λ. However, in the RNA-seq data, the variance is always larger than the mean10. Instead of Poisson distribution, negative binomial distribution11 is introduced, since in the negative binomial distribution, the variance is not necessary to be equal to mean.
4 CHAPTER 2
DATASET
2.1SEQC
The dataset is part of SEQC study. There are two conditions: condition A and condition B. Each condition has five replicates. For condition A, the sample is a mixture of ten human’s different cell types (B lymphocyte, brain, breast, cervix, liposarcoma, liver, macrophage, skin, testis, and T lymphocyte). For conditions B, the sample is a mixture of several brain regions from 23 adults. These replicates are technical replicates, because replicates of the same condition are from a single sample. Each sample was mixed with a set of synthetic RNAs from the External RNA Control Consortium (ERCC) at known concentrations. Samples from condition A contain 2% by volume of ERCC mix 1. Samples from condition B contain 2% by volume of ERCC mix 2.
2.2ERCC RNA Spike-In Mix and qRT-PCR
In the ERCC spike-in control, there are 92 synthetic polyadenylated oligonucleotides of 250-2000 nucleotides long. There are two mixtures, mixture 1 and mixture 2. The 92 synthetic polyadenylated oligonucleotides are divided into four subgroups, A, B, C, and D. Each subgroup has 23 transcripts. And their concentrations ratios in mixture 1 and mixture 2 are 4, 0.5, 0.67 and 1 separately. In the differential expression analysis step, the subgroup D with concentration ratio 1 will be considered as true negative, and other three subgroups are considered as true positive.
5
Except for the 92 synthetic polyadenylated oligonucleotides, there are around 1000 genes’ expressions in eight replicates (four replicates from condition A and four replicates from condition B) have been measure by qRT-PCR technology.
2.3Melanoma Dataset
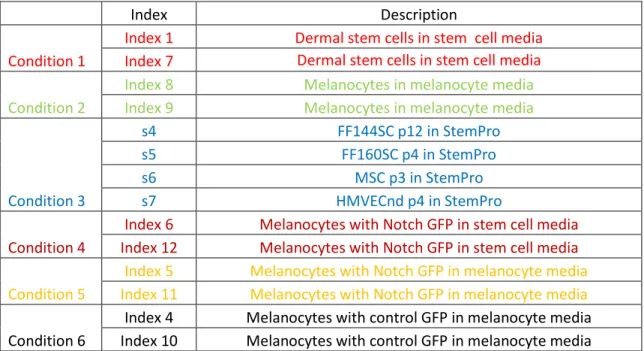
There are 14 samples which are divided into six conditions in melanoma dataset. The detailed information is showed in table 2.1. Four comparisons are conducted between these conditions: condition 1 vs. condition 2, condition 1 vs. condition 3, condition 4 vs. condition 6, condition 5 vs. condition 6. To conduct the false positive comparison, pairwise comparisons are carried out between the four replicates in condition 3.
Table 2.1 Description of the Melanoma Dataset
Index Description
Condition 1
Index 1 Dermal stem cells in stem cell media Index 7 Dermal stem cells in stem cell media
Condition 2
Index 8 Melanocytes in melanocyte media Index 9 Melanocytes in melanocyte media
Condition 3 s4 FF144SC p12 in StemPro s5 FF160SC p4 in StemPro s6 MSC p3 in StemPro s7 HMVECnd p4 in StemPro Condition 4
Index 6 Melanocytes with Notch GFP in stem cell media Index 12 Melanocytes with Notch GFP in stem cell media
Condition 5
Index 5 Melanocytes with Notch GFP in melanocyte media
Index 11 Melanocytes with Notch GFP in melanocyte media
Condition 6
Index 4 Melanocytes with control GFP in melanocyte media Index 10 Melanocytes with control GFP in melanocyte media
6 CHAPTER 3
ALIGNMENT AND GENE COUNTS
3.1Sequence Alignment
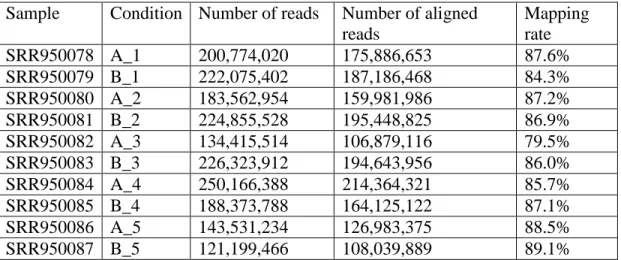
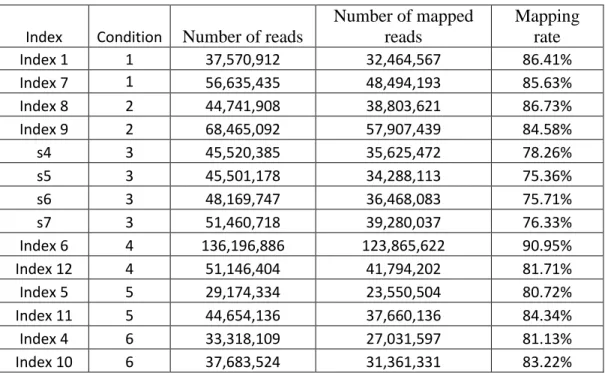
All the sequenced short reads are aligned to human genome hg19.gtf which is downloaded from UCSC. For SEQC dataset, the hg19.gtf file is mixed with ERCC transcript information which is downloaded from Life technology website http://www.lifetechnologies.com/order/catalog/product/4456740. Tophat212 is used to carry out the alignment task. And the summary of the alignment is generated (Table 3.1, 3.2). The average mapping rate of SEQC dataset is 86.19%. The average mapping rate of melanoma dataset is 82.22%.
Table 3.1 Summary of the Alignment of SEQC Dataset
Sample Condition Number of reads Number of aligned
reads Mapping rate SRR950078 A_1 200,774,020 175,886,653 87.6% SRR950079 B_1 222,075,402 187,186,468 84.3% SRR950080 A_2 183,562,954 159,981,986 87.2% SRR950081 B_2 224,855,528 195,448,825 86.9% SRR950082 A_3 134,415,514 106,879,116 79.5% SRR950083 B_3 226,323,912 194,643,956 86.0% SRR950084 A_4 250,166,388 214,364,321 85.7% SRR950085 B_4 188,373,788 164,125,122 87.1% SRR950086 A_5 143,531,234 126,983,375 88.5% SRR950087 B_5 121,199,466 108,039,889 89.1%
7
Table 3.2 Summary of the Alignment of Melanoma Dataset
Index Condition Number of reads
Number of mapped reads Mapping rate Index 1 1 37,570,912 32,464,567 86.41% Index 7 1 56,635,435 48,494,193 85.63% Index 8 2 44,741,908 38,803,621 86.73% Index 9 2 68,465,092 57,907,439 84.58% s4 3 45,520,385 35,625,472 78.26% s5 3 45,501,178 34,288,113 75.36% s6 3 48,169,747 36,468,083 75.71% s7 3 51,460,718 39,280,037 76.33% Index 6 4 136,196,886 123,865,622 90.95% Index 12 4 51,146,404 41,794,202 81.71% Index 5 5 29,174,334 23,550,504 80.72% Index 11 5 44,654,136 37,660,136 84.34% Index 4 6 33,318,109 27,031,597 81.13% Index 10 6 37,683,524 31,361,331 83.22% 3.2Gene Counts
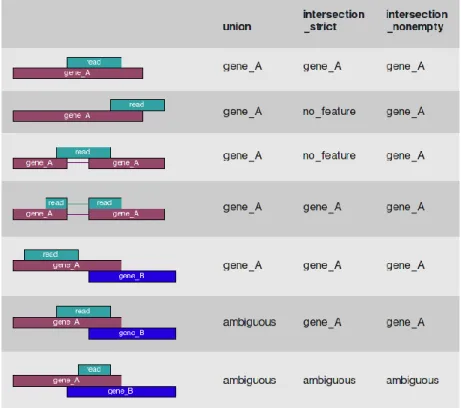
HTSeq was used to generate the raw gene counts from the aligned bam files with the following parameters: -m intersection-strict –s no. With the paramater –m intersection, if there are reads which are aligned to multiple genes, these reads were excluded (Figure 3.1). The distribution of raw counts numbers after log2 transformation is shown in Figure A.1 and B.1.
8
Figure 3.1 Illustration of the effect of the model in HTSeq-count. There are three models in HTSeq-count, and the model of intersection-strict was used in the thesis.
9 CHAPTER 4
RESULTS
4.1Normalization
The first step of differential expression analysis of RNA-seq data is normalization. It is very important to the downstream analysis. To compare the normalization methods of different tools, boxplots of distributions of normalized counts are generated and hierarchical clustering is used based on the normalized counts of each sample6. For a good normalization, the hierarchical clustering should group different samples from the same condition into a cluster.
From the boxplots of distributions of normalized counts by different tools (Figure A.2 to A.5 and Figure B.2 to B.5), the distributions of normalized counts by DESeq, limma and cuffdiff are good and very similar to each other. But for edgeR, the distributions of normalized counts do not change compared to raw counts.
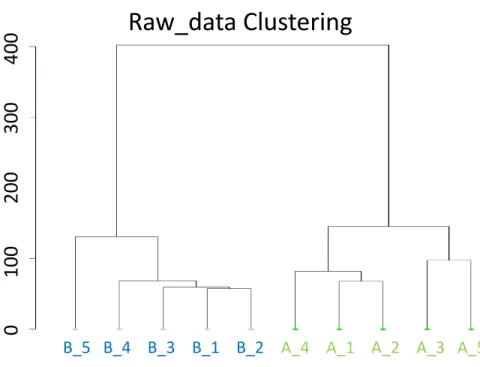
During the hierarchical clustering analysis, for the SEQC data, the result shows that all the tools perform very well (Figure C.1). Different replicates from same conditions are grouped together. But when the same clustering is performed in the raw counts, it still can separate samples based on their conditions (Figure 4.1). Admittedly, this method cannot prove the performance of normalization methods. As a result, Dunn cluster validity index6 is introduced to compare the clustering. A good clustering is a kind of one, in which, members in the same cluster have a small variance, and the means of different clusters should be different enough. A higher Dunn index indicates better
10
clustering. As a result, DESeq has a highest Dunn index, while cuffdiff has a lowest Dunn index (Figure E.1).
0
10
0
20
0
30
0
40
0
Raw_data Clustering
B_5 B_4 B_3 B_1 B_2 A_4 A_1 A_2 A_3 A_5
Figure 4.1 Hierarchical clustering based on the raw counts. Hierarchical clustering based only the raw counts of ten samples still can group samples from the same condtions together.
For the melanoma dataset, the result of hierarchical clustering analysis is completely different. In comparsion between condition 1 and condition 2, index1 and index8 are grouped together, index7 and index9 are grouped together (Figure D.1). Actually, index1 and index8 are from the same individual, and index7 and index9 are from another individual. In another three comparisons, the performances of the four tools are very similar to each other. Samples from the same conditions are grouped together.
Since around 1000 genes’ expression of eight samples in SEQC dataset (four replicates of condition A and four replicates of condition B) has been measured by qRT-PCR, the correlation between the logFC (fold change by log transformation) of
11
expression measured by qRT-PCR and these differential expression analysis tools can be computed6. A higher correlation value indicates a better normalization. DESeq has a largest RMSD correlation 1.94 and limma has a smallest one 1.26 (Figure F.1).
To sum up, there is no big difference in normalization step among these tools except for edgeR. DESeq performs a little better than others.
4.2Differential Expression Analysis
In the SEQC data, there are total 22425 genes, and the numbers of detected differential expressed genes by different tools are showed in table 4.1. The average percentage of detected differential expressed genes is 71.96%. The overlaps of detected differential expressed genes by different tools are generated. To measure the level of overlap, the overlapping correlation is computed. For two sets, the number of overlapped elements divided by the minimum number of elements between the two sets is computed as the overlapping correlation. The minmium overlapping correlation is 0.94 which indicates that the detected differential expressed genes by different tools are very similar to each other.
Table 4.1 Numbers of Detected Differential Expressed Genes by Tools in SEQC Number of Differential
Expressed Genes Total Percentage
DESeq 16042 22425 0.715362
edgeR 16617 22425 0.741003
limma 17000 22425 0.758082
12
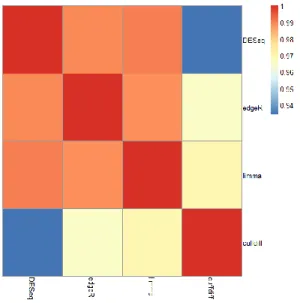
Figure 4.2 Overlapping correlation of differential expressed genes by four tools. The overlapping correlation of DESeq and edgeR is highest.
In the SEQC dataset, there are 92 synthetic oligonucleotides which are mixed into two mixtures. The 92 synthetic oligonucleotides are divided by four groups, and each group has 23 synthetic oligonucleotides. The four groups have different concentration ratios in the two mixtures which are 4, 0.5, 0.67 and 1. In the comparison, the group with concentration ratio 1 is considered as true negative, and others are true positive. The sensitivity and specificity of differential expression detections are showed in Table 4.2. Also the ROC curve was computed (Figure 4.3). edgeR has a higher AUC value 0.793.
Table 4.2 Sensitivity and Specificity of Differential Expression Detection DESeq edgeR limma cuffdiff
Total 68 74 73 59
True Positive 58 62 62 48
Sensitivity 84.1% 89.9% 89.9% 69.6% Specificity 56.5% 47.8% 52.2% 52.2%
13
Figure 4.3 ROC analysis of differential expression detection in ERCC control. edgeR has a higher AUC value.
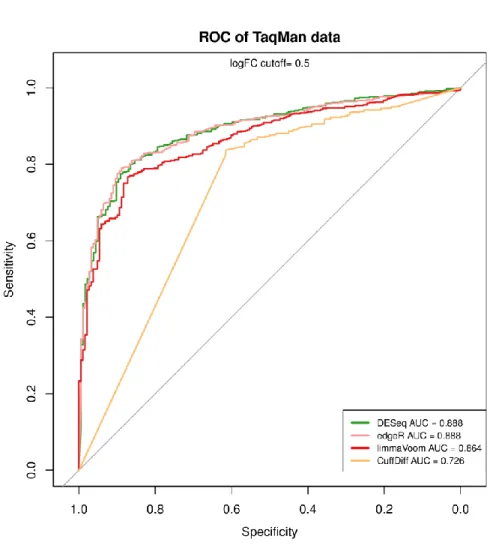
Another comparison is carried out on the around 1000 genes whose expression have been measured by qRT-PCR. First, calculate the log2 fold change ratios between two conditions. Then set the log2 fold change ratio 0.5 as the cutoff. It means that genes with log2 expression change larger than 0.5 are considered as differential expressed genes. Under this assumption, there are total 764 genes are differential expressed. The numbers of detected differential expressed genes by different tools are showed in table 4.2. Furthermore, the ROC curve was also generated (Figure 4.4). The result shows that DESeq and edgeR have higher AUC value 0.888, and cuffdiff has a lower AUC value 0.726.
14
Table 4.3 Numbers of Detected Differential Expressed Genes in TaqMan Data True Positive DESeq edgeR limma cuffdiff
764 (Total 1001) 626 634 635 605
Figure 4.4 ROC analysis of differential expression detection in TaqMan data. DESeq and edgeR have higher AUC values.
For the melanoma dataset, all the four comparisons are conducted by different four tools. And the overlapping correlations are generated (Figure G.1). For the comparison between group 4 and group 6, and comparison between group 5 and group6,
15
limma detected no differential expressed genes, only three tools’ overlapping correlations are computed. The overlapping correlation between DESeq and edgeR is highest 0.87, and the overlapping correlation between limma and cuffdiff is lowest 0.62.
4.3Test of Type-I Error
During the differential expression analysis, it is better to reduce the type-I error. It means that people do not want to take genes which actually are not differential expressed into consideration. After the differential expression analysis, a biological process will be carried out to test the result. By controlling the type-I error, the cost in the following step can be reduced. To perform the test, samples from the same condition are compared. For SEQC dataset, three comparisons are conducted: A_1 and A_2 vs. A_3 and A_4, A_1 and A_2 vs. A_3, A_4 and A_5, B_1 and B_2 vs. B_3 and B_4. For the melanoma dataset, three comparisons are conducted: s4 and s5 vs. s6 and s7, s4 and s6 vs. s5 and s7, s4 and s7 vs. s5 and s6. As expected, there should be no differential expressing genes. Furthermore, the distributions of p-value which are calculated by different methods should be uniform6. As shown in the result (Figure H.1 and H.2), for the SEQC dataset, the p-value is mostly uniform. Due to the noise to signal ratio is very large in the lower 25% expressed genes, the distribution of p-value in these genes is a little different. Compared to other methods, cuffdiff outputs more false positive predictions. But for the melanoma dataset, only limma has very little false positive predictions.
4.4Performance When Genes Expressed in Only One Condition
During the differential expression analysis, it is very common that there are a lot of genes which only express in only one condition. In such case, it is difficult to carry out
16
differential express analysis. Differential expression analysis tools cannot simply assign a significant p-value to these genes or do not take them into consideration. To evaluate these genes, an isotonic regression is carried out. The mean and variance of the expression values in only one condition are computed. As expected, the p-value should be consistent with the ratio of mean over standard deviation. As the ratios of mean divided by standard deviation increase, the p-value should be more significant. The advantage of isotonic regression compared with liner regression is that it does not assume any form of the target function. As the result shows, limma performs best in such kind of regression model, while other three methods have pool performances (Figure I.1). The ratio of mean divided by standard deviation 3 was set as a cutoff. Genes that have a ratio larger than 3 were considered as differential expressed. And ROC curve were generated. Limma has the highest AUC value 0.969.
Such test is also carried out in melanoma dataset (Figure I.2 to I.5). But only in comparison between condition 1 and condition 3, limma has very clear pattern as expected.
17 CHAPTER 5 DISCUSSION
There are several following evaluations can be carried out. Firstly, in the SEQC dataset, the library of each sample is very similar to each other. In the reality, it is very possible that the libraries sizes change a lot among different samples. To test the performance of these tools, the numbers of several samples’ reads can be amplified and others can be reduced. Then the differential expression analysis can be conducted to compare their performance. Secondly, during the evaluation of type-I error control, cuffdiff outputs a lot of very significant expressed genes. A clear and deep investigation can be conducted to check whether these genes are actually differential expressed even in the samples of same condition. Thirdly, the sensitivity and specificity comparison based on the melanoma dataset can be conducted. The fold change of the raw counts can be computed, and the genes with log2 transformation of fold change larger than 3 will be considered as differential expressed. Then, the sensitivity and specificity of these tools can be computed.
18 APPENDIX A
DISTRIBUTION OF RAW AND NORMALIZED COUNTS OF SEQC DATASET
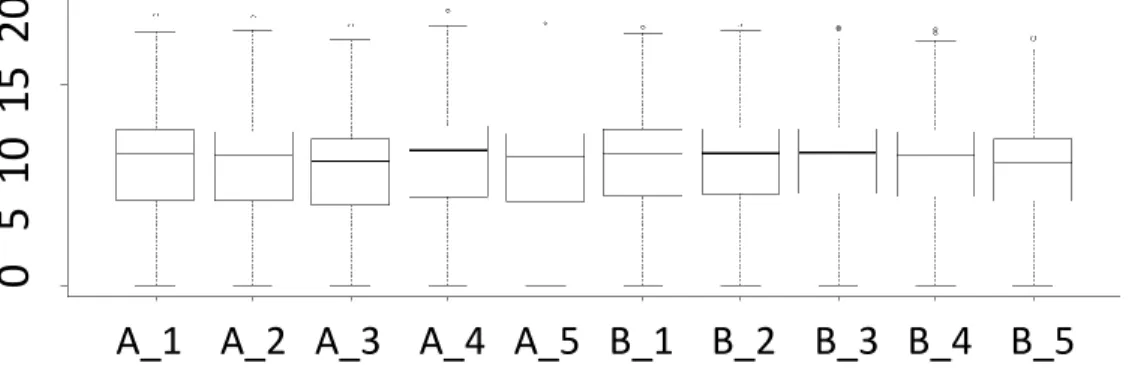
Figure A.1 to A.5 show the distribution of SEQC dataset’s raw and normalized counts.
0
5
10
15
20
A_1 A_2 A_3 A_4 A_5 B_1 B_2 B_3 B_4 B_5
Figure A.1 The distribution of SEQC dataset’s raw counts.
0
5
1
0
1
5
2
0
A_1 A_2 A_3 A_4 A_5 B_1 B_2 B_3 B_4 B_5
Figure A.2 The distribution of SEQC dataset’s normalized counts by DESeq.
0
5
1
0
1
5
2
0
A_1 A_2 A_3 A_4 A_5 B_1 B_2 B_3 B_4 B_5
19
-5
0
5
10
15
A_1 A_2 A_3 A_4 A_5 B_1 B_2 B_3 B_4 B_5
Figure A.4 The distribution of SEQC dataset’s normalized counts by limma.
-10
-5
0
5
10
A_1 A_2 A_3 A_4 A_5 B_1 B_2 B_3 B_4 B_5
20 APPENDIX B
DISTRIBUTION OF RAW AND NORMALIZED COUNTS OF MELANOMA
Figure B.1 to B.5 show the distribution of melanoma dataset’s raw and normalized counts (log2 transformation) in four comparisons.
0
5
1
0
1
5
2
0
in dex1 inde x4 inde x5 index6 index7 index8 index9 inde
x1
0
in
dex11 index12 s4 s5 s6 s7
Figure B.1 The distribution of melanoma dataset’s raw counts.
21
22
23
24 APPENDIX C CLUSTERING OF SEQC
Figure C.1 shows the clustering results based on the normalization counts in SEQC dataset of four tools.
0 200 100 300 400 0 200 100 400 300 0 200 100 400 300 0 200 100 400 300
B_5 B_3 B_1 B_2 B_4
A_5 A_3 A_1 A_2 A_4
B_5 B_3 B_4 B_1 B_2
A_5 A_3 A_2 A_1 A_4
B_5 B_4 B_3 B_1 B_2
A_4 A_1 A_2 A_3 A_5
B_5 B_3 B_2 B_1 B_4
A_5 A_3 A_2 A_1 A_4
Figure C.1 The clustering based on the normalized counts. The clustering shows that samples from the same conditions are very well grouped together.
25 APPENDIX D
CLUSTERING OF MELANOMA
Figure D.1 to D. 4 show the clustering results based on the normalization counts in melanoma dataset of four tools.
index1
index8
index7
index9
index1
index8
index7
index9
index1
index8
index7
index9
index1
index8
index7
index9
Figure D.1 The clustering based on the normalized counts in comparison between condition 1 and condition 2. Samples from the same individual are grouped together.
26
s7 s6 s4 s5
index1 index7
index1 index7
s7 s6 s4 s5
index1 index7
s7 s6 s4 s5
index1 index7
s7 s6 s4 s5
Figure D.2 The clustering based on the normalized counts in comparison between condition 1 and condition 3. The result of cuffdiff can group samples from the same condition together very well.
27
index6 index12
index4 index10
index6 index12
index4 index10
index6 index12
index4 index10
index6 index12
index4 index10
Figure D.3 The clustering based on the normalized counts in comparison between condition 4 and condition 6. The performances of the four tools are same with each other.
28
index5 index11
index4 index10
index5 index11
index4 index10
index5 index11
index4 index10
index5 index11
index4 index10
Figure D.4 The clustering based on the normalized counts in comparison between group 5 and group 6. The performances of the four tools are same with each other. Samples from the condition are grouped together.
29 APPENDIX E
DUNN CLUSTER VALIDITY INDICES
Figure E.1 shows the Dunn cluster validity indices of the clustering.
Figure E.1 Dunn index is used to compare the clustering of normalized counts of four differential expression analysis tools, including the raw counts. DESeq and limma have higher Dunn index values.
30 APPENDIX F
RMSD CORRELATION WITH TAQMAN FOLD CHANGES
Figure F.1 shows the RMSD correlation with TaqMan fold changes.
Figure F.1 RMSD correlation with TaqMan fold changes indicates that DESeq has a highest correlation accuracy value.
31 APPENDIX G
OVERLAPPING CORRELATION OF DIFFERENTIAL EXPRESSION ANALYSIS TOOLS
Figure G.1 shows the overlapping correlation of detected differential expressed genes by four tools in four comparisons.
Figure G.1 The overlapping correlation of detected differential expressed genes by four tools in four comparisons. The overlapping correlation between DESeq and edgeR is highest 0.87, and the mapping correlation between limma and cuffdiff is lowest 0.62.
index 17 vs. index89 index 17 vs. s4567
32 APPENDIX H
DISTRIBUTION OF P VALUES
Figure H.1 to H.2 show the distribution of p.value in different read counts quartiles.
Figure H.1 The distributions of p-value in SEQC dataset are mostly uniform. Compared to other methods, cuffdiff has more false positive predictions.
33
Figure H.2 The distributions of p-value in melanoma dataset are mostly uniform. But only limma has very little false positive predictions.
34 APPENDIX I
CORRELATION BETWEEN SIGNAL TO NOISE RATIO AND P VALUES
Figure I.1 to I.5 show the correlation between signal to noise ratio and -10log10 transformation of p values when genes only express in one condition.
limma
-lo
g1
0(
Adj.
P
-v
alu
e)
Signal-to-noise ratio (μ/σ)
edgeR -lo g1 0( Adj. P -v alu e)Signal-to-noise ratio (μ/σ)
DESeq-lo
g10(
A
dj. P
-v
alue)
Signal-to-noise ratio (μ/σ) cuffdiff -lo g10 (Adj. P -v alue) Signal-to-noise ratio (μ/σ)35
DESeq
-log10
(Ad
j.
P
-v
alu
e
)
Signal-to-noise ratio (μ/σ)
edgeR
-lo
g1
0(
Adj.
P
-v
alu
e)
Signal-to-noise ratio (μ/σ)
limma
-lo
g1
0(
Adj.
P
-v
alu
e)
Signal-to-noise ratio (μ/σ)
cuffdiff
-lo
g1
0(
Adj.
P
-v
alu
e)
Signal-to-noise ratio (μ/σ)
Figure I.2 The correlation between signal to noise ratio and -10log10 transformation of p values when genes only express in one condition in comparison between condition 1 and condition 2 of melanoma dataset.
36
DESeq
-log10
(Ad
j.
P
-v
alu
e)
Signal-to-noise ratio (μ/σ)
edgeR
-lo
g1
0(
Adj.
P
-v
alu
e)
Signal-to-noise ratio (μ/σ)
limma
-lo
g1
0(
Adj.
P
-v
alu
e)
Signal-to-noise ratio (μ/σ)
cuffdiff
-lo
g10
(Adj. P
-v
alue
)
Signal-to-noise ratio (μ/σ)
Figure I.3 The correlation between signal to noise ratio and -10log10 transformation of p values when genes only express in one condition in comparison between condition 1 and condition 3 of melanoma dataset.
37
DESeq
-lo
g10(
A
dj. P
-v
alue)
Signal-to-noise ratio (μ/σ)
edgeR
-log10
(Ad
j.
P
-v
alu
e)
Signal-to-noise ratio (μ/σ)
limma
-log10
(Ad
j.
P
-v
alu
e
)
Signal-to-noise ratio (μ/σ)
cuffdiff
-lo
g1
0(
Adj.
P
-v
alu
e)
Signal-to-noise ratio (μ/σ)
Figure I.4 The correlation between signal to noise ratio and -10log10 transformation of p values when genes only express in one condition in comparison between condition 4 and condition 6 of melanoma dataset.
38
DESeq
-lo
g1
0(
Adj.
P
-v
alu
e)
Signal-to-noise ratio (μ/σ)
edgeR
-lo
g1
0(
Adj.
P
-v
alu
e)
Signal-to-noise ratio (μ/σ)
limma
-log10
(Ad
j.
P
-v
alu
e
)
Signal-to-noise ratio (μ/σ)
cuffdiff
-log10
(Ad
j.
P
-v
alu
e
)
Signal-to-noise ratio (μ/σ)
Figure I.5 The correlation between signal to noise ratio and -10log10 transformation of p values when genes only express in one condition in comparison between condition 5 and condition 6 of melanoma dataset.
39 APPENDIX J
ROC CURVE WHEN SIGNAL TO NOISE RATIO 3 IS SET AS CUTOFF
Figure J.1 shows the ROC curve when signal-to-noise ratio 3 is set as cutoff.
Figure J.1 ROC curve when the cutoff of signal-to-noise ratio is 3. limma has the highest AUC value 0.969.
40
REFERENCES
1. Anders, S. & Huber, W. Differential expression analysis for sequence count data. Genome Biol. 11, R106 (2010).
2. Robinson, M. D., McCarthy, D. J. & Smyth, G. K. EdgeR: a Bioconductor package for differential expression analysis of digital gene expression data. Bioinformatics 26, 139–140 (2010).
3. Smyth, G. K. in Bioinforma. Comput. Biol. Solut. Using R Bioconductor (Gentleman, R., Carey, V. J., Huber, W., Irizarry, R. A. & Dudoit, S.) 397–420 (Springer, New York, NY, 2005). at <http://link.springer.com/chapter/10.1007/0-387-29362-0_23>, accessed December 6, 2013.
4. Trapnell, C. et al. Differential analysis of gene regulation at transcript resolution with RNA-seq. Nat. Biotechnol. 31, 46–53 (2013).
5. MAQC Consortium et al. The MicroArray Quality Control (MAQC) project shows inter- and intraplatform reproducibility of gene expression measurements. Nat. Biotechnol. 24, 1151–1161 (2006).
6. Rapaport, F. et al. Comprehensive evaluation of differential gene expression analysis methods for RNA-seq data. Genome Biol. 14, R95 (2013).
7. Dillies, M.-A. et al. A comprehensive evaluation of normalization methods for Illumina high-throughput RNA sequencing data analysis. Brief. Bioinform. 14, 671–683 (2013).
8. Oshlack, A. & Wakefield, M. J. Transcript length bias in RNA-seq data confounds systems biology. Biol. Direct 4, 14 (2009).
9. Bullard, J. H., Purdom, E., Hansen, K. D. & Dudoit, S. Evaluation of statistical
methods for normalization and differential expression in mRNA-Seq experiments. BMC Bioinformatics 11, 94 (2010).
10. Marioni, J. C., Mason, C. E., Mane, S. M., Stephens, M. & Gilad, Y. RNA-seq: an assessment of technical reproducibility and comparison with gene expression arrays. Genome Res. 18, 1509–1517 (2008).
11. Young, M. D. et al. in Bioinforma. High Throughput Seq. (Rodríguez-Ezpeleta, N., Hackenberg, M. & Aransay, A. M.) 169–190 (Springer New York, NY, 2012). at <http://link.springer.com/chapter/10.1007/978-1-4614-0782-9_10>, accessed December 6, 2013.
12. Kim, D. et al. TopHat2: accurate alignment of transcriptomes in the presence of insertions, deletions and gene fusions. Genome Biol. 14, R36 (2013).