Management E
ffi
ciency and
ebit
Azhagaiah Ramachandran Muralidharan Janakiraman
This paper is aimed at analyzing the relationship between Working Capital Management Efficiency (wcme) and Earnings before Interest & Taxes (ebit) of the Paper Industry in India during1997–1998to2005– 2006. To measure thewcmethree index values viz., Performance Index (pi), Utilization Index (ui), and Efficiency Index (ei) are computed, and are associated with explanatory variables, viz., Cash Conversion Cycle (ccc), Accounts Payable Days (apdays), Accounts Receivables Days (ardays), Inventory Days (invdays). Further, Fixed Financial Assets Ratio (fixdfara), Financial Debt Ratio (findbtra) and Size (Natural log of Sales) are considered as control variables in the analysis, and are associated with theebit. The study reveals that the Paper In-dustry has managed thewcsatisfactorily. Theapdays has a significant (–)ve relationship withebit, which indicates that by deploying pay-ment to suppliers they improve theebit. The Paper Industry in India performs remarkably well during the period, however, less profitable firms wait longer to pay their bills, and pursue a decrease inccc.
Key Words:Working Capital Management Efficiency, Earnings
before Interest and Taxes, Current Assets, Current Liabilities, Performance Index, Utilization Index, Efficiency Index jelClassification:g30,g32
Working Capital (wc) is the flow of ready funds necessary for the working of a concern. It comprises funds invested in Current Assets (cas), which in the ordinary course of business can be turned into cash within a short period without undergoing diminishing in value and without disruption of the organization.Current Liabilities(cls) are those which are intended to be paid in the ordinary course of business within a short time. Every company has to make arrangements for ade-quate funds to meet the day-to-day expenditure apart from investment
Dr Azhagaiah Ramachandran is an Assistant Professor of Commerce in the Department of Commerce, Kanchi Mamunivar Centre for Post Graduate Studies, India.
Muralidharan Janakiraman is a Research Scholar in the Department of Commerce, Kanchi Mamunivar Centre for Post Graduate
inFixed Assets(fas). The internal resources of a business organization often are insufficient for meeting all its needs. Also it is not always pos-sible for the owners, promoters or the entrepreneurs to mobilize finance from their personal resources. Resources, therefore, have had to be fi-nanced through borrowing, keeping in view the short, medium and or long term requirements of trade or industry for funds.
Statement of the Problems, Significance and Scope
One of the serious problems faced by the Paper Industry in India is the incidence of sickness. There are many reasons for the sickness of the pa-per industry. One of the important reasons is low pa-per capita consump-tion of paper in India. The industry experiences frequent dwindling de-mands and low ebit. The paper industry is highly capital intensive. Some of the units that are installed in the backward areas suffer from inadequate infrastructure facilities such as lack of trained manpower, transportation and sustained power supply, the failure of industry in maintaining adequate liquidity leading to imbalanced capital structure, thereby affectingebit.
Very few studies have been made in relation toWorking Capital Man-agement(wcm) especially in the paper industry in India. Therefore, the present study is a maiden attempt to analyze the relationship between
wcmefficiency andebitin the paper industry in India. The study cov-ers only the listed paper companies onBombay Stock Exchange(bse) in India, for which an attempt is made to provide an empirical support to the hypothesized relationship betweenwcmefficiency andebit.
Objectives of the Study
The objective of the study is to examine the relationship between the
wcmefficiency andebitof the paper industry in India. The following are the specific objectives:
• To analyse the firm’s efficiency inwcmin the paper industry in In-dia.
• To analyse the relationship betweenwcmefficiency andebitin se-lected companies in the paper industry in India.
Review of the Literature
Experts (William1939) determined the factors of wc and pointed out that wc is an element to be considered in fixing the rate-base.
Main-tenance of adequate wc is an essential condition for efficient finan-cial management (Mohan1991).wcoffers huge cash opportunities that could be released with sustainability within a relative short period of time (Loneux2004). Inventory, receivables, cash and working finance are the four problem areas of wcm (Mishra1975). Inventory represents more than61% of the totalcas of the firm (Swamy1987).
wchas been financed from internal as well as external sources (Fazee-ria2002). Companies have increasingly been relying on short-term funds particularly short-term bank credit and trade credit (Gupta and Sharma
2003).wcratios are useful tools in appraising the financial strength and; immediate solvency of a firm (Sagan1955). Current and quick ratios reg-istered insignificant associations whilst the comprehensive liquidity in-dex indicated significant associations with return on investment (roi) (Smith and Bahaman 1997). The lower the level of liquid assets, the greater will be the risks of not being able to meet current obligations (Van Horne1969).
The major reason for slow progress of an undertaking is shortage or wrong management of wc (Siddarth and Das1993). Due to lack of a proper plan forwcrequirements most firms often experience excesswc or shortage of wc (Agarwal1977). Firms are able to reduce financing costs/or increase the funds available for expansion by minimizing the amount of funds tied up incas. There is a significant difference among industries inwcmeasures across time (Krueger2002).
The way in whichwcis managed will have a significant impact on the profitability of companies. This is a significant (–)ve relation between gross operating income and the number of days of accounts receivable, inventories and accounts payables. The (–)ve relation between account payables and profitability is consistent with the view that less profitable companies wait longer to pay their bills (Deloof 2003). The chief ex-ecutives properly recognize the role of efficient use of wc in liquidity and profitability, but in practice they could not achieve it due to sub-optimum utilization ofwc(Prasad2001). The Public Sector Enterprises (psus) could improve thewcmeby reducing their dependence on out-side funds (Jain1988).
Efficientwcmis necessary for achieving both liquidity and profitabil-ity of a company. A poor and inefficientwcmleads to tie up funds in idle assets and reduces the liquidity and profitability of a company (Reddy and Kameswari2004). Efficient liquidity management involves planning and controllingcas andcls in such a manner that eliminates the risk of
inability to meet due short-term obligations and avoids excessive invest-ment in these assets. Theccchas been one of the more important mea-sures of liquidity than the current ratio that affects profitability. There is a (–)ve relationship between profitability and liquidity indicators such as current ratio and cash gap (Eljelly2004).
wcmcould vitally affect the health of the firm (Sagan1955). Industry practices, company size, future sales growth of company, the proportion of outside directors on a board, executive compensation (current por-tion), andceo share ownership significantly influence the wcme of a company (Kieschnick1960). For measuringwcme, performance, utiliza-tion, and overall efficiency indices were used, instead of some common
wcmratios (Gosh and Maji2003).
There is a strong (–)ve relation betweencccand corporate profitabil-ity of a large sample of listed American companies during 1975–1994 (Shin and Soenen1998). There is a significant +ve relationship between profitability, measured through gross operating profit, andccc. Profit can be created by handling correctly thecccand keeping each of the dif-ferent components (accounts receivables, accounts payables, inventory) to an optimum level (Lazaridis and Tryfonidis2006). There is a signif-icant (–)ve relationship betweenwcmand profitability. The greater the
cccthe lesser will be the profitability. There is a significant (–)ve rela-tionship between liquidity and profitability. There is also (–)ve relation-ship between debt used by the firm and its profitability (Rehmann2007).
h1
0 There is no significant efficiency in the use of various components of
cas for enhancing sales in the paper industry. h2
0 The paper industry as a whole does not have the ability to utilise all
thecas for the purpose of generating sales. h3
0 The paper industry, as a whole does not have efficiency inwcm.
h4
0 There is no significant relationship betweenwcmefficiency andebit
of the paper industry in India.
Although ample research studies have been conducted in the field of
wcm, very few researches touched on the aspects of wcm and ebit. Therefore, to fill this gap in the literature, the study has been undertaken.
Methodology, Sources of Data and Sampling Design
The study used only secondary data, which are collected from thecmie prowess (package). The collected data from this source have been com-piled and used with due care as per the requirements of the study.
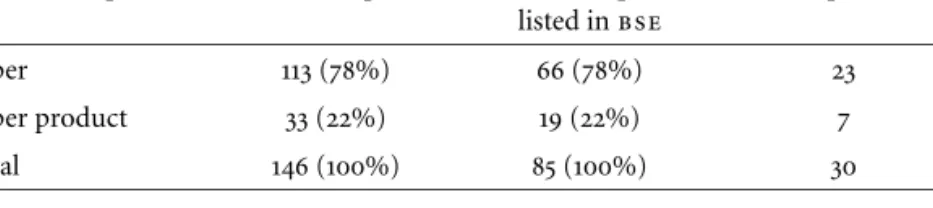
Orig-table 1 Sample procedure
Type of companies No. of companies No. of companies listed inbse
Sample size
Paper 113(78%) 66(78%) 23
Paper product 33(22%) 19(22%) 7
Total 146(100%) 85(100%) 30
inally the sample for this study had been planned to choose from the list of companies listed in National Stock Exchange (nse). Since the number of companies listed in the nseis small (6companies in the paper and paper product industry), the sample of30companies of paper industry has been chosen from85listed companies inbse.
The Sample Interval (si) is calculated by N/n. si = 85/30 = 2.8333. All the bse listed paper and paper product companies are considered and every3rd company is selected for the study by use of theSystematic Random Sampling Technique.The data used for the analysis relate to the selected paper companies for the period of ten years on a yearly basis ranging from1997–2006.
Variables Used for Analysis of Data
analysis i:wcm efficiency
The first part of the analysis is the measure ofwcmefficiency for which three indexes are used, viz., Performance Index (pi), Utilization Index (ui) and, Efficiency Index (ei).
piwcm = Is n i=1 Wi(t−1) Wit N , (1)
whereIs= sales index defined asSt/St−1,Wi= individual group ofcas, N= number ofcas group, andi=1,2,3, . . .N.
uiwcm= AAt−1 t
, (2)
whereA = (current assets)/sales.
eiwcm =piwcm×uiwcm. (3)
analysis ii:net ebit
The second part of the analysis is the measure of Netebit, for which the following equation is formulated, based on the basic indicator.
The general form of the model is:
ebitit=β1(piit) + β2(uiit) + β3(eiit) + β4(cccit)
+ β5(ffarit) + β6(fdrit), (4) where ebitit = Earnings Before Interest & Tax (i at timet;i= 1,2, 30 companies),ccc= Cash Conversion Cycle = No. of Daysa/r+ No. of Days Inventory – No. of daysa/p;fdr= Financial Debt Ratio = (Fixed Financial Assets)/(Total Assets);ffar= Fixed Financial Assets Ratio = (Short Term Loans + Long Term Loans)/(Total Assets).
Tools Used for Analysis
To analyze thewcmefficiency of the paper industry in India, statistical techniques vizMinimum, Maximum, Mean, Standard Deviation and Co-efficient of Variation, Correlation, and Regression Matrixhave been used. To ascertain the linear trend and sign of growth in various components ofwcratios, the simple regression technique has been extensively used.
Limitations and Scope for Further Study
• The study is confined to ten years data only, i. e. from1997–2006, therefore, a detailed analysis covering a lengthy period, which may give slightly different results has not been made.
• The study is based on secondary data collected from the cmie prowess (package), therefore the quality of the study depends purely upon the accuracy, reliability and quality of the secondary data source. Approximation, and relative measures with respect to the data source might impact the results.
• The study is based on30companies of the Paper Industry in India that are also drawn from the companies listed in bse. Therefore, the accuracy of results is purely based on the data of sample units. If one takes sample units from, say,niftythe results may go slightly differently.
Further studies could be made by future researchers in the following aspects and areas:
• by inclusion of extraneous variables like profitability ratios (g/p ra-tio,n/pratio, etc) and analyzing the inter-relationship between the
• by categorizing the firms into heterogeneous groups like Small, Medium, and Large firms based on measures like assets, capital, long term borrowings, and Net Worth.
Industry Analysis and Findings
An evaluation ofwcmefficiency of the paper industry as a whole is done here. It can be observed vide table2that there are occurrences of thepi,
uiandeivalues of above 1in3,5and4respectively out of9years. In many years,piandeivalues are <1, but mean value ofpiis nearer to1 (0.93) andeivalue is1.01. This shows that the Paper Industry has satisfac-torily managed itswcwhile handling itscasfor generating sales and has adopted a moderate wcmpolicy. But, the incidences of the occurrence of the most successful year (ei >1) followed by the most unsuccessful one (ei<1), and vice versa, have exposed the fact that the industry has been inefficient in adopting a very soundwcmpolicy. Moreover, the co-efficient of variation (cv), which is very high at 49.12when compared to that of pi, uiandei, elicits the high degree of inconsistency in the
wcm policy adopted by the paper industry. Further, Compounded An-nual Growth Rates (cagrs) are (–)ve for all the indices.
This, in turn, reveals that the efficiency in managingwcrequired for various components ofcas relevant to augmenting the sales as well as
wcm policy has been kept weakening further over the period of study. Overall, it can be inferred that the Paper Industry has shown low effi -ciency inwcmrelevant to manufacturing activities, and has been ineffi -cient in adopting a soundwcmpolicy on the whole during the period of study.
Regression Analysis and Results
In order to measure the firm’s efficiency in achieving the targeted level of efficiency during the study period, theolsmodel has been used. The es-timatedβvalue represents the speed of the individual firm in improving the efficiency in achieving the industry norms in this regard.
Firm’s efficiency in the matter of managingwcis equal to the average efficiency level of the industry as a whole. Similarly, < 1 indicates the need of the firm to further improve its efficiency inwcm.
Management ofwcis an essential condition of financial management (Reddy 1991). The wcm has highlighted the managerial aspects of in-ventories, receivables and advances, and cash (Rao1985). Thewcmehas been tested through a hypothesis in terms of various components ofcas.
table 2 Average Performance, Utilization and Efficiency Indices showing thewcm Efficiency of the Paper Industry
Financial Year Performance Index Utilization Index Efficiency Index
1997–1998 1.47 1.35 1.98 1998–1999 0.65 0.75 0.49 1999–2000 1.12 1.26 1.41 2000–2001 0.79 1.05 0.83 2001–2002 0.71 0.84 0.60 2002–2003 1.17 1.21 1.42 2003–2004 0.71 0.89 0.63 2004–2005 0.97 1.06 1.03 2005–2006 0.77 0.93 0.71 Minimum 0.65(1999) 0.75(1999) 0.49(1999) Maximum 1.47(1998) 1.35(1998) 1.98(1998) Mean 0.93 1.04 1.01 sd 0.27 0.20 0.50 cv 29.54 19.67 49.12 cagr –3.15 –1.67 –4.77
notes Computed from Financial Statements; figures in parentheses are years.
h1
0 There is no significant efficiency in use of various components ofcas
for enhancing sales in the paper industry.
Theh10is rejected; numerically the overallpi(>1) indicates efficient
wcm. Average value of pi, as a whole, shows that the pi is > 1 for 17 firms out of30firms. Thus, the performance of the industry as whole in
wcmwas mostly efficient during the period of study. Similarly, from the
olsregression results for uiit is understood that14out of30firms (β coefficients >1) are successful in establishing their efficiency in the paper industry in the matter of utilization ofcas as a whole in generating sales. The chief executives of the paper industry properly recognized the role of efficient use of wcin liquidity and profitability, but in practice they could not achieve it. Most of them followed the budgetary method in planningwc, andwcm was inefficient due to sub-optimum utilization ofwc(Prasad2001). The level ofwcis a function of sales (Sagan1955). This statement has been tested inh20.
h2
0 The paper Industry as a whole does not have the ability to utilise the
table 3 Regression Results showing the Relationship between Cash Conversion Cycle andebitof the Paper Industry
Explanatory variables Coefficient seof coeff. tvalue Pvalue Intercept –88.38822 8.9779 –9.85 0.0000 fixdfara –266.63492 90.5067 –2.95 0.0035 findbtra –2.7995 14.2790 –0.20 0.8447 lnsales 27.25302 1.7090 15.95 0.0000 ccc –0.04161 0.0201 –2.07 0.0390 R2 0.4696 AdjustedR2 0.4625 Fvalue 65.312 Degrees of freedom 4,295
notes 1Significant at5% level.2Significant at1% level.
Theh2
0is rejected; numerically, the overallui(>1) indicates efficient
wcm. The average value of ui, as a whole, shows that theuiis >1 for
15firms out of30firms. Thus, the utilization ofwcfor the industry as a whole was mostly efficient during the period of study. From the results ofolsregression forei, it is evident that the >1for12out of30firms, i. e., these12firms have achieved targeted industry norms in respect of adopting efficiency inwcmpolicy.
Efficientwcmis necessary for achieving both liquidity and profitabil-ity of a company. A poor and inefficient wcm leads to tie up funds in idle assets and reduces the liquidity and profitability of a company (Reddy and Kameswari2004). wc offers huge cash opportunities that could be released with sustainability within a relative short period of time (Loneux2004). This has been tested inh3
0.
h3
0 The paper Industry, as a whole, does not have efficiency inwcm. The h30 is rejected as the ei(> 1) shows efficient wcm. The average value of eishows that the eiis >1 for 12firms out of30firms under study for the study period.
Relationship betweenWCMEfficiency andEBIT
The relationship of Earnings before Interest and Taxes (ebit) of the pa-per industry with efficiency ofwcmis evaluated here.ebitis taken as the proxy andccc,apdays,ardays,invdaysare considered as measures ofwcmefficiency in the analysis. Apart from these variables,fixdfara,
findbtraand size (natural log of sales) are considered as control ables in the regression model. First, correlation among all selected vari-ables is worked out andolsregression is run, the results of the regression are presented in table3.
From the regression results, it is apparent thatapdayshas a signifi-cant (–)ve association withebit, which indicates that a more profitable firm delays its payment to its suppliers. The other threewcmefficiency measures, ccc with +ve in sign, ardays and invdayswith (–)ve in sign have an insignificant one to one relationship withebitin the paper industry. The +ve relationship ofcccshows that more profitable firms under paper industry failed to reduce theccc.
From the results of regression betweenebitandcccit can be inferred thatccchas a significant (–)ve relationship withebit. Also, all the three control variables are related significantly with ebit. The relationships of fixdfra and findbtra are (–)ve and that of the lnsalesis +ve with ebit. The results show that larger firms with less fixed financial assets and financial debt ratio earned moreebitby decreasing theccc remarkably under the paper industry.
The regression results between ebitandapdaysshow thatapdays has a significant +ve coefficient withebit. Further, among the control variables, the coefficient offixdfrais significant at1per cent level and that of thefindbtrais insignificant. On the other hand, size of firms is highly related toebitwith +ve in sign.
From the results, it is well established that the larger firms under the paper industry with less fixed financial assets earned moreebitby delay-ing the payment to their suppliers. Regarddelay-ing the relationship between
ebitandardays, the results of regression shown in table5reveal that the coefficient ofardaysis significant +vely, and coefficients of all the control variables are significant but with a different sign. While firm size is +vely related,fixdfraandfindbtraare (–)vely related toebitof the firms under the paper industry. In sum, it is found that the larger firms with less fixed financial assets and financial debt have generated more profit (after operating cost) by increasing the credit period granted to their customers under the paper industry.
With regard to the impact of number of days in inventory (inventory cycle) on theebitof the firms under the paper industry, the regression results disclose thatinvdayshas an insignificant (–)ve co-efficient with
ebit. On the other hand, the coefficients offixdfrawith (–)ve in sign and that oflnsaleswith +ve in sign are significant at1per cent level.
table 4 Regression Results showing the Relationship between Number of Days Accounts Payable andebitof the Paper Industry
Explanatory variables Coefficient seof coeff. tvalue Pvalue Intercept –93.83852 9.1316 –10.28 0.0000 fixdfara –259.60952 89.8865 –2.89 0.0042 findbtra –9.0700 14.8742 –0.61 0.5425 lnsales 27.68292 1.7380 15.93 0.0000 apdays 0.05091 0.0210 2.43 0.0159 R2 0.4724 AdjustedR2 0.4653 Fvalue 66.052 Degrees of freedom 4,295
notes 1Significant at5% level.2Significant at1% level.
table 5 Regression Results showing the Relationship between Number of Days in Accounts Receivables andebitof Paper Industry
Explanatory variables Coefficient seof coeff. tvalue Pvalue Intercept –99.74622 9.9563 –10.02 0.0000 fixdfara –232.82142 89.8986 –2.59 0.0101 findbtra –7.3206 14.6625 –0.50 0.6180 lnsales 27.49982 1.7180 16.01 0.0000 ardays 0.16861 0.0709 2.38 0.0180 R2 0.4720 AdjustedR2 0.4649 Fvalue 65.942 Degrees of freedom 4,295
notes 1Significant at5% level.2Significant at1% level.
However, thefindbtrahas an insignificant +ve coefficient withebit. Overall, the regression results exposed the fact that the larger firms un-der paper industry, which earn moreebit, have fewer inventories, but decrease in inventory level does not influence the increase inebit sig-nificantly. At the same time these firms have gained moreebitwith less fixed financial assets and by increasing the financial debt insignificantly.
There is a strong (–)ve relationship between variables of thewcmand profitability of the firm (Reheman 2007). This means that as the ccc increases it will lead to a decrease in the profitability of the firm, and
table 6 Regression Results showing the Relationship between Number of Days in Inventory andebitof the Paper Industry
Explanatory variables Coefficient seof coeff. tvalue Pvalue Intercept –86.26242 9.3964 –9.18 0.0000 fixdfara –255.25212 90.7656 –2.81 0.0053 findbtra5.6502 14.0239 0.40 0.6873 lnsales 26.47342 1.6602 15.95 0.0000 invdays –0.0622 0.0537 –1.16 0.2474 R2 0.4644 AdjustedR2 0.4571 Fvalue 63.942 Degrees of freedom 4,295 notes 2Significant at1% level.
managers can create a +ve value for the shareholders by reducing the
cccto a possible minimum level. This has been tested inh40.
h4
0 There is no significant relationship betweenwcmefficiency andebit
of the paper industry. Theh4
0is rejected asapdays(Fvalue66.05),ccc(Fvalue65.31), and
ardays(Fvalue65.94) and Number of Days in Inventory (Fvalue63.94) are significantly related to ebit of the paper industry. Therefore, it is inferred that there is a significant relationship betweenwcm efficiency andebitof firms in the paper industry in India.
Conclusion
The importance of efficient wcm is indisputable. Moreover, adequate
wcmis essential as it has a direct impact on ebitand liquidity. An at-tempt has been made in the present study to investigate the relationship between wcm efficiency and ebit of Indian paper companies. In the matter ofwcm, three indexes and netebithave been computed for all the firms over the period of study – ten-years.
From the study it is concluded that the Indian paper firms perform remarkably well during the period. Industry overall efficiency index was >1in3out of9years for the study period. Though some of the sample units had successfully improved efficiency during these years, the exis-tence of a very high degree of inconsistency in this matter clearly points out the need for adopting soundwcmpolicy in these firms.
There is found to be a (–)ve relationship between ebitand the cash conversion cycle (ccc) which was used as a parameter, therefore it seems that operationalebitdictates how to manage thewcof the firm. Fur-ther, it is found that lower grossebitis associated with an increase in theapdays. This could lead to the conclusion that less profitable firms wait longer to pay their bills, taking advantage of credit period granted by their suppliers. The +ve relationship betweenardaysand firmsebit suggests that less profitable firms will pursue a decrease of theirardays in an attempt to reduce their cash gap in theccc.
References
Raheman, A., and M. Nasr.2007. Working capital management and prof-itability: Case of Pakistani firms.International Review of Business Re-search3(2):275–96.
Agarwal, N. K. 1977. Management of working capital. phddiss., Delhi School of Economics.
Bhattacharya, H.1997. Towards Comprehensive theory of working capital: A techno financial approach.Economic and Political Weekly,August29. Deloof, M.2003. Does working capital management affect profitability of
firms.Vikalpa28(2):537–85.
Eljelly, A. M. A.2004. Liquidity-profitability trade off: An empirical inves-tigation in a emerging market.International Journal of Commerce and Management14(2):48–61.
Grablowsky, W.1999. Working capital management.Journal of Small Busi-ness Management37(2):59–65.
Gupta, S., and P. Sharma.2003. Financing of working capital in the food-processing industry in India.Business Analyst24(2):15–33.
Lazaridis, I., and D. Tryfonidis.2006. Relationship between working cap-ital management and profitability of listed companies in the Athens Stock Exchange.Journal of Financial Management and Analysis19(1): 26–35.
Loneux, M.2004. The working capital approach.Business Analyst25(2): 20–4.
Mishra, R. K.1975.Problems of working capital with special reference to se-lected public undertakings in India.Bombay: Somaiya.
Prasad, R. S. 2001. Working capital management in the paper industry.
Finance India15(1):185–8.
Fazeeria, R. 2002. Working capital policy in India. Business Analysis,
May:15–20.
Krueger, T. 2002. An analysis of working capital management results across industries.Mid-American Journal of Business20(2):11–8
Jain, R. K.1988.Working capital management of state enterprises in India.
Jaipur: National Publishing House.
Reddy, M.1991. Management of working capital.Vikalpa16(1):30–5.
Reddy, D. R., and P. Kameswari.2004. Working capital management prac-tices in pharma industry: A case study of ‘Cipla Limited’.Management Accountant,August:638–44.
Sagan, J.1955. Toward a theory of working capital management.The Jour-nal of Finance10(2):121–9.
Shin, H. H., and L. Soenen.1998. Efficiency of working capital manage-ment and corporate profitability.Financial Practice and Education8
(2):37–45.
Smith, M. B., and E. Begemann. 1997. Measuring associations between working capital and return on investment. South African Journal of Business Management28(1):1–4.
Siddarth, M. R., G. and Das.1994. Working capital turnover in pharma-ceutical companies.The Management Accountant,March:151-3.
Swami, H. R. 1987. Materials management in public undertakings. New Delhi: Shish.
Van Horne, J. C.1969. Risk-return analysis of a firm working capital.The Engineering Economist14(Winter):71–89.