Appendix E: Solar Thermal – Concentrated Solar
Power
This appendix was prepared by the National Renewable Energy Laboratory and is included in this report with their permission. The figure and chart numbers have been changed to be consistent with the number system of this report.
This appendix was prepared by the National Renewable Energy Laboratory and is included in this report with their permission. The figure and chart numbers have been changed to be consistent with the number system of this report.
NREL Report - Concentrating Solar Power (CSP)
NREL Report - Concentrating Solar Power (CSP)
Central Station Solar Central Station Solar
Concentrating Solar Power Concentrating Solar Power
Southern California is potentially the best location in the world for the development of large-scale solar power plants. The Mojave Desert and Imperial Valley have some of the best solar resources in the world. The correlation between electric energy demand and solar output is strong during the summer months when peak power demand occurs. This region is unique for the proximity of such an excellent solar resource to a highly populated residential and commercial region. Furthermore, the extensive AC and DC transmission network running through the region enables solar electric generation to be distributed to major load centers throughout the state. As a result of these factors and state and utility policy, the world’s largest and most successful solar electric power facilities are sited in Southern California and sell power to Southern California Edison (SCE).
Southern California is potentially the best location in the world for the development of large-scale solar power plants. The Mojave Desert and Imperial Valley have some of the best solar resources in the world. The correlation between electric energy demand and solar output is strong during the summer months when peak power demand occurs. This region is unique for the proximity of such an excellent solar resource to a highly populated residential and commercial region. Furthermore, the extensive AC and DC transmission network running through the region enables solar electric generation to be distributed to major load centers throughout the state. As a result of these factors and state and utility policy, the world’s largest and most successful solar electric power facilities are sited in Southern California and sell power to Southern California Edison (SCE).
Concentrating Solar Power Technologies Concentrating Solar Power Technologies
Concentrating solar power (CSP) technologies, sometimes referred to as solar thermal electric technologies, have been developed for power generation applications. Historically, the focus has been on the development of cost-effective solar technologies for large (100 MWe or greater) central power plant applications. The U.S. Department of Energy’s (DOE) Solar R&D program focuses on the development of technologies suitable for meeting the power requirements of utilities in the southwestern United States. Numerous solar technologies and variations have been proposed over the last 30 years by industry and researchers in the United States and abroad. The leading CSP candidate technologies for utility-scale applications are parabolic troughs, molten-salt power towers, parabolic dishes with Stirling engines, and concentrating photovoltaics.
Concentrating solar power (CSP) technologies, sometimes referred to as solar thermal electric technologies, have been developed for power generation applications. Historically, the focus has been on the development of cost-effective solar technologies for large (100 MWe or greater) central power plant applications. The U.S. Department of Energy’s (DOE) Solar R&D program focuses on the development of technologies suitable for meeting the power requirements of utilities in the southwestern United States. Numerous solar technologies and variations have been proposed over the last 30 years by industry and researchers in the United States and abroad. The leading CSP candidate technologies for utility-scale applications are parabolic troughs, molten-salt power towers, parabolic dishes with Stirling engines, and concentrating photovoltaics.
Parabolic Troughs Parabolic Troughs
Nine independent power producer (IPP) parabolic trough plants were built during the California renewable energy boom of the late 1980s, and they sell power to SCE. These plants have established an excellent operating track record for this technology. They have delivered power reliably to SCE during the summer on-peak time-of-use period. A number of technology advances have been made in recent years that are expected to make this technology more economically competitive in future projects. Key among these advances is the development of thermal energy storage. A number of new parabolic trough projects are currently in varying stages of project development around the world, some of these will include thermal energy storage.
Nine independent power producer (IPP) parabolic trough plants were built during the California renewable energy boom of the late 1980s, and they sell power to SCE. These plants have established an excellent operating track record for this technology. They have delivered power reliably to SCE during the summer on-peak time-of-use period. A number of technology advances have been made in recent years that are expected to make this technology more economically competitive in future projects. Key among these advances is the development of thermal energy storage. A number of new parabolic trough projects are currently in varying stages of project development around the world, some of these will include thermal energy storage.
Power Towers
The molten-salt power tower was developed specifically for application in utility-owned solar power stations. These are potentially the most efficient and lowest cost solar power systems. The key feature is the molten-salt working fluid, which provides efficient, low-cost thermal energy storage. This allows solar plants to be designed with high annual capacity factors or used to dispatch power to meet summer and winter peak loads. This technology has not yet been demonstrated in a commercial operating environment. As a result, significant uncertainty exists in the cost and performance of this system. A recent study by Black & Vetch1 classified this technology as being at a pre-commercial status and thus is not yet a candidate for deployment in the commercial power market environment. A number of other power tower configurations are under development. We believe these are either less attractive or less commercially ready than the molten-salt technology.
Parabolic Dishes
Parabolic dishes with Stirling engines are considered attractive because of their modular nature (25-kWe units) and their demonstrated high solar-to-electric efficiency (~30%). Their modular nature means that plants of virtually any size could be built or expanded. These systems do not require water for cooling, which is another benefit in the desert southwest. Unfortunately, the solar application of the Stirling engine was intended to leverage automotive or other applications of this engine, and this in turn would lead to improved engine reliability and reduced cost. The other applications have not occurred to date, and they seem unlikely at present. The Black & Vetch study also found dish technology to be at a pre-commercial status and thus is also not yet a candidate for pre-commercial deployment. Current systems have not demonstrated the level of reliability considered necessary for commercial system.
Concentrating Photovoltaics
Several vendors are currently developing concentrating photovoltaic (CPV) systems. Similar to dish/Stirling systems these systems are considered attractive because of their modular nature (25 to 50kWe units) and their potential for high solar-to-electric efficiency (>30%). These systems also do not require water for cooling. Manufactures are currently providing CPV systems, but only at a few MWe per year and they are still have limited operational experience. Costs are currently somewhere between parabolic trough and flat plate PV. It is our judgment that CPV systems could be attractive for small distributed systems (25kWe and above). It is not clear at what size the economics of a small trough plant becomes the preferred option.
NREL’s Recommendation for CSP
Based on the assessment of CSP technologies above, parabolic trough technology is considered the only large-scale (greater than 50 MWe) CSP technology that is available for application in a commercially-financed power project now and in the near future (5 years). The remainder of this report thus focuses on parabolic trough technology.
1 Black & Veatch, 2005, “New Mexico CSP Feasibility Study, Task 7 – Development Scenarios,” Presentation to New Mexico CSP
Parabolic Trough Development and Technology Overview
The nine Solar Electric Generating Systems or SEGS, located in the California Mojave Desert are the world’s largest solar power plants. These plants, developed by Luz International Limited (Luz) between 1984 and 1990, range in size from 14–80 MW and comprise 354 MW of installed electric generating capacity. More than 2,000,000 m2 of parabolic trough collectors have been operating at the SEGS sites daily for up to 20 years and, as the year 2003 ended, these plants had accumulated 154 years of operational experience. Parabolic trough collector technology has demonstrated its ability to operate in a commercial power plant environment like no other solar technology in the world. Although Luz, the developer of these plants, filed for bankruptcy in 1991 due in large part to falling energy prices, all nine of the investor-owned plants continue to operate daily.
While no new plants have been built since 1990, significant advances in collector and plant design have been made possible by the efforts of the SEGS plants operators, the parabolic trough industry, and solar research laboratories around the world. Given the lack of construction of new megawatt-scale plants since 1990, one perception is that parabolic troughs may be a dated technology with no potential value for the future. To the contrary, the excellent operating track record of the existing plants and significant R&D advances in trough technology since the 1990s have led to a resurgence of plant development and greater promise for this technology.
This section assesses current parabolic trough solar power technology for large-scale, grid-connected power applications, ongoing R&D activity and development efforts, and economic projections for future deployment.
Development History
In 1983, Luz negotiated a power purchase agreements with SCE for the SEGS I and II plants. Later, with the advent of the California Standard Offer (SO) power purchase contracts for qualifying facilities under the Public Utility Regulatory Policy Act (PURPA), Luz was able to sign a number of SO contracts with SCE that led to the development of the SEGS III through SEGS IX projects. Initially, the plants were limited by PURPA to 30 MW in size; later this limit was raised to 80 MW. Table E.1 shows the characteristics of the nine SEGS plants built by Luz.
Table E.1 Characteristics of SEGS I through IX (Source: Luz)
SEGS Plant 1st Year of Operation Net Output (MWe) Solar Field Outlet Temp. (ºC/°F) Solar Field Area (m2) Solar Turbine Eff. (%) Fossil Turbine Eff. (%) Forecast Annual Output (MWh) I 1985 13.8 307/585 82,960 31.5 - 30,100 II 1986 30 316/601 190,338 29.4 37.3 80,500 III & IV 1987 30 349/660 230,300 30.6 37.4 92,780
V 1988 30 349/660 250,500 30.6 37.4 91,820
VI 1989 30 390/734 188,000 37.5 39.5 90,850
VII 1989 30 390/734 194,280 37.5 39.5 92,646
VIII 1990 80 390/734 464,340 37.6 37.6 252,750
IX 1991 80 390/734 483,960 37.6 37.6 256,125
In 1991, Luz filed for bankruptcy when it was unable to secure construction financing for its tenth plant (SEGS X). Though many factors contributed to the demise of Luz, one fundamental problem was that the cost of the technology was too high to compete in the changing power market. Lotker2 describes the events that enabled Luz to successfully compete in the power market between 1984 and 1990, and many of the institutional barriers that contributed to their eventual downfall. However, the ownership of the SEGS plants was not affected by the status of Luz because the plants had been developed as independent power projects owned by investor groups, and all nine plants continue in daily operation today. However, changes in the ownership structure has occurred at several of the plants. Figure E.1 shows the five 30-MW SEGS plants at Kramer Junction, California. The large fields with rows of parabolic trough collectors are readily apparent. The five 30-MW power plants can be observed near the center of each solar field.
2 Lotker, M., (1991): Barriers to Commercialization of Large-Scale Solar Electricity: Lessons Learned from the Luz Experience,
Figure E.1: SEGS III–SEGS VII Solar Plants at Kramer Junction, California
Cost of the SEGS Plants
Detailed cost data are not available for the SEGS plants. This is partially because Luz did not actually track expenses against individual projects. However, information on the financed sales price of the SEGS plants is available3. The financed project cost (FPC) of each SEGS plant is shown in Figure E.2. It is important to note that these costs include not only the capital cost but also project development and financing costs, interest during construction, and debt reserve costs. For example, data from SEGS IX indicate that these other noncapital costs were 11% of the financed price. The FPC is shown in nominal dollars per kilowatt, which is the cost of the project the year it was built. The costs have been normalized to 2003 dollars using the Consumer Price Index. This shows what the cost per kilowatt for these plants would be in 2003 dollars. For example, SEGS I cost $4400/kWe in 1984, which corresponds to $7738/kWe in 2003 dollars.
Figure E.2: Financed Project Cost Data for SEGS Plants 0 1,000 2,000 3,000 4,000 5,000 6,000 7,000 8,000 9,000
I II III IV V VI VII VIII IX
SEG S Plant Financed Project Cost ($/kW e ) 2003$ Nominal
Trough Development after Luz
Since the demise of Luz, a number of events and R&D efforts have helped to resurrect interest in parabolic trough technology. In 1992, Solel Solar Systems Ltd. purchased Luz manufacturing assets in Israel, providing a source for the Luz collector technology and key collector components. In the same year, a 5-year R&D program, designed to explore opportunities to reduce operations and maintenance (O&M) costs, was initiated between the operator of the SEGS III through SEGS VII plants (KJC Operating Company) and Sandia National Laboratories (SNL)4. This program resulted in a number of incremental advances in the technology that helped to significantly reduce O&M costs at existing plants and increase annual power generation. In 1996, the Direct Solar Steam (DISS) project was initiated at the Plataforma Solar de Almería (PSA), a solar test facility in Spain, to test parabolic trough collectors that generate steam directly in the solar field5.
In 1998, an international workshop on parabolic trough technology led to the development of a parabolic trough technology roadmap6. The roadmap identified the technology development necessary to reduce the cost or improve the reliability and performance of parabolic trough technology. The U.S. DOE and others have subsequently used this roadmap to help guide
4 Cohen, G.; Kearney, D.; and Kolb, G., (1999): Final Report on the Operation and Maintenance Improvement Program for CSP
Plants, Report No. SAND99-1290, Sandia National Laboratories, Albuquerque, NM.
5 Zarza, E.L.; Valenzuela, J.L.; Weyers, H.D.; Eickhoff, M.; Eck, M.; and Hennecke, K. (2001): “The DISS Project: Direct Steam
Generation I Parabolic Trough Systems—Operation and Maintenance Experience—Update on Project Status,” Journal of Solar Energy Engineering (JSEE), submitted.
6 Price, H.; and Kearney, D. (1999): Parabolic-Trough Technology Roadmap: A Pathway for Sustained Commercial Development
renewed R&D investments in the technology. New technologies are currently being developed to enhance capabilities and reduce the cost of the next-generation trough plants. Developments focus on improved trough concentrator design, advances to the trough receiver, improved reflectors, development of thermal storage, and advances in power cycle integration.
renewed R&D investments in the technology. New technologies are currently being developed to enhance capabilities and reduce the cost of the next-generation trough plants. Developments focus on improved trough concentrator design, advances to the trough receiver, improved reflectors, development of thermal storage, and advances in power cycle integration.
Technology Technology
Parabolic Trough Power Plant Technology Parabolic Trough Power Plant Technology
The current state-of-the-art in parabolic trough plant design is an outgrowth of the Luz SEGS power-plant technology. Parabolic trough power plants consist of large fields of parabolic trough collectors, a heat-transfer fluid/steam generation system, a Rankine steam turbine/generator cycle, and thermal storage or fossil-fired backup systems (or both). These systems are illustrated schematically in Figure E.3.
The current state-of-the-art in parabolic trough plant design is an outgrowth of the Luz SEGS power-plant technology. Parabolic trough power plants consist of large fields of parabolic trough collectors, a heat-transfer fluid/steam generation system, a Rankine steam turbine/generator cycle, and thermal storage or fossil-fired backup systems (or both). These systems are illustrated schematically in Figure E.3.
Figure E.3: Schematic Flow Diagram of Parabolic Trough Plant Figure E.3: Schematic Flow Diagram of Parabolic Trough Plant
Hot Salt Tank
2-Tank Salt Storage
Solar Superheater Solar Field
Cold Salt Tank
Steam Generator Solar
Preheater Low PressurePreheater
Solar Reheater Expansion Vessel Deaerator Condenser Steam Turbine Boiler (optional) Fuel
Hot Salt Tank
2-Tank Salt Storage
Solar Superheater Solar Field
Cold Salt Tank
Steam Generator Solar
Preheater Low PressurePreheater
Solar Reheater Expansion Vessel Deaerator Condenser Steam Turbine Boiler (optional) Fuel Boiler (optional) Fuel
The technology can be described as follows. The solar field is modular in nature, and it comprises many parallel rows of solar collectors aligned on a north-south horizontal axis. The linear parabolic-shaped reflector in each solar collector focuses the sun’s direct beam radiation on the linear receiver at the focus of the parabola as seen in Figure E.4.
The technology can be described as follows. The solar field is modular in nature, and it comprises many parallel rows of solar collectors aligned on a north-south horizontal axis. The linear parabolic-shaped reflector in each solar collector focuses the sun’s direct beam radiation on the linear receiver at the focus of the parabola as seen in Figure E.4.
The collectors track the sun from east to west during the day to ensure that the sun is continuously focused on the linear receiver. A heat transfer fluid is heated to 391ºC as it circulates through the receiver and returns to a series of heat exchangers in the power block, where the fluid is used to generate high-pressure superheated steam (100 bar, 371ºC). The The collectors track the sun from east to west during the day to ensure that the sun is continuously focused on the linear receiver. A heat transfer fluid is heated to 391ºC as it circulates through the receiver and returns to a series of heat exchangers in the power block, where the fluid is used to generate high-pressure superheated steam (100 bar, 371ºC). The
superheated steam is then fed to a conventional reheat steam turbine/generator to produce electricity. The spent steam from the turbine is condensed in a standard condenser and returned to the heat exchangers via condensate and feedwater pumps to be transformed back into steam. Condenser cooling is provided by mechanical draft wet cooling towers. After passing through the HTF side of the solar heat exchangers, the cooled HTF is recirculated through the solar field.
Figure E.4: Parabolic Trough Collector (Source: PSA)
Figure E.5 is a view of the 30-MWe SEGS III solar field of parabolic trough solar collectors at Kramer Junction, California. The figure shows the large field with rows of parabolic trough collectors.
Figure E.5: SEGS III Solar Plants at Kramer Junction, California
Parabolic Trough Collector Technology
The solar field’s basic component is the solar collector assembly (SCA). Each SCA is an independently tracking group of parabolic trough solar collectors made up of parabolic reflectors (mirrors); the metal support structure; the receiver tubes; and the tracking system that includes the drive, sensors, and controls. The solar field in a parabolic trough power plant is made up of hundreds, and potentially thousands, of SCAs.
Table E.2: Luz Solar Collector Assembly (SCA) Characteristics
Collector Luz LS-1 Luz LS-2 Luz LS-3 EuroTrough ET-100/150 Solargenix DS-1 Year 1984 1988 1989 2004 2004 Area (m2) 128 235 545 545/817 470 Aperture (m) 2.5 5 5.7 5.7 5 Length (m) 50 48 99 100/150 100 Receiver Diameter (m) 0.042 0.07 0.07 0.07 0.07 Concentration Ratio 61:1 71:1 82:1 82:1 71:1 Optical Efficiency 0.734a 0.764a 0.8a 0.78b 0.78b Receiver Absorptivity 0.94 0.96 0.96 0.95 0.95
Mirror Reflectivity 0.94 0.94 0.94 0.94 0.94
Receiver Emittance 0.3 0.19 0.19 0.14 0.14
@ Temperature (ºC/ºF) 300/572 350/662 350/662 400/752 400/752
Operating Temp. (ºC/ºF) 307/585 391/735 391/735 391/735 391/735 Notes: (a) Luz specification, (b) Based on field measurements
Table E.2 shows the design characteristics of the three generations of Luz SCAs and two new designs currently under development. The general trend has been to build larger collectors with higher concentration ratios (collector aperture divided by receiver diameter) to maintain the collector thermal efficiency at higher fluid outlet temperatures.
The LS-3 collector was the last design produced by Luz. It was used primarily at the larger 80-MW plants. The LS-3 collector and its components can be described as follows. The LS-3 reflectors are made from hot-formed, mirrored glass panels, supported by the truss system that gives the SCA its structural integrity. The aperture or width of the parabolic reflectors is 5.76 m, and the overall SCA length is 95.2 m (net glass). The mirrors are made from a low-iron float glass with a transmissivity of 98%. The mirrors are silvered on the back and then covered with several protective coatings. The mirrors are heated on accurate parabolic molds in special ovens to obtain the parabolic shape. Ceramic pads used for mounting the mirrors to the collector structure are attached with a special adhesive. These high-quality mirrors allow 98% of the reflected rays to be incident on the linear receiver. The parabolic trough linear receiver, also referred to as a heat collection element (HCE), is one of the primary reasons for the high efficiency of the Luz parabolic trough collector design. The HCE consists of a 70-mm steel tube with a cermet selective surface, surrounded by an evacuated glass tube. The HCE incorporates glass-to-metal seals and metal bellows to achieve the vacuum-tight enclosure. The vacuum enclosure serves primarily to protect the selective surface and to reduce heat losses at high operating temperatures. The vacuum in the HCE is maintained at about 0.0001 mm Hg (0.013 Pa). The cermet coating is sputtered onto the steel tube to give it excellent selective heat transfer properties, with an absorptivity of 0.96 for direct beam solar radiation, and a design emissivity of 0.19 at 350ºC (662°F). The outer glass cylinder has an antireflective coating on both surfaces to reduce reflective losses off the glass tube. Getters, metallic substances that are designed to absorb gas molecules, are installed in the vacuum space to absorb hydrogen and other gases that permeate into the vacuum annulus over time.
The SCAs rotate around the horizontal north/south axis to track the sun as it moves through the sky during the day. The axis of rotation is at the collector center of mass to minimize the tracking power required. The drive system uses hydraulic rams to position the collector. A closed-loop tracking system relies on a sun sensor for the precise alignment required to focus the sun on the HCE during operation to within +/- 0.1 degree. The tracking is controlled by a local controller on each SCA. The local controller also monitors the HTF temperature and reports operational status, alarms, and diagnostics to the main solar field control computer in
km/h) and somewhat reduced accuracy in winds up to 35 mph (56 km/h). The SCAs are designed to withstand a maximum of 70 mph (113 km/h) winds in their stowed position (in which the collector is aimed 30º below the eastern horizon).
Operating Experience of the SEGS Plants
The SEGS plants offer a unique opportunity to examine the operational track record of large parabolic trough plants, Even though the 9 plants in the Mojave Desert of California with a cumulative capacity of 354 MWe were the first such plants built, they all remain operational (in 2004) and provide an excellent resource for performance and O&M data.
Operations and Maintenance (O&M) of Solar Power Plants
Parabolic trough solar power plants operate similar to other large Rankine steam power plants except that they harvest their thermal energy from a large array of solar collectors. The existing plants operate when the sun shines and shut down or run on fossil backup when the sun is not available. As a result the plants start-up and shutdown on a daily or even more frequent basis. Compared to a base load plant, this introduces additional difficult service requirements for both equipment and O&M crews. The solar field is operated whenever sufficient direct normal solar radiation is available to collect net positive power. This varies due to weather, time of day, and seasonal effects due to the cosine angle effect on solar collector performance; generally, the lower limit for direct normal radiation in the plane of the collector is about 300 W/m2. Since none of the plants currently have thermal storage7, the power plant must be available and ready to operate when sufficient solar radiation exists. The operators have become very adept at keeping the plant on-line at minimum load through cloud transients to minimize turbine starts, and at starting up the power plant efficiently from cold, warm or hot turbine status.
The O&M of a solar power plant is very similar to other steam power plants that cycle on a daily basis. The plants are staffed with operators 24 hours per day, using a minimal crew at night; and require typical staffing to maintain the power plant and the solar field. Although solar field maintenance requirements are unique in some respects, they utilize many of the same labor crafts as are typically present in conventional steam power plants (e.g., electricians, mechanics, welders). In addition, because the plants are off-line for a portion of each day, operations personnel can help support scheduled and preventive maintenance activities. A unique but straightforward aspect of maintaining solar power plants is the need for periodic cleaning of the solar field mirrors, at a frequency dictated by a tradeoff between performance gain and maintenance cost.
Early SEGS plants suffered from a large number of solar field component failures, power plant equipment not optimized for daily cyclic operation, and operation and maintenance crews inadequately trained for the unique O&M requirements of large solar power plants. Although the later plants and operating experience has resolved many of these issues, the O&M costs at the SEGS plants have been generally higher than Luz expectations. At the Kramer Junction site8, the KJC Operating Company’s O&M cost reduction study addressed many of the problems that were causing high O&M costs.
7 The SEGS I plant initially had 3-hours of thermal energy storage, but the system was damaged in a fire in 1999.
8 The SEGS plants are located at three different sites, with separate O&M companies: 44 MWe at Daggett, Calif., 150 MWe at Kramer
Key accomplishments included:
• Solving HTF pump seal failures resulting from daily thermal and operational cycling of the HTF pumps,
• Reducing HCE failures through improved operational practices and installation procedures,
• Improved mirror wash methods and equipment designed to minimize labor and water requirements and the development of improved reflectivity monitoring tools and procedures that allowed performance based optimization of mirror wash crews, and
• Development of a replacement for flex hoses that uses hard piping and ball joints; resulting in lower replacement costs, improved reliability, and lower pumping parasitics. Another significant focus of the study was the development of improved O&M practices and information systems for better optimization of O&M crews. In this area, important steps were:
• An update of the solar field supervisory control computer located in the control room that controls the collectors in the solar field to improve the functionality of the system for use by operations and maintenance crews,
• The implementation of off-the-shelf power plant computerized maintenance management software to track corrective, preventive, and predictive maintenance for the conventional power plant systems,
• The development of special solar field maintenance management software to handle the unique corrective, preventive, and predictive maintenance requirements of large fields of solar collectors,
• The development of special custom operator reporting software to allow improved tracking and reporting of plant operations and help optimize daily solar and fossil operation of the plants, and
• The development of detailed O&M procedures and training programs for unique solar field equipment and solar operations.
As a result of the KJC Operating Company O&M cost reduction study and other progress made at the SEGS plants, solar plant O&M practices have evolved steadily over the last decade. Cost effectiveness has been improved through better maintenance procedures and approaches, and costs have been reduced at the same time that performance has improved. O&M costs at the SEGS III-VII plants have reduced to about 25 USD/MWh. With larger plants and utilizing many of the lessons learned at the existing plants, expectations are that O&M costs can be reduced to below 10 USD/MWh at future plants.
Solar Plant Availability
Solar plants differ from conventional fossil and nuclear power plants in that they must harvest their fuel via the solar field. Thus the availability of the solar field becomes a key indicator of potential plant performance. Figure E.6 shows the average solar field availability for the five 30-MW SEGS plants at Kramer Junction from 1987 to 2003. Solar field availability refers to the percentage of the solar field that is available at any time to track the sun. The year 1987 was the first year of operation for the first two plants at Kramer Junction. The data displays a steady trend of improved solar field availability through the life of the plants. The drop in availability in 1991 and 1992 was caused primarily by the bankruptcy of Luz in the summer of 1991, which resulted in a change in plant ownerships and management
of the O&M company that effectively eliminated the supply of several key solar field spare parts. Now the availability is controlled by management decisions on the most cost-effective replacement strategy.
Figure E.6: Average Solar Field Availability for the Five SEGS Plants Located at Kramer Junction, CA (Source: KJC Operating Company)
95 96 97 98 99 100 1987 1989 1991 1993 1995 1997 1999 2001 2003
Solar Field Availability (%)
The SEGS power plants are conventional Rankine cycle steam power plants. For the most part, these plants have maintained good overall equipment availability. Although daily cycling of the plant results in a more severe service situation than base or intermittent load operation, daily nighttime outages allow some maintenance activities to be conducted while the plant is off-line, helping to maintain high availability during daytime solar hours. During normal day-to-day operation, it takes approximately 45 to 90 minutes to start up the plant, from initial tracking of the solar field to synchronization of the turbine generator. During the summer, the plant can be on-line in approximately 45 minutes. It takes up to twice as long in the winter because of the lower solar input to the plant. Once the plant is on line, the turbine can be ramped up to full load in a matter of minutes. Because of their design warm-up characteristics, the natural-gas-fired boilers take longer to bring on line than the solar field and solar heat exchangers. The natural-gas-fired boilers must be warmed up more slowly to minimize thermal stresses on the boiler drum.
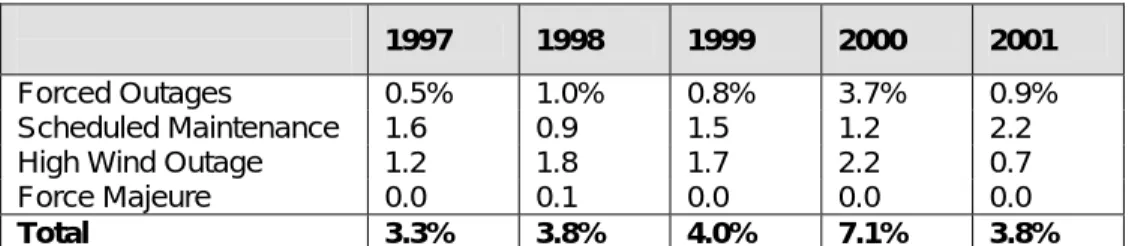
Since the total daily plant output varies significantly between the summer and winter seasons, the parabolic trough plants track the impact on availability as a function of lost solar generation. A full day outage in the winter may result in losing only 20% as much solar generation as would be lost by a full day outage in the middle of the summer. Thus, the plants schedule their annual maintenance outages during the November to February time frame when solar output is lowest. KJC Operating Company, the operator of the five 30-MWe trough plants at Kramer Junction, has maintained detailed scheduled and forced outage data9. These plants typically schedule an 8-day outage each year and an extended outage (5-8 weeks) about every 10 years. They track availability as a function of the impact on solar generation. Table E.3 shows forced and scheduled outages over a five-year period for these
five plants as a function of lost solar generation. The high forced outage rate during 2000 was due to problems with tube leaks on the solar steam generators. These problems were resolved and the forced outage rate was reduced again in 2001. The period shown below includes both routine annual and 10-year extended outages; specifically each year includes an 8-day outage at four of the plants and a 5-8 week outage at the fifth plant. High-wind outages occur when wind speeds exceed 35 mph and the solar field must be stowed to protect it from damage. Over this period the plants experienced a solar-output-weighted scheduled and forced outage rate of 4.4%. Without inclusion of the extended outages, the outage rate drops below 4%. This level of power plant availability is considered excellent for any power plant. The SEGS plants have a projected life of 30 years. The solar field and conventional steam cycle power equipment shows every sign of meeting and exceeding that lifetime.
Table E.3: Forced and Scheduled Outages for SEGS III-VII as a Function of Lost Solar Generation
1997 1998 1999 2000 2001
Forced Outages 0.5% 1.0% 0.8% 3.7% 0.9%
Scheduled Maintenance 1.6 0.9 1.5 1.2 2.2
High Wind Outage 1.2 1.8 1.7 2.2 0.7
Force Majeure 0.0 0.1 0.0 0.0 0.0
Total 3.3% 3.8% 4.0% 7.1% 3.8%
Solar Electric Generation
The best performance indicator of the SEGS plants is the gross solar-to-electric performance. Figure E.7 shows the annual and cumulative gross solar electric generation for the nine SEGS plants through the end of 200310. The increasing annual generation during the first 7 years shows the impact of new plants coming online. The dip in annual generation during 1992 was due to the Mount Pinatubo Volcano in the Philippines. The volcano erupted during the summer of 1991 and resulted in a noticeable reduction in direct normal solar radiation during 1992. Of significance is the sustained level of performance over the last 11 years. Cumulative solar generation from these plants should exceed 10 terawatt hours during 2004.
Figure E.7: Annual Gross Solar Generation for SEGS I-IX [7] 0 200 400 600 800 1,000 1985 1987 1989 1991 1993 1995 1997 1999 2001 2003 Year of Operation
Annual Gross Solar Generation
(GWh) 0 2 4 6 8 10
Cumulative Gross Solar
Generation (TWh)
Cumulative Generation
Annual Generation
On-Peak Electric Generation
The SEGS plants sell power to the local utility, Southern California Edison (SCE). As part of their contract with SCE, the SEGS plants are required to generate power at a specified level during the utility’s peak electric demand period.
Figure E.8 is a graphical representation of the different SCE time-of-use (TOU) periods during the year. The summer on-peak period has the highest demand for power. The shaded region in the figure shows the time during the day when parabolic trough plants normally operate. In general, parabolic trough plants are well suited for generating power during the SCE summer on-peak TOU period.
Figure E.8: Power Utility Time-of-Use and Solar Operation
Jan Feb Mar Apr May Jun Jul Aug Sep Oct Nov Dec Hour of Day 15 18 21 24 3 6 9 12 Super Off-Peak Super Off-Peak Off-Peak Off-Peak Winter Mid-Peak Winter Mid-Peak Summer Mid-Peak Summer Mid-Peak Summer On-Peak Solar Operation D aylight Savings
To help ensure that the SEGS plants can operate at full rated output during the summer on-peak period, the SEGS plants have the capability to use a backup fossil energy for periods when solar energy is not available.
Figure E.9 shows gross electric output for three days in 1999 from one of the 30-MW SEGS plants at Kramer Junction. Day 172 is the summer solstice (June 21), which is the longest solar day of the year. On day 172, the plant operated from solar input only and the plant was able to operate during the summer on-peak period from 12 noon to 6 pm averaging above rated capacity for the period (30 MW net or approximately 33 MW gross). Days 260 and 262 represent 2 days near the fall equinox in September. Day 262 was a weekend day, so the plant operated on solar input only. The figure shows that the plant was not able to maintain full rated output on solar energy alone during the 12 noon to 6 pm time frame. Day 260 is a weekday with solar output in the morning similar to that of day 262, but the backup natural gas fired boiler was used in the afternoon to supplement the solar input to allow the plant to operate at rated capacity during the afternoon on-peak period from noon to 6 pm. This figure clearly illustrates how the hybrid SEGS plants have been able to operate and provide power to the utility when it is needed most.
Figure E.9: Electric Output from 30-MW SEGS plant (Source: KJC)
-5 0 5 10 15 20 25 30 35 40 6 9 12 15 18 21 Time of Day
Net Output (MWe)
day 172 day 262 day 260
Figure E.10 shows the on-peak capacity factor for the five 30-MWe parabolic trough plants at Kramer Junction over the last 15 years. With the aid of the fossil backup, the plants have exceeded 100% of rated net capacity for every one of the last 15 years. The plants have averaged about 80% of rated capacity from solar energy alone with natural gas used to fill in to 100% capacity. Note that solar output was low in 1991 and 1992 as a result of the eruption of the Mount Pinatubo volcano.
Figure E.10: SEGS III-VII On-Peak Capacity for the Last 15 Years 0% 20% 40% 60% 80% 100% 120% 1989 1991 1993 1995 1997 1999 2001 2003
Summer On-Peak Capacity
Factor 0 2 4 6 8 10 12
Summer Direct Normal Radiation (kWh/m2-day)
Solar Natural Gas Solar Radiation
Trough Power Plant Performance Characteristics
Solar thermal electric power plants are designed to harvest available sunlight, either converting it to electricity immediately, or storing it for future use. The ability to store collected thermal energy is particularly important and can lead to a solar-only power plant with firm dispatching capability. Significant flexibility exists to design plants to provide specific energy services, that is, MWe capacity, ability to meet peak loads, and tailored annual energy production. Design tools have been developed that determine the proper collector field capacity, energy storage capacity, and turbine size to produce the required energy, given expected solar insolation and climatic conditions at each site. The evaluation is dominated by the variability of the solar resource. Some of the relevant data are totally predictable (such as when the sun will rise on a given day), but most of the information depends on historically valid weather data.
Correlation with SDG&E System Loads
SDG&E Seasonal Load Profile
Figure E.11 shows the peak SDG&E peak system load by month for 2002. The peak system load occurs in late summer/early fall, and the minimum occurs in the spring. The figure also shows the relative monthly solar output from a parabolic trough plant. There is not a strong seasonal correlation between the output of the solar plant and the peak system demand. Solar output peaks during June, and the SDG&E system load peaks in September.
Figure E.11 also reveals the substantial change in monthly output from winter to summer at a parabolic trough plant.
Figure E.11: Comparison of 2002 SDG&E Peak System Load and Monthly Output from Solar Plant 0 600 1,200 1,800 2,400 3,000 3,600 4,200
Jan Feb M ar Apr M ay Jun Jul Aug Sep Oct Nov Dec
S D G & E M a x im u m Sys tem Lo ad (M W ) 0% 2% 4% 6% 8% 10% 12% 14% So la r Pl an t O u tp ut (% of A n n u a l)
Solar Plant O utput System Load
Daily Load Profile
Figure E.12 shows the average SDG&E hourly system load for three months during 2002. The figure includes data for the months of December, May, and September. September shows the highest peak loads because of high afternoon air-conditioning use. January shows an evening peak because of evening lighting and electric heating loads. May is one of the lowest demand months because of the lack of high heating or cooling loads. The peak demand for power is about 30% higher in September than in April. All months clearly show increased demand for power during the day and into the evening. Solar plants are well suited to meet the daytime peak. With thermal storage, they are able to meet evening peak loads, as well.
Figure E.12: SDG&E Monthly Average System Load for 2002 0 500 1,000 1,500 2,000 2,500 3,000 3,500 1 2 3 4 5 6 7 8 9 10 11 12 13 14 15 16 17 18 19 20 21 22 23 24 Hour of Day SDG & E Sys tem L o a d ( M W ) May Sep Dec
Figure E.13 shows an overlay of modeled hourly solar output for a 100-MWe parabolic trough plant and the SCE system load (similar to the SDG&E load) for January and July using solar resource data from Kramer Junction. During the summer, the solar output will help reduce the peak load. But in January, the solar output does not help reduce the peak load and may in fact aggravate the dip between the morning and evening peaks. The addition of thermal storage or hybridization can help resolve this effect. Both thermal storage and hybridization provide opportunities for firm power from large-scale solar power plants.
Figure E.13: Overlays of SCE System Load and 100-MWe Trough Plant
2,000 4,000 6,000 8,000 10,000 12,000 14,000 16,000 18,000 0 4 8 12 16 20 24
Time of Day (Standard Time)
SC E A v e ra g e H o u rl y Sy s te m Lo a d ( M W e ) -20 0 20 40 60 80 100 120 140 Tr ou gh P lant O u tp ut (M W e )
SCE Jan Load SCE Jul Load
Hybridization
Hybridization means that the solar plant can also be operated by using some backup fuel, typically natural gas. All existing trough plants are hybrid plants. They either have a backup natural-gas-fired boiler that can generate steam to run the turbine, or they have an auxiliary natural-gas-fired heater for the solar field fluid that can be used to produce electricity. Sensible, cost-effective operation of a hybridized solar plant dictates that natural gas will be used periodically only to supplement electrical production. The fossil energy would likely be used only for economic dispatch during on-peak or mid-peak periods. The system heat rate is high, since the natural gas is being used in a conventional steam power plant instead of a combined cycle. Also, current plants are limited by their Federal Energy Regulatory Commission (FERC) “qualifying facility” status, which caps natural gas use to 25% of energy input to the plant.
Figure E.9 shows an example of how hybridization is used to support summer on-peak generation.
Figure E.14 shows an example of a hybrid parabolic trough plant operating on solar energy during a day in January and using fossil backup to generate power during the evening.
Figure E.14: Solar and Fossil Output from Hybrid Parabolic Tough Plant
Typical Winter Day of Operation (SEGS IV 1/05/98) 0 5 10 15 20 25 30 35 40 0:10 1:50 3:30 5:10 6:50 8:30 10:10 11:50 13:30 15:10 16:50 18:30 20:10 21:50 23:30 E le ctr ic O u tp u t - M W e
Thermal Energy Storage
Thermal energy storage (TES) allows solar energy to be collected when the sun is out, and then to be stored for use in the power plant at another time. TES can be used to dispatch solar power when it makes the most economic sense. Solar energy can be collected during the day and power dispatched to the grid at night. The SEGS I plant operated in this manner for 13 years to meet a winter on-peak TOU period (5-9 pm). TES can also be used to increase the annual capacity factor of the plant. A solar plant without TES is limited to an annual capacity
factor of 20% to 30%. By adding thermal storage, we can oversize the solar field so that more energy is collected during the day than can be used by the steam turbine. The excess energy is then stored for use at night. If desired and if warranted by projected revenues, solar plants with TES can be designed to achieve annual capacity factors greater than 60% for parabolic troughs, and greater than 70% for power towers.
Resource Intermittency
Solar power is often considered to be an intermittent power resource similar to wind power. While this characterization is true to a point, the solar resource is much more predictable and reliable than a typical wind resource. That is, we know when the sun will rise and set, though of course we don’t always know whether it will be cloudy or hazy. In excellent solar locations like the Mojave Desert where the SEGS plants are located, cloudy weather only reduces solar output significantly (>50%) on 14% of the days of the year (based on an analysis of a 30-year National Solar Radiation Data Base (NSRDB) data set from Barstow, California). In addition, reasonably good forecasts of the solar resource and resulting power generation can be made 24 hours in advance. When the solar resource forecast is uncertain (for example, when a storm front is moving through), this is usually known as well. The operators at the SEGS facilities have become good solar resource forecasters. They often schedule maintenance outages for times when extended days of cloudy weather are expected.
Solar Supply Consortium
This section discusses current solar supply consortia and suppliers of key parabolic trough solar components.
Developers
At present, several companies are prepared to offer trough solar steam systems for U.S. domestic and international projects. The companies on the list below are either actively involved in large-scale plant development or are tied to major component suppliers of trough technology. All have ties through equipment and expertise to the SEGS plants, to varying degrees. SolarGenix and Solar Millennium are developing advanced collector designs, partially with development funding from the U.S. Department of Energy and the European Union, respectively. Solel was formed after the demise of Luz, and the company obtained manufacturing facilities and technology data and documentation that had been part of Luz Industries Israel. SolarGenix, Solar Millenium, and Solel all have responded to GEF bids for international projects. Key factors in providing credible bids on projects include having technology rights to solar field design and being able to provide adequate warranties for solar system performance. FPL Energy recently purchased SEGS III-VII at Kramer Junction. FPL Energy is also interested in becoming a developer of trough plants.
Key Solar Component Suppliers
The reflective panels, or mirrors, and receivers are the unique components of a trough solar system. The German company Flabeg supplied the original mirrors to all the SEGS plants at the time of construction, has continued to supply spare parts to the plants as requested, and is ready to supply mirrors to new plants. The quality of the mirrors is excellent, and there have been some advances in the design of the mirror attachments and coatings during the last decade.
The receivers, termed heat collection elements, or HCE’s, by Luz, are the most unique component. Solel acquired the HCE manufacturing facilities from Luz and has continued to supply that component for spare parts. Important advances have been achieved in performance, as discussed elsewhere in this report. Recently, the experienced and respected German company Schott Glass has announced active development of a new receiver for trough technology, similar to the Luz/Solel design but with important advanced features. Schott has begun prototype testing at the Kramer Junction site.
The power plant can be provided by most steam turbine vendors.
CSP Resource Potential for San Diego Region
NREL GIS Screening Analysis
NREL performed a screening analysis to look for regions with the best potential for siting of large CSP plants in the southwestern United States. The screening analysis was performed using geographic information systems (GIS) to identify areas with high potential for CSP development. The GIS analysis evaluated the following factors to determine siting potential: direct normal solar resource level, land slope, environmental sensitivity, and contiguous area. Parabolic trough solar power plants require high direct normal insolation (DNI), or beam radiation, for cost-effective operation; the required size of the solar field for a given power plant capacity is in general directly proportional to the DNI level. The new Perez satellite derived solar resource data was used to identify the level of direct normal solar resource11. In general, a parabolic trough solar power plant in a good solar resource region requires approximately 5 acres (20,000 m2) per MW of plant capacity. Plants with thermal storage and higher capacity factors will require proportionally more land per MWe. Siting studies have generally found that land with an overall slope of less than 1% are the most economic to develop to minimize grading costs. The siting analysis looked for land with a slope of less than 1%.
The federal government owns the majority of the land in desert areas having a high solar resource. Some of these land areas are incompatible with development, because they are in national parks, national preserves, wilderness areas, wildlife refuges, water, or urban areas. A federal land classification dataset produced by the U.S. Geological Survey (USGS) was used to identify areas that should be eliminated from the analysis because of this incompatibility. Urban areas and water features were identified using a USGS global land cover/land classification dataset and other publicly available data sources. In general, Bureau of Land Management (BLM), National Forrest Service, and Department of Defense lands were assumed to be acceptable for purposes of this screening study.
11 Perez, R.; Ineichen, R.; Moore, K.; Kmiecik, M.; Chain, C.; George, R.; Voignola, F. (2002): “A New Operational
After the solar resource level, percent slope, and compatibility have been accounted for, an area must be at least 8 km2 in size. This area would be sufficient for the development of a 400-MW plant. Some developable areas may have been excluded in the analysis because of small gaps that caused the areas to appear discontinuous.
Maps were generated that show regions that meet the criteria listed above. High voltage transmission lines, substations, and other power plants are overlaid to help identify regions that might represent good solar sites. NREL used the PowerMap (©Platts 2002) dataset to determine the location of the high voltage transmission lines (115kV and higher) and existing power plants. A DNI value of 6.75 kWh/m 2/day of average annual solar irradiance was the minimum DNI level considered. Figure D.15 shows the final results of the map generated for the southwest. Although it appears that most of the high resource regions have been eliminated, a substantial resource potential remains. Table E.4 lists the area and the approximate solar capacity that could be generated for the southwestern states. Note that the resource potential represents a huge amount of solar capacity, many times the current US total electric capacity. However, one will also note that much of the identified lands (Imperial Valley, CA for example) are agricultural lands that are currently in use. It is also important to note the potentially huge resource potential in Northern Mexico. Although some resource potential exists in San Diego County, most of this appears to be in a valley surrounded by mountains. Imperial Valley probably represents the preferred location.
Table E.4: Solar Siting Analysis Results – (Solar Resource > 6.75 kWh/m2-day) State Area (km2) Approximate Solar Capacity (GW) Arizona 49,900 2,500 California - San Diego - Imperial 17,700 130 5,800 885 6 290 Colorado 5,500 275 Nevada 14,500 725 New Mexico 39,300 1,965 Utah 3,000 150 Total 129,900 6,500
Economics of Central Station Solar
This section looks at the economics of central station parabolic trough solar power plants.
Trough Plant Configurations
There are a number of parabolic trough plant configurations that might be considered for near-term applications. These include the following:
Solar Only: These plants can operate only with solar energy. They have no backup fossil ring capabilities or thermal energy storage. The 50-MWe trough plant under development
SolarGenix in Nevada is a solar-only plant.
So
-fired boilers or HTF heaters allow t ent solar generation or when solar energy is not available. The ying facilities under PURPA, and they are allowed to use up to 25% natural gas input to the plant. However, given eat rate of lants operating on natural gas, it is unlikely that in the future a h w l g other that on-peak or emergency generati
Thermal Energy : The first lant includ hours of thermal energy storage that allowed th patch s put to mee CE summer and winter peak periods (the original contract had a winter peak from m). Until recently, no TES technology existed for parabolic trough plants that operate at 735oF. A new TES option has been developed based on the molte rmal ener age system used at the Solar wo demonstration project. This system uses a conventional HTF in the solar field and has a eat exchanger that is used to charge and discharge the molten-salt storage system. The two er development by Solar Millennium in Spain will
le System: The ISCCS configuration (Figure E.16) integrates f increasing the bottoming cycle is less fi
by
lar/Hybrid: Eight of the nine existing SEGS plants are hybrid plants. Their natural-gas hem to operate with fossil energy to augm
SEGS plants are qualif the high h
ybrid trough plant on.
steam p
ould burn natura as for anything
Storage SEGS p ed 3
e plant to dis olar out t the S 5 to 9 p n-salt the gy stor T
h
50-MWe trough plants currently und include 6 to 9 hours of molten-salt TES.
Integrated Solar Combined Cyc
a trough solar plant into the bottoming cycle of a combined-cycle plant. The primary advantage of the ISCCS is that the incremental cost o
an the cost of a stand-alone steam power plant. The disadvantage of the ISCCS is the added
t from the gas turbine for preheating and uperheating the steam. This typically increases the bottoming cycle efficiency.
owever, a number of combined cycle plants have been built with xcess steam turbine capacity for use with duct burning. The duct burning capacity of these
tion, high-pressure steam is roduced directly in the solar field. This eliminates the need for the HTF system and allows
peratures than those possible with current heat transfer fluids. This concept has
bee al
deployment at this time.
Trough Organic Rankine Cycle (ORC) Plants: This configuration integrates a trough solar field with a binary organic Rankine cycle power plant optimized for solar operating temperatures. Arizona Public Service has contracted with SolarGenix to build a 1-MW th
complexity of integrating the solar and gas. In the most aggressive case, the steam turbine output is doubled when solar energy is available. The ISCCS allows solar energy to be used to generate steam and to use the waste hea
s
Unfortunately, when solar energy is not available, the bottoming cycle will run at part load, impacting the gas mode efficiency. ISCCS plants typically have very low solar contributions, on the order of 1% to 15% of annual output for a baseload combined-cycle plant. No ISCCS plants have been built. ISCCS plants are currently planned for all four of the GEF projects in India, Egypt, Morocco, and Mexico and for a plant under consideration in Algeria. We believe ISCCS plants are a niche opportunity and it is unlikely that a new ISCCS plant would be built in California. H
e
plants could potentially be repowered with a trough solar field.
Figure E.16: Process Flow Diagram for Integrated Solar Combined Cycle System (ISCCS)
Direct Steam Generation (DSG) Plants: In this configura p
higher tem
ough ORC plant. Other trough ORC plants that have been proposed range in size from 100 kWe to 5 MWe. This configuration is not being considered in this study, but some benefits may accrue as a result of these developments, because these plants are intended to be fully automated with no dedicated operations crews. Also, dry cooling and hybrid wet/dry cooling technologies are being evaluated for these systems.
Plant Technology Assumptions
This section considers two time frames for building parabolic trough power plants. It begins by looking at designs that might be used immediately for new parabolic trough power plants and then at those that might be built in the five-year time frame, based on technologies that are currently under development.
Near-Term Plants
The technologies and designs assumed in the near term must have previously been demonstrated or otherwise considered ready for commercial application. These plants could begin being constructed and be on line by 2007 to 2008. For the economic assessment, we will consider three potential near-term parabolic trough plant configurations: solar only, hybrid, thermal storage, and repowering of duct burner capacity of a combined cycle plant.
In the past, trough plants were limited in size to 30 MWe by PURPA regulations for
trough plants. For purpose of this study, we assume a plant size of 100 MWe as the baseline system size. The 200 MWe size is clearly feasible, the main
one deployed at the SEGS plants, its operation and performance characteristics were not as good as the smaller Luz LS-2 y of scale with collectors, so within some limit (determined
designs that attempt to improve on the Luz collectors, based on operating experience from SEGS. The SolarGenix collector is currently being tested at their test facility Boulder City, Nevada. The EuroTrough collector is being test
tr
qualifying facilities. Later, this limit was raised to 80 MWe and eventually eliminated completely. The optimum size for a trough plant was thought to be somewhere between 120 and 200 MWe by Luz. Changes in the solar field piping by eliminating flex hoses and replacing them with ball joints have significantly reduced the pumping parasitics for new
concern is assuring the existing supply of mirrors and receivers is sufficient to build a plant of that size. There is a significant economy of scale in the larger power plant size and in the O&M crew. Larger turbine generators are cheaper on a per-kilowatt basis. Another advantage to larger sizes is that US supply of the turbine becomes possible. Smaller turbines are likely to require being imported. Current currency exchange rates make purchasing a turbine from Europe relatively expensive.
Although the Luz LS-3 collector was the last collector. There is an econom
by wind loads), larger collectors are expected to be cheaper. Currently, at least four different collectors that we know of are being proposed for future trough projects. For our analysis, we use the SolarGenix collector as our baseline plant assumption. This and the EuroTrough are new collector
ed at the SEGS V plant at Kramer Junction.
Advances continue to be made in parabolic trough receiver technology. There are currently two suppliers of the receiver, Solel Solar Systems of Israel, and Schott Glass of Germany. Both receiver designs show a significant performance
ts. Both receivers have demonstrated improved ceiver reliability.
Future
The fut nologies
at are currently under development. We assume that these technologies will be built starting app plan assu that des the con con emi We con years. W fluid in coating 450oC. Design This se to dete depend
would b with the lowest capital
cost is n
Modeli
Solar p
plant’ ance on at least an hourly basis to understand what the annual performance ill be. NREL has developed a proprietary model for conducting annual performance
ion studies reproduce output from the SEGS plants within a few in Albuquerque, and the SEGS plan
re
We assume the same manufacturer for mirrors (Flabeg of Germany) as the one that provided mirrors for the SEGS plants. The mirrors have not been a significant issue. Future plants are assumed to use glass or alternative mirrors.
A near-term thermal energy storage technology is currently planned for use in the 50-MWe trough plants under development in Spain. This type of thermal storage is one of the technologies currently under consideration for application in near-term projects.
Technology
ure technology cases show the potential impact on the cost of energy for tech th
roximately five years from now and would be on line starting in 2012. These future power t configurations are assumed to be a solar only or solar with thermal storage. They are med to be 100 to 200 MWe in size (although larger sizes may be possible). We assume the parabolic trough collector technology will be similar to today’s systems but with ign improvements to reduce costs. Key among the changes will be increasing the length of collector to 150 m. The EuroTrough collector is already this size. Also, we expect tinued improvements in receiver technology as current receiver vendors and others are tinuing to work on improving the selective coating. We consider a selective coating with ssivity of 0.07 at 400oC.
sider that new, cheaper thermal storage technologies are likely to be available in 5 e assume a low-melting-point molten salt (Hitec XL) is used as the heat transfer the solar field and thermal energy storage media. This and an improved selective for the receiver will allow the solar field operating temperature to be increased to This improves steam cycle efficiency and reduces HTF pumping parasitics.
ptimization O
ction analyzes a range of parabolic trough solar field and thermal storage system sizes rmine the optimum configurations for near-term and future plants. Note that, ing on the specific figure of merit used to assess the results, different configurations
e selected as the optimum design. For example, the system ot the system with the lowest levelized cost of energy.
ng Parabolic Trough Performance and Economics
lants rely on an intermittent fuel supply—the sun. Therefore, it is necessary to model s perform
a w
calculations. Validat
percentage points on an annual basis. One advantage of the NREL trough model is that capital cost, O&M costs, and financial calculations have been added directly to the spreadsheet. This allows the plant design configurations to be more easily optimized. To compare various technology options, NREL uses a real levelized cost of energy in current-year dollars. This allows clear comparisons of current and future technologies and
e solar field delivers exactly the amount of energy required
thermal torage. However, the solar multiple is a useful metric for evaluating the performance and
ith a range of solar field sizes. The design point conditions used for
f solar multiples from 1.0– .5 were used in a parametric analysis to find the optimum plant configurations.
technologies that might not have the same lifetimes. One of the benefits of this metric is that it accounts for the financing structure and cost.
Solar Multiple and Design Point
The solar multiple is the ratio of the solar energy collected at the design point to the amount of solar energy required to generate the rated turbine gross power. A solar
ultiple of 1.0 means that th m
to run the plant at its design output at the design point solar conditions. A larger solar multiple indicates a larger solar system. The design point is the reference set of conditions selected for designing the system. Solar multiples are commonly used when designing power towers, but have not typically been used when designing the Luz trough plants likely because, with the exception of SEGS I, the plants did not have
s
economics of plants w
parabolic trough systems are listed in Table E.5. They were chosen to represent a high, but not the peak, value of solar collection during a year. The design point is calculated for an incidence angle of zero degrees, which means that the sun is normal to the collector aperture. The wind speed of 5 m/s is typical of normal day time conditions in the Mojave desert. For purposes of this assessment a range o
3
Table E.5: Design Point Conditions for Parabolic Trough
Metric Value
Cos θ 0
Amb. Temp. 25 C
DNI 1000 W/m2
Wind 5 m/s
Solar Field Configurations
Based on the design point conditions in the sections above, solar fields with solar multiples of 3.5 were evaluated. Table E.6 below shows the solar field 1.0, 1.2, 1.5, 1.8, 2.1, 2.5, 3.0, and
size for each solar multiple. As mentioned above, the solar multiple has not typically been used at the existing SEGS plants. The reference conditions are somewhat arbitrary, but allow a convenient method to evaluate different solar field sizes. As a point of reference, the SEGS plants have a solar multiples of about 1.1 to 1.2 based on the existing collector performance.
Table E.6: Trough Solar Field Configurations Solar Area Multiple m2 1.0 455,224 1.2 549,279 1.5 684,717 1.8 820,156 2.1 959,356 2.5 1,139,941 3.0 1,365,672 3.5 1,595,165 lant Optimization
he annual capacity factor, the on-peak capacity factor, and the
Figure E.17: Annual Capacity Factor for Near-term Parabolic Trough Plan as a Function of Solar Field Size and Size of Thermal Energy Storage
P
The following figures show t
levelized cost of energy for parabolic trough plants with different solar multiples (solar field sizes) and quantities of thermal storage.
From Figure E.17 it can be seen that parabolic trough plants can be designed to have annual capacity factors from 20% to over 60% in good solar resource regions.
0.00 0.10 0.20 0.30 0.40 0.50 0.60 0.70 0 3 6 9 12 15 18
T h ermal En ergy Storage (Hou rs)
A n nual C a p aci ty F act or 1.0 1.2 1.5 1.8 2.1 2.5 3.0 3.5 Solar Field Solar M ultiple
Plant: 100 MW e Parabolic Trough Plant
Solar Resource: 7.2 kW h/m2/day
Figure E.18 shows ho sizes and amounts of thermal storage perform during the SCE summer on-peak time of use period. Trough plants without thermal energy storage an ar e of 1.1 would be expected to achieve about 80% on-peak capacity from e
However, by adding thermal stora r incre solar field size, the annual on-peak capacity factor can be increased to 100% from gy alone.
Figure E.18: On-Peak Capacity or as of Solar Field Size and Thermal rage
w parabolic trough plants with various solar field d a sol multipl
solar en rgy. This is what the SEGS plants report in. ge o asing the
solar ener
Fact a Function Sto Capacity
SCE Summer On-Peak Capacity Factor
0.50 0.60 1.10 0.70 a k C 0.80 0 3 6 9 12 15 18 T ES (Hou rs) O n -P e a pa ct 1.00 or 0.90 ci ty Fa 1.0 1.2 1.5 1.8 2.1 2.5 3.0 3.5 Solar Field Solar M ultiple
Plant: 100 MW e P arabolic Trough Plant S olar Resource: 7.2 kW h/m2/day
(Imperial Valley, CA)
Figure E.19 shows the real levelized cost of energy in 2004 dollars for near-term parabolic trough plants with different sizes of solar field and amounts of thermal storage. From the figure the minimum cost of energy from a plant with no thermal energy storage occurs with a solar multiple of about 1.5. The lowest cost of energy for a plant with thermal storage occurs with 12 hours of thermal energy storage and a solar multiple of about 2.5. However, the minimum cost of energy does not vary much for plants with 6 to 12 hours of thermal energy storage. Because the storage technology is relatively untested, we have selected a system with 6 hours of thermal energy storage and a solar multiple of 2.0 for our near-term plant with thermal energy storage. Future plants with thermal storage are assumed to have 12 hours of storage and a solar multiple of 2.5.
![Figure E.7: Annual Gross Solar Generation for SEGS I-IX [7] 02004006008001,000 1985 1987 1989 1991 1993 1995 1997 1999 2001 2003 Year of Operation](https://thumb-us.123doks.com/thumbv2/123dok_us/1768855.2751432/15.918.261.675.182.425/figure-annual-gross-solar-generation-segs-year-operation.webp)