Economic Development Impacts of High-speed rail
David Levinson
∗May 27, 2010
1
Introduction
High-speed rail lines have been built and proposed in numerous countries throughout the world. The advantages of such lines are a higher quality of service than competing modes (air, bus, auto, conventional rail), potentially faster point-to-point times depending on specific locations, faster loading and unloading times, higher safety than some modes, and lower labor costs. The disad-vantage primarily lies in higher fixed costs, potentially higher energy costs than some competing modes, and higher noise externalities. Whether the net benefits outweigh the net costs is an em-pirical question that awaits determination based on location specific factors, project costs, local demand, and network effects (depending on what else in the network exists). The optimal network design problem is hard (in the mathematical sense of hard, meaning optimal solutions are hard to find because of the combinatorics of the possible different network configurations), so heuristics and human judgment are used to design networks.
The network architecture of high-speed rail lines has tended to be in a hub-and-spoke pattern, connecting a hub city (e.g. Paris, Madrid, Tokyo) to secondary cities in tree-like architecture, with occasional crossing links, typically at both lower speed, lower frequency, and lower cost of construction. As these systems were designed nationally, and the largest city is often the capital (as in Paris, Madrid, and Tokyo), which is also (roughly) centrally located, it is no surprise that the hub was based where it was. Germany has fewer very high speed links (faster than 300 km/h), and a flatter (less-hubbed) network, perhaps reflecting its strong federalism, relative decentralization into a multi-polar urban structure and late formation into a nation-state. Italy has centered its hub in Milan, the largest metropolitan area in the country. Maps of International HSR systems are shown in1.
The reason for the hub-and-spoke architecture is to achieve economies of density in track usage and network effects at the hub city which enable frequent service to multiple destinations. Multiple paths between origins and destinations would diffuse the network effects and result in less frequent
∗RP Braun-CTS Chair of Transportation Engineering; Director of Network, Economics, and Urban Systems
Re-search Group; University of Minnesota, Department of Civil Engineering, 500 Pillsbury Drive SE, Minneapolis, MN
55455 USA, Email: dlevinson@umn.edu, web:http://nexus.umn.eduTel: 01-612-625-6354
service, and therefore reduce demand. The hub-and-spoke architecture, while benefitting the net-work as a whole when demand is insufficient to enable frequent point-to-point service, clearly benefit the hub cities the most, as they gain from all the incoming flows which create additional demand, and thus greater service. In air transportation, airlines often use hub-and-spoke networks, and if they have a large market share at a hub airport, will use that advantage to charge a premium for travel, thereby capturing some, if not all, of the benefits of being located in a hub airport city.
2
Hubs and spokes
“The spatial impacts of the new lines will be complex. They will favour the large central cities they connect, especially their urban cores, and this may threaten the position of more peripheral cities.” (Hall,2009)
“[T]he wider economic benefits of high-speed rail are difficult to detect, as they are swamped by external factors”, but are likely to be larger in more central locations than more peripheral locations.”(Preston and Wall,2008)
As used here, a hub is a center of activity, from which multiple (at least three) spokes(links connecting the hub with other locations) emanate. On a network with a tree structure, the primary hub is the point from which the maximum number of spokes emerge. There may be secondary and tertiary hubs on the network as well.
The proposed US system (2) , such as it is, has no well-thought out national architecture. There were a number of independent proposals that have been drawn on a single map.
• The existing Northeast corridor, the only US claim to HSR, such as it is, is part of the national “plan”, though it received the least funding from the American Recovery and Reinvestment Act of 2009 (see the top right on2) . The Northeast has the most developed network with semi-high-speed rail (Acela) running from Boston through New York to Philadelphia, Balti-more, and Washington. This could be described as aNew York Hub(though it has not been pitched as such), with current non-high speed lines from New York emanating in particular to Albany and then to Rochester and Buffalo or to Montreal, and spurs from New Haven to Burlington, from Philadelphia to Harrisburg and Pittsburgh, from Washington south to Richmond and Raleigh, and from Boston to Portland and Brunswick, Maine, all of which have been proposed for upgrade to high speed.
• The proposed California Corridor, is based on a mainline that runs from San Francisco, through California’s Central Valley to Los Angeles, with extensions to Sacramento and San Diego. The long-term vision of the national program has a line from Las Vegas to Los Angeles. With all of the commuter rail already in the Los Angeles region, the network could more accurately be described as the Los Angeles Hub. Even the Sacramento line is more oriented to Los Angeles than San Francisco, despite the distance.
Figure 1:International High-speed rail Maps
Upper left: Europe’s High-speed rail network a; Lower left: Japan’s Shinkansen b; Lower right: China’s High-speed rail networkc.
aSource: Wikipedia http://en.wikipedia.org/wiki/File:High_Speed_Railroad_Map_Europe_2009.gif Accessed
April 20, 2010
bSource: Wikipediahttp://en.wikipedia.org/wiki/File:Shinkansenmap.pngAccessed April 20, 2010
cSource: Wikipediahttp://en.wikipedia.org/wiki/File:China_Railway_High-Speed_.pngAccessed April 20, 2010
• The most coherent of the new proposals is theChicago Hub, which as its name suggests, hubs traffic from other Midwestern cities into Chicago. This proposal has achieved agreement from all of the regional governors, and with a Chicago-based administration in the White House, not surprisingly received a large share of the recent federal allocations ($2.6 Billion). • The proposed Florida High-speed rail system runs from Miami though West Broward, West Palm Beach, to Orlando, Lakeland, terminating in Tampa with about 10 stations planned. Proposed additional extensions connecting Fort Myers, Jacksonville, and Tallahassee and Pensacola have also been drawn on maps, but these are farther into the future. This could be described as anOrlando Hub. Though Miami is a larger metropolitan area than Orlando, the branching structure is naturally geographically based in Orlando due to it centrality on the Florida peninsula, as well as it central location vis-a-vis tourist traffic. Tourist traffic is im-portant to this line, as stops at Disney and Port Canaveral have been included. It is anticipated the line will carry 2 million travelers yearly ( 5500 per day on 12-18 round trips), and is 324 miles in length in total. With 10 stations, there is an average of 32 miles between stations, which will bear nuisance costs, and 10 station areas, which will see accessibility benefits. The line is anticipated to run along the I-4 and I-95 corridors for significant stretches, so those areas already see some accessibility benefits (at on-ramps and off-ramps) and nuisance costs (between interchanges).
• The Northwest region, orSeattle Hubconnects Vancouver, Canada with Salem, Oregon. • The South-Central region, once dubbed the Texas Triangle, and now the Texas T-Bone, may
be described as a Dallas Hub, connecting San Antonio, Austin, Houston, New Orleans, Oklahoma City, Little Rock, and Memphis, among others.
• The Southeast region is probably best described as an Atlanta Hub, as Atlanta is the key interchange in the region (hubbing traffic from Savannah, Jacksonville, Birmingham, Chat-tanooga, Nashville, Charlotte, and Raleigh), and the largest metropolitan area. There is also a line from Raleigh through Columbia to Savannah, bypassing Atlanta, which is helpful for long-distance train travelers from the Northeast going to Florida, but might not have much local demand.
• The Gulf Coast Corridor, or New Orleans Hub connects Houston to Mobile and Atlanta. This is an official FRA corridor, but seems on a slower track than many of the others, not receiving funding in the most recent round.
• The long term program includes a line from Phoenix to Tucson (aPhoenix Hub), and from Denver to El Paso (a Denver Hub), but these are both isolated corridors, indicated on the long-term vision, without any likelihood for construction in the short-term. Describing these as hubs stretches the meaning of the term, but those are the primary cities on the respective networks, and are the only cities on their networks with significant feeder public transit. While these local spokes do not show on the national high-speed rail network, they still exist, and support the use of the term for these locales.
Several cities tie together multiple hub networks, these include New Orleans (connecting the Dallas and Atlanta networks as the hub of the Gulf Coast Corridor), Raleigh (connecting the At-lanta and New York networks), Louisville (connecting the Chicago and AtAt-lanta networks), and Kansas City (connecting the Dallas and Chicago networks). Those with an eye to drawing net-works would easily conceive of links (not yet on the books) connecting Memphis, Nashville, and Knoxville in Tennessee, or Pittsburgh and Cleveland or Columbus. The unofficial US High-speed rail Association has the most comprehensive network plans, including staging, which includes many of these and other links, see the bottom left on2.
These hub networks in the Federal High-Speed Intercity Passenger Rail Program includes the top 47 metropolitan areas of the United States (and many smaller ones), the largest city not on the network is Salt Lake City, Utah, at 48, with just over 1 million people in the metro area1. The Hubs
themselves are metro areas ranked 1, 2, 3, 4, 9, 15, and 27.2 The US High-speed rail Association
network includes even more cities.
The political genius of the proposed intercity passenger proposal is that it includes lines in all but 8 of the 50 states3. This is a practice learned in transportation from previous national packages,
the Interstate Highway System (with miles in all 50 states (special routes in Alaska and Hawaii), as shown in the bottom right of2) and Amtrak (nearly so), helping ensure strong support in Congress.
3
Conceptual model of accessibility
Accessibility measures the ease of reaching destinations. The higher the travel cost the lower the accessibility. It also measures the value of destinations, the more activities at the destination, the more valuable it is.
Accessibility does two things, first it increases total wealth. Agglomeration economies caused by new infrastructure make aggregate output larger. But second, it redistributes wealth, as the locations where the accessibility gains are larger gain more of that aggregate wealth. Places which do not increase accessibility at least as much as average may find themselves losing economic opportunities which will relocate to take advantage of the accessibility benefits.
The reason for describing the hub networks in the previous section in a paper on economic de-velopment is that the hubs, because of their respective positions, will capture accessibility benefits disproportionate to their already relatively large share of the population. First order beneficiaries are New York, Chicago, Los Angeles, Seattle, and Orlando, as they will be hubs of the new HSR networks. Places where the network branches will also see some benefits, but not as great. Sec-ond order beneficiaries are Atlanta and Dallas, which are hubs of the next generation networks. Third order beneficiaries are cities like New Orleans, Kansas City, Louisville and Raleigh which tie together multiple hub networks. Other cities on the networks will also see absolute accessibility
1The next largest city not on the network is Honolulu, Hawaii, at 55)
2New York (1), Los Angeles (2), Chicago (3), Dallas (4), Atlanta (9), Phoenix (12), Denver (21), and Orlando (27)
http://en.wikipedia.org/wiki/Table_of_United_States_Metropolitan_Statistical_Areas.
3Alaska, Hawaii, Idaho, Utah, Wyoming, North Dakota, and South Dakota are excluded from the Intercity
Pas-senger Rail Program. However North Dakota and South Dakota have been included in the Minnesota State plan (connecting to Sioux Falls and Fargo).
Figure 2: United States National High-speed rail Maps
Northern New England
Southeast Florida NEC Keystone Empire South Central Pacific Northwest Chicago Hub Network California Gulf Coast Designated High-speed Rail Corridor
KEY
Northeast Corridor (NEC) Other Passenger Rail Routes
(Alaska Railroad (Seward to Fairbanks/Eielson) not shown.)
Upper left: Federal Railroad Administration High-Speed Rail Corridor Designations a.; Upper right: US DOT High-Speed Intercity Passenger Rail Program as funded by the American Rein-vestment and Recovery Act of 2009b;
Middle left: US DOT High-Speed Intercity Passenger Rail Visionc; Middle right: US High-speed rail Association Staging Pland
Bottom left: US Public Interest Research Groupe; Bottom Right: Interstate Highway Systemf.
aSource:US Federal Railway Administrationhttp://www.fra.dot.gov/downloads/Research/hsr_corridors_2009_LV.
pdfAccessed April 20, 2010
bSource: AASHTO High-speed rail http://www.highspeed-rail.org/PublishingImages/Recipient_map012810.jpg
Accessed April 20, 2010
cSource: US Federal Railway Administration http://www.fra.dot.gov/downloads/Research/hsrmap-lv.pdf
Ac-cessed April 20, 2010
dSource: US High-speed rail Association http://www.ushsr.com/images/810_US_HSR_Phasing_Map.gif
Ac-cessed April 20, 2010
eSource:http://www.uspirg.org/home/reports/report-archives/transportation/transportation2/
the-right-track-building-a-21st-century-high-speed-rail-system-for-america?id4=HPAccessed April 20, 2010
fSource: Wikipediahttp://en.wikipedia.org/wiki/File:Map_of_current_Interstates.svgAccessed April 20, 2010
Figure 3:United States Regional High-speed rail Maps
Upper left: Florida (Orlando Hub)a; Upper right: California (Los Angeles Hub)b; Lower left: Midwest (Chicago Hub)c; Lower right: Northeast (New York Hub)d.
aSource: Florida Department of Transportation http://www.floridahighspeedrail.org/images/route-map_all_4.gif
Accessed April 20, 2010
bSource: California High-speed rail Authorityhttp://www.cahighspeedrail.ca.gov/images/chsr/20091026134234_
Preferred_state_102209pm.pdfAccessed April 20, 2010
cSource: Midwest High-speed rail Association http://www.midwesthsr.org/images/network/midwest_hub_map_
30Jun09_large.gifAccessed April 20, 2010
dSource: Wikipediahttp://en.wikipedia.org/wiki/File:NEC_map.svgAccessed April 20, 2010
gains, people in those cities will be able to reach more people in less time (or with higher quality, or at less out-of-pocket cost). However, while they may achieve absolute gains in accessibility, they may lose in relative position, as a greater share of the now larger total accessibility is accumulated by the hub cities.
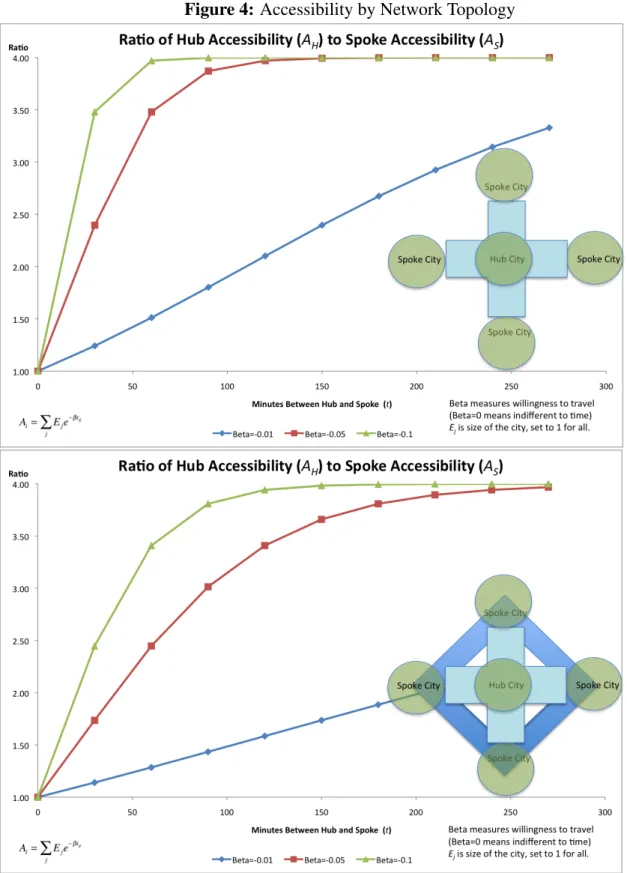
A simple accessibility model is constructed between five cities, a hub and four spokes. In the first case, it is a strict hub and spoke network, so that to go between any two spokes, one must travel through the hub. It is assumed that otherwise all cities are of equal size (and thus value), and the four spokes are symmetrically placed. In the second case, direct routes between the spokes are constructed, so to go from, e.g., the east spoke to the south spoke there is a direct route (at a distance of√2times the distance between the spoke and the hub), but to go from the east to west spoke cities still requires passage through the hub. Schedules are assumed indifferent.
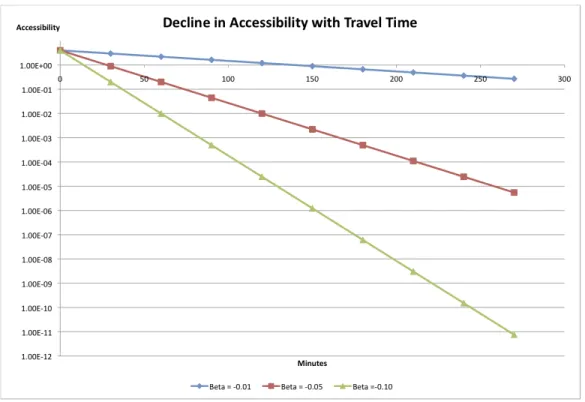
The accessibility model follows the classic Hansen model (Hansen,1959) in which impedance is a negative exponential function of time. The results are shown in5.
As can be seen, as willingness to travel decreases, and as time increases, the advantage over the hub and spoke increases from 1 (no difference) to 4 (the hub has four times the accessibility as a spoke). This is because if the time is great enough (or willingness to travel low enough), people can travel from a spoke to the hub, but the cost of reaching a second spoke through the hub is too great to be valued, while the hub, due to it centrality, can reach all four spokes. In the second case, with direct routes, the same pattern emerges, but the spokes are relatively stronger (though still not as strong as the hub).
Network architecture matters a lot, not just in accessibility, but in user travel time. Hatoko and
Nakagawa (2007) compare the Swiss railway network and the Japan network, and conclude the
mesh-like network with precision timing architecture in Switzerland better serves its population than the hub and spoke mainline system in Japan.
4
Land value creation effects of public transit systems
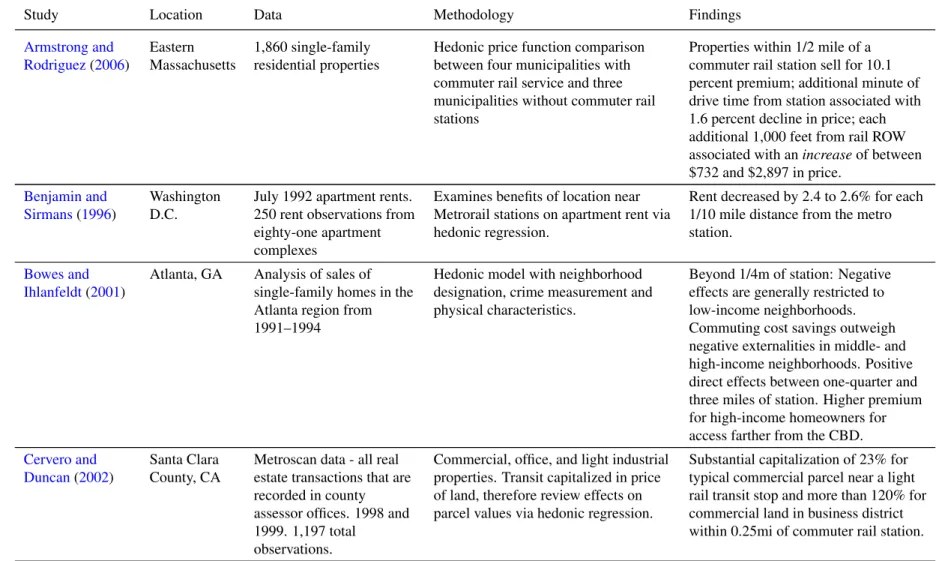
Table1summarizes the effects of local transit systems on land use in a variety of US cases. Studies find both accessibility benefits associated with being near stations, and nuisance costs associated with being near lines and away from stations. The effects show for both residential and commercial real estate. The logic underlying these hedonic studies is that the price of house depends on a number of factors, including the characteristics of the house and land and the characteristics of its location. The primary characteristic of interest here is the distance to rail stations. These effects are decomposed statistically.
Figure 4: Accessibility by Network Topology
Figure 5:How Accessibility Declines with Increasing Travel Time
Table 1:Summary of hedonic studies for transit systems
Study Location Data Methodology Findings
Armstrong and Rodriguez(2006) Eastern Massachusetts 1,860 single-family residential properties
Hedonic price function comparison between four municipalities with commuter rail service and three municipalities without commuter rail stations
Properties within 1/2 mile of a commuter rail station sell for 10.1 percent premium; additional minute of drive time from station associated with 1.6 percent decline in price; each additional 1,000 feet from rail ROW
associated with anincreaseof between
$732 and $2,897 in price.
Benjamin and Sirmans(1996)
Washington D.C.
July 1992 apartment rents. 250 rent observations from eighty-one apartment complexes
Examines benefits of location near Metrorail stations on apartment rent via hedonic regression.
Rent decreased by 2.4 to 2.6% for each 1/10 mile distance from the metro station.
Bowes and Ihlanfeldt(2001)
Atlanta, GA Analysis of sales of
single-family homes in the Atlanta region from 1991–1994
Hedonic model with neighborhood designation, crime measurement and physical characteristics.
Beyond 1/4m of station: Negative effects are generally restricted to low-income neighborhoods. Commuting cost savings outweigh negative externalities in middle- and high-income neighborhoods. Positive direct effects between one-quarter and three miles of station. Higher premium for high-income homeowners for access farther from the CBD.
Cervero and Duncan(2002)
Santa Clara County, CA
Metroscan data - all real estate transactions that are recorded in county assessor offices. 1998 and 1999. 1,197 total
observations.
Commercial, office, and light industrial properties. Transit capitalized in price of land, therefore review effects on parcel values via hedonic regression.
Substantial capitalization of 23% for typical commercial parcel near a light rail transit stop and more than 120% for commercial land in business district within 0.25mi of commuter rail station.
Cervero(1994) Washington D.C and Atlanta, GA
Five rail stations in both cities between 1978-89 period.
Examined transit investments and joint development using test-control methods
In station areas affect five indicators of office market conditions: average rents; vacancy rates; absorption rates; densities; and shares of new and total office and commercial construction near stations. Office rents near stations rose and joint development projects added more than three dollars per gross sq/ft to annual rents. Also had lower office vacancy rates in station ares with joint development projects.
Chen et al.(1998) Portland, OR 1992-1994 data Use GIS and 1990 census to provide neighborhood information for each census block group. Regression for observations within 700 meters of LRT to measure accessibility and nuisance.
Light rail has both a positive effect (accessibility effect) and a negative effect (nuisance effect) on
single-family home values. The positive effect of LRT outweighs the nuisance effect. The minimum price is reached at 427.33 meters (1402 feet) away from stations, a 10.5% price difference. At 100m (328 feet) away from stations, each additional meter results in a $32.20 decrease in average home price.
Dewees(1976) Toronto Sale prices of residential properties and description characteristics.
Travel costs by railway and residential property values. Continuous variables of distance, time and or monetary.
$2,370 premium per hour of travel time saved for sites within 20min walking travel time of Bloor St. (approx. 1/3 mile).
Dueker and Bianco(1999)
Portland, OR Pre and post periods of
1980 and 1990 with a 1986 opening date of the east-side LRT
Ex post facto multiple-group pretest-posttest design. Treatment group is that part of the study area in Portland’s east-side LRT corridor.
Property value declines $1,593 for every 200 ft. out of the station.
Fejarang(1994) Los Angeles, CA
1980-1990 Studied the effects of the
announcement of coming rail service using a test and control group method to compare properties within the corridor tosimilar ones without.
Properties within 1/4 mile of the station enjoy premium of $31 per square foot.
Grass(1992) Washington D.C.
Control and impact neighborhoods 1970-1980
Hedonic price equation and dummy independent variable.
Significant direct relationship between opening of METRO and residential properties - increase around station site areas.
Gatzlaff and Smith(1993)
Miami, FL Sold Properties
1971-1990, database of 912 observations.
Constructed a repeat sales index using pooled sample of properties
surrounding the Metrorail stations and compared it to control. Used hedonic regression to evaluate the variation in property values before and after announcement of Metrorail system development.
Impact of rail development on house values is weakly correlated. Impact does not vary from property distance from the station but varied across neighborhood types.
Gu and Zheng
(2008)
Beijing, China
Jan 1999-Sept 2006 New residential projects within 4km of No.13
A Semi-log hedonic equation was adopted
Housing prices within 1000m of railway stations are higher by nearly 20% than beyond that distance. Encourages land development intensity around stations.
Hess and Almeida(2007)
Buffalo, NY Used 2002 assessed value
of properties form City of Buffalo, 1990-2000.
Hedonic models for residential properties within half a mile of 14 light rail stations and independent variables -property characteristics, neighborhood, and local amenities.
Homes located in the study area, every foot closer to light rail stations increases average property values by $2.31 (geographical straight line) and $0.99 (network distance). Home located within 1/4 mile of LRT station can earn $1300-3000 premium.
Knaap et al.
(2001)
Washington County, OR
All sale transactions of vacant residential parcels located within the urban growth bounary from Jan 1992 to Aug 1996. 1,537 observations.
Use data on land sales in Washington County, OR - Western Portland Metro area. Used relevant date of transit plan announcement.
Plans had positive effect on land values in proposed station areas. Discourage the development of low-density housing and encourage high density transit oriented development.
Landis et al.
(1995)
San Diego, CA
Five City Study within CA City-wide analysis with access
estimates based on ground distance to the station.
A typical home sold for $272 more for every 100 meters closer to a light rail station; no effect for commercial properties.
Landis et al.
(1995)
San
Francisco, CA
Five City Study within CA Access was measured as ground
distance from commuter rail tracks.
Houses located within 300m from train tracks were sold at a $51,000 discount.
Lewis-Workman and Brod(1997) Portland, OR; San Francisco, CA; New York, NY
Portland - property tax rolls, GIS, calculate distance to light rail. 1995 cross sections. San Francisco - GIS mapping data, Home sale prices 1.6 km radius of transit station, sales of 1984-1996 in regression. New York -GIS mapping data and every sale of the past 18 years (expressed in 1996 dollars)
Portland - Nearly every property within 1.6 km of all three stations. Regression of more than 4,000 properties. San Francisco - 1.6km radius from the Pleasant Hill BART station. New York - Queens study area on NY MTA, three stations of Forest Hills, 67 Ave. and Rego Park.
Portland - property values increase by about $2.49 for every meter closer to light rail within 762-1609m distance to transit range. Homes 305m closer to transit are worth $760 more than other homes, on average. San Francisco -non user benefits account for 50% of observed property value premium. 1% increase in distance from BART results in 0.22 percent reduction in home prices. New York - home prices decline about $75 for every meter further from subway stations. Value of average home within these subway stations areas is about $37,000 greater than home outside station areas.
Lin and Hwang
(2004) Taipei, Taiwan 1993-1995 (before subway) 1997-1999 (after subway)
Multiple Regression, Chow test, and fuzzy regression.
Subway opening significantly influences hedonic prices of floor space, building age, and distance from public facilities. Second Influences of subway system opening on hedonic price varies significantly according to different submarkets such as subway construction, location in city, position of property relative to subway stations, land use zoning, and building type. Traditional regression analysis more persuasive.
Nelson(1992) Atlanta, GA Office commercial property sold in study area during the 1980s through 1994. There were 30 such sales
City-wide analysis as ground distance to MARTA station
Negative effect on values of homes in high income areas, positive in lower income. $1.05 per foot distance to the station. Premium on property values in low income areas; $0.96 per foot distance to the station.
Voith(1991) Philadelphia, PA
1970-1988 Access to rail was defined as proximity
of a house to the closest train station -measure by census tracts.
Price premium for single family homes with access to rail stations of 7.5% to 8.0% over an average home’s value.
Weinberger (2001) Santa Clara County, CA 1984-2000 lease transactions collected. 3,701 records.
Effect of LRT on commercial rents in office buildings and research and development buildings. Randomly selected hold sample, 20% of original records to test explanatory and predictive powers of hedonic model.
Properties that lie within 0.8km of a light rail station command a higher lease rate than other properties in the county.
Yankaya(2004) Turkey -Izmir Subway
Dec 2003-March 2004, 360 total observations
Hedonic price model for areas within 500m and 1km of nearest station.
Proximity to subway stations cause higher property values due to accessibility advantage and reduce commuting.
Source:Lari et al.(2009)
5
Land value creation effects of high-speed rail systems
‘The estimated functions show that HSR accessibility has at most a minor effect on house prices” in Taiwan. (Andersson et al.,2010)
Examination of local land uses around international high-speed rail stations suggests that were it not for commuter traffic, the effects on land use will not necessarily be localized near the station, the way they would with a public transit station. Downtown stations, if they were to see land use benefits, should see higher local densities, higher local rents, and the construction of air rights over the station and local yards.
Eurostar is a heavily used high-speed rail line connecting London and Paris, serving 9.2 million passengers per year. Gare du Nord in Paris, which serves Eurostar, has local land uses largely in-distinguishable from other areas of Paris. St. Pancras in London similarly. Ebbsfleet International Rail Station and Ashford International Rail Station are surrounded by surface parking lots.
Tokaido Shinkansen, connecting Tokyo and Osaka and serving 151 million passengers annu-ally, is an order of magnitude more successful. The densities around stations on this line are visibly higher, but still air rights are partially, but not fully developed, indicating limits to how valuable the land is, even in Tokyo. Shin-Osaka station is adjacent to surface parking lots.
The development effects are not local (unlike public transit stations), which is not surprising since if they are serving long distance travel they are also serving less frequent travel, and as a consequence the advantages of being local to the station are weaker. Where they share space with local transit system hubs, the effects would be difficult to disentangle.
6
Economic development effects of proposed high-speed rail
systems
There is no grounded empirical work to date on the economic development impacts of high-speed rail in the United States, since such services do not exist. Little has been written from objec-tive (as opposed to vested) sources. The Congressional Research Service has tried to balance the arguments:
Promoting Economic Development“HSR, according to supporters, promotes eco-nomic development, as well as potentially beneficial changes in land use and employ-ment. In the short term, it is argued, jobs will be created in planning, designing, and building HSR. By improving accessibility, HSR, it is thought, will spur economic de-velopment and the creation of long-term jobs, particularly around high-speed rail sta-tions. For example, the California High-speed rail Authority argues that its proposal for a HSR connecting northern and southern Californian cities will create 160,000 short-term construction-related jobs, and 450,000 long-term jobs.4
4California High-speed rail Authority, “Nearly 160,000 Construction-Related Jobs, 450,000 Permanent Jobs,”http:
//www.cahighspeedrail.ca.gov/news/JOBS_lr.pdf.
Although skeptics point out that increasing spending on anything will create short-term jobs, some research shows that infrastructure spending tends to create more jobs than other types of spending.5 In terms of longer-term benefits, however, the U.S.
Government Accountability Office (GAO) notes that quantifying these benefits can be difficult, and “while benefits such as improvements in economic development and em-ployment may represent real benefits for the jurisdiction in which a new high-speed rail service is located, from another jurisdiction’s perspective or from a national view they may represent a transfer or relocation of benefits.”6 On the question of whether
HSR can provide economic benefits for the national economy as a whole by increas-ing depth of labor markets and improvincreas-ing business travel, the UK transportation policy study discussed earlier notes that “such effects are quite limited in mature economies with well developed infrastructure.”7 This study notes that building a HSR line
be-tween London and Scotland would probably provide modest economic benefits at best because air carriers already provide fast and frequent service at a reasonable cost for business and other travelers.”(Peterman et al.,2009)
The job estimates from California cited in the preceding paragraph would be enormous if they could be validated. A single infrastructure project creating 450,000 jobs, (out of a total civilian employment of under 16 million8) gives a total of almost 3 percent of the state’s workforce. The construction related jobs alone are 1 percent of the state’s workforce. Presently, construction is 577,000 jobs, so this project would absorb on the order of one-third to one-fourth of all construction jobs in the state.
While the propaganda of project promoters may not be plausible, logically there are some regional effects. An argument could be made about strengthening intercity linkages to refashion the current metropolitan system into a megalopolitan system, where people more regularly interact between cities. One could envision this asSwitzerland writ large. If, as Adam Smith suggests, the division of labor is limited by the extent of the market, and transportation can be used to expand the market, the division of labor can therefore increase (i.e. be more specialized), which should have some positive effects for the economy (akin to agglomeration economies).Melo et al.(2009) conduct a meta-analysis of estimates of urban agglomeration economies from 34 studies. The ranges of effects are quite large, and no clear conclusions about the magnitudes can be drawn. The authors write “The findings support the intuition that agglomeration estimates for any particular empirical context may have little relevance elsewhere.”.
Whether HSR will expand markets then depends on whether it is faster (point-to-point) than alternative transportation modes, or allows users to be more productive, which depends again on context.
5CRS Report R40104, Economic Stimulus: Issues and Policies, by Jane G. Gravelle, Thomas L. Hungerford, and
Marc Labonte.
6U.S. Government Accountability Office, High Speed Passenger Rail, GAO-09-317, March 2009, Washington,
DC, p. 29,http://www.gao.gov/new.items/d09317.pdf.
7Eddington Transport Study, 2006, p. 208.
8Source: Bureau of Labor Statistics: Economy at a Glance: Californiahttp://www.bls.gov/eag/eag.ca.htmaccessed
April 20, 2010
Elhorst and Oosterhaven(2008) estimate indirect benefits on top of direct benefits from a Ma-glev system proposed for the Netherlands. While there is no uniform multiplier, the values for the cases they examined the indirect benefits and costs: Additional consumer benefits, Indirectly reduced congestion, Spatial labor market relocation effects, Spatial labor market size and matching effects, and International labor market effects. These indirect benefits range from 0 to 38 percent of the direct benefits.
Interviews with decision-makers at firms in Utrecht, Netherlands, finds some firms located to be near the perceived accessibility of urban transit and intercity rail networks, while others were indifferent. However “High-speed trains did not have a significant impact on the location choice of any of the firms” because the advantages over conventional trains were small and connections required transfers anyway (Willigers,2003).
Nakamura and Ueda(1989) (cited in (Sands, 1993)) finds three of the six prefectures in Japan
with a Shinkansen station had higher population growth than the national average between 1980 and 1985, while no prefecture without the Shinkansen grew faster than the national average. Whether the causality is that the rail caused the growth or areas expected to grew attracted in-vestment is unclear. Similar studies conducted of metropolitan growth find results that suggest that Shinkansen and growth are correlated (e.g. (Hirota, 1984) reported in (Brotchie, 1991)), but the causal structure is not clear. Recent studies suggest the effects of the newer Shinkansen lines are not as favorable as earlier lines (Nakagawa and Hatoko, 2007). Sands (1993) concludes the Shinkansen has shifted growth, but not induced it.
Albalate and Bel(2010) report “Esteban Martín(1998) claims that cities served by [High Speed
Trains (HSTs)] benefit from improved accessibility, but at the same time there is a downgrading of conventional train services and air services on those lines where a HST alternative exists. HSTs do not appear to attract advanced services companies, which show no greater propensity to locate in areas neighboring HST railway stations. And while business tourism and conferences benefit from HST services, a reduction in the number of overnight stays cuts tourist expenditure and the consumption of hotel services. Interestingly, while a HST line improves accessibility between the cities connected by the service, it disarticulates the space between these cities - what has been referred to as the tunnel effect (Gutiérrez Puebla and García Palomares,2005). Hence, HST lines do not seem to increase inter-territorial cohesion, but rather they promote territorial polarization.”
Reviewing the effects in Japan, Europe, and other sites with HSR,Sands(1993), anticipates that “in California, high-speed rail would reinforce existing population and employment patterns and future growth trends.”Kim(2000) anticipates that HSR in South Korea will concentrate population in and around Seoul, while it will disperse employment.
While HSR benefits its users, “the high investment in HST infrastructure could not be justified based on its economic development benefits since these are not certain” (Givoni,2006).
7
Nuisance effects of proposed high-speed rail lines
High-speed rail while providing potential benefits at the nodes, guarantees costs along the lines. Evidence from hedonic price studies (the same kind of studies that were used to assess the acces-sibility benefits of public transit in a previous section) show that each additional decibel of noise
reduces home value by 0.62 percent (Levinson et al.,1997). Using the methodology inLevinson
et al. (1997), the noise per train, and the number of trains per hour determine a noise exposure
forecast. Applying the noise exposure forecast to the number of houses effected by each level of noise, and summing over all of the houses, and multiplying by the value of each house, gives the economic noise damages associated with the trains. So for instance, for a project running 20 trains per hour at 241 km/h through an area with 1000 housing units per square kilometer, each with a value of $250,000 would produce a total noise damage cost per kilometer of track of $1.975 million, a not insignificant cost. For a line of 500 km, this would be a system noise cost of nearly $1 billion. These relationships are non-linear, even one train per hour would produce a total cost of $269 million. Running 20 trains at an average speed of 350 km/h would produce a cost of $1.5 billion.
The noise damages can be avoided if preventive measures are adopted. These include acquiring a much wider right-of-way so there is no housing near the tracks, or noise walls. Whether those costs are less expensive than accepting damages depends on the circumstances.
8
Summary and conclusions
This paper reviewed the state of HSR planning in the United States c. 2010. The plans generally call for a set of barely inter-connected hub-and-spoke networks.
• There is sometimes a danger of a planner falling in love with his map. There is no danger here, even the same agencies have random maps. It seems as no one cares where the lines actually go, so long as they are high-speed rail.
• The marketers have also made a mistake, 220 miles per hour sounds a lot slower (and less futuristic) than 350 kilometers per hour.
• The US carries a greater share of freight by rail than Europe. Converting rights-of-way into passenger only (which is required for HSR) may cost some of that freight share.
• Any money spent on HSR cannot be spent on something else. The issue ofopportunity costs is seldom metnioned.
The evidence from US transit systems shows that lines have two major impacts. There are positive accessibility benefits near stations, but there are negative nuisance effects along the lines themselves. High speed lines are unlikely to have local accessibility benefits separate from con-necting local transit lines because there is little advantage for most people or businesses to locate near a line used infrequently (unlike public transit). However they may have more widespread metropolitan level effects. They will retain, and perhaps worse, have much higher, nuisance ef-fects. A previous study of the full costs of high-speed rail in California (Levinson et al., 1997) showed that the noise and vibration costs along the line would be quite significant. Some examples are reported here, typical lines may have noise damage costs on the order of $1 billion.
If high-speed rail lines can create larger effective regions, that might affect the distribution of who wins and loses from such infrastructure. The magnitude of agglomeration economies is
uncertain (and certainly location-specific), but I think presents the best case that can be made in favor of HSR in the US.
That said, remember that real HSR (not the short term improvements to get to 90 or 110 MPH, which may or may not be a good thing, but are certainly not HSR) is a long term deployment, so it needs to be compared with cars 10 or 20 or 30 years hence, and the air transportation system over the same period. Cars are getting better from both an environmental perspective and from the perspective of automation technologies. The DARPA Urban Challenge vehicles need to be bested to justify HSR. Cars driven by computers, which while sounding far off is technologically quite near, should be able to attain relatively high speeds (though certainly not HSR speeds in mixed traffic). Further they may move less material per passenger than HSR (trains are heavy), and so may net less environmental impact if electrically powered. Aviation is improving as well, both in terms of its environmental impacts and its efficiency. Socially-constructed problems like aviation security or congestion can be solved for far less money than is required for any one high-speed rail line.
The local land use effects of HSR are likely to be small to non-existent. The agglomeration benefits may exist, but there is little grounds for concluding their size.
Acknowledgments
The author recognizes the valuable research assistance provided by Michael Iacono, Jason Junge and Michael Scharenbroich in developing the table “Summary of hedonic studies for transit sys-tems”. This research was funded by New York University. All opinions and errors are those of the author.
References
D. Albalate and G. Bel. High-Speed Rail: Lessons for Policy Makers from Experiences Abroad. IREA Working Papers, 2010.
D.E. Andersson, O.F. Shyr, and J. Fu. Does high-speed rail accessibility influence residential property prices? Hedonic estimates from southern Taiwan. Journal of Transport Geography, 18 (1):166–174, 2010.
Robert Armstrong and Daniel Rodriguez. An evaluation of the accessibility benefits of commuter rail in eastern Massachusetts using spatial hedonic price functions. Transportation, 33:21–43, 2006.
J. Benjamin and G. Sirmans. Mass transportation, apartment rent, and property values.The Journal of Real Estate Research, 12:1–8, 1996.
David R. Bowes and Keith R. Ihlanfeldt. Identifying the impacts of rail transit stations on residen-tial property values. Journal of Urban Economics, 50:1–2–5, 2001.
J. Brotchie. Fast rail networks and socio-economic impacts. Cities of the 21st century: new technologies and spatial systems, pages 25–37, 1991.
Robert Cervero. Rail transit and joint development: Land market impacts in Washington, D.C. and Atlanta. Journal of the American Planning Association, 60:83–94, 1994.
Robert Cervero and Michael Duncan. Transit’s value-added effects: Light and commuter rail services and commercial land values. Transportation Research Record, 1805:8–15, 2002. Hong Chen, Anthony Rufolo, and Kenneth J. Dueker. Measuring the impact of light rail
sys-tems on single-family home values: A hedonic approach with geographic information system application. Transportation Research Record, 1617:38–43, 1998.
Donald N. Dewees. The effects of a subway on residential property values in Toronto. Journal of Urban Economics, 3:357–369, 1976.
Kenneth J. Dueker and Martha J. Bianco. Light-rail-transit impacts in Portland: The first ten years. Transportation Research Record, 1685:171–180, 1999.
J.P. Elhorst and J. Oosterhaven. Integral cost-benefit analysis of Maglev projects under market imperfections. Journal of Transport and Land Use, 1(1):65–87, 2008.
Víctor Esteban Martín. La alta velocidad ferroviaria en la Uni´øn Europea. Su impacto urbano en Francia y España. (High Speed Rail in the European Union. Urban impact in France and Spain). Geographícalia, 36:19–32, 1998.
Robert A. Fejarang. Impact on property values: A study of the Los Angeles Metro Rail. In73rd Annual Meeting. Transportation Research Board, 1994.
Dean H. Gatzlaff and Marc T. Smith. The impact of the Miami Metrorail on the value of residences near station locations. Land Economics, 69(1):54–66, 1993.
M. Givoni. Development and impact of the modern high-speed train: a review. Transport Reviews, 26(5):593–611, 2006.
R.G. Grass. The estimation of residential property values around transit station sites in Washington, D.C. Journal of Economics and Finance, 16:139–146, 1992.
Yizhen Gu and Siqi Zheng. The impacts of rail transit on housing prices and land development intensity: The case of No. 13 line of Beijing. Technical report, Beijing Municipal Institute of City Planning and Design and Tsinghua University – Institute of Real Estate Studies, 2008. J. Gutiérrez Puebla and J.C. García Palomares. Cambios en la movilidad en el área metropolitana
de Madrid: el creciente uso del transporte privado. InAnales de geografía de la Universidad Complutense, number 25, pages 331–350, 2005.
P. Hall. Magic carpets and seamless webs: opportunities and constraints for high-speed trains in Europe. Built Environment, 35(1):59–69, 2009.
W.G. Hansen. How accessibility shapes land use. Journal of the American Planning Association, 25(2):73–76, 1959.
M. Hatoko and D. Nakagawa. Comparative Analysis of Swiss and Japanese Trunk Railway Net-work Structures. InWorld Conference of Transportation Research WCTRS, 2007.
K.E. Haynes. Labor markets and regional transportation improvements: the case of high-speed trains An introduction and review. The annals of regional science, 31(1):57–76, 1997.
Daniel Baldwin Hess and Tangerine Maria Almeida. Impact of proximity to light rail rapid transit on station-area property values in Buffalo, New York. Urban Studies, 44(5/6):1041–1068, May 2007.
R. Hirota. Present Situation and Effects of the Shinkansen, presented at International Seminar on High-Speed Trains, 1984.
K.S. Kim. High-speed rail developments and spatial restructuring:: A case study of the Capital region in South Korea. Cities, 17(4):251–262, 2000.
Gerrit J. Knaap, Chengr Ding, and Lewis D. Hopkins. Do plans matter?: The effects of light rail plans on land values in station areas.Journal of Planning Education and Research, 21(1):32–39, 2001.
John Landis, Robert Cervero, Subhrajit Guhathukurta, David Loutzenheiser, and Ming Zhang. Rail transit investments, real estate values, and land use change: A comparative analysis of five california rail transit systems. Monograph 48, Institute of Urban and Regional Studies, University of California, Berkeley, Berkeley, CA, 1995.
Adeel Lari, David Levinson, Zhirong (Jerry) Zhao, Michael Iacono, Sara Aultman, Kirti Vardhan Das, Jason Junge, Kerstin Larson, and Michael Scharenbroich. Value Capture for Transportation Finance: Technical Research Report. CTS 09-18, 2009.
D. Levinson, J.M. Mathieu, D. Gillen, and A. Kanafani. The full cost of high-speed rail: an engineering approach. The Annals of Regional Science, 31(2):189–215, 1997.
Steven Lewis-Workman and Daniel Brod. Measuring the neighborhood benefits of rail transit accessibility. Transportation Research Record, 1576:147–153, 1997.
Jen-Jia Lin and Chi-Hau Hwang. Analysis of property prices before and after the opening of the Taipei subway system. The Annals of Regional Science, 38:687–704, 2004.
P.C. Melo, D.J. Graham, and R.B. Noland. A meta-analysis of estimates of urban agglomeration economies. Regional Science and Urban Economics, 39(3):332–342, 2009.
D. Nakagawa and M. Hatoko. Reevaluation of Japanese high-speed rail construction:: Recent situation of the north corridor Shinkansen and its way to completion. Transport Policy, 14(2): 150–164, 2007.
H. Nakamura and T. Ueda. The impacts of the Shinkansen on regional development. InThe Fifth World Conference on Transport Research, Yokohama, volume 3, 1989.
Arthur C. Nelson. Effects of elevated heavy-rail transit stations on house prices with respect to neighborhood income. Transportation Research Record, 1359:127–132, 1992.
D.R. Peterman, J. Frittelli, W.J. Mallett, and LIBRARY OF CONGRESS WASHINGTON DC CONGRESSIONAL RESEARCH SERVICE. High Speed Rail (HSR) in the United States. 2009.
J. Preston and G. Wall. The Ex-ante and Ex-post Economic and Social Impacts of the Introduction of High-speed Trains in South East England. Planning Practice and Research, 23(3):403–422, 2008.
B. Sands. The development effects of high-speed rail stations and implications for California.Built Environment, 19(3):257–284, 1993.
K. Spiekermann and M. Wegener. The shrinking continent: new time-space maps of Europe. Environment and planning B, 21:653–653, 1994.
Richard Voith. Changing capitalization of CBD-oriented transportation systems: Evidence from Philadelphia, 1970–1988. Working Paper 91-19, Federal Reserve Bank of Philadelphia, Philadelphia, PA, 1991. URLWeb:http://www.phil.frb.org/econ/wps/index.html. Philadelphia Fed Web page: http://www.philadelphiafed.org/.
Rachel R. Weinberger. Light rail proximity: Benefit or detriment in the case of Santa Clara County, California? Transportation Research Record, 1747:104, 2001.
J. Willigers. High-speed railway developments and corporate location decisions: The role of ac-cessibility. Paper presented at the 43rd ERSA Congress Jyvaskyla, August 27–30, 2003, 2003. Ugar Yankaya. Modeling the impact of Izmir subway on the value of residential property using
hedonic price model. Master’s thesis, Izmir Institute of Technology: City and Regional Planning, 2004.
Figure 6:Shrinking Europe
Source:Spiekermann and Wegener(1994)