Resource Allocation Logic
Framework to Meet Highway
Asset Preservation
NCHRP
REPORT 736
NATIONAL
COOPERATIVE
HIGHWAY
RESEARCH
PROGRAM
Chair: Sandra Rosenbloom, Professor of Planning, University of Arizona, Tucson
ViCe Chair: Deborah H. Butler, Executive Vice President, Planning, and CIO, Norfolk Southern Corporation, Norfolk, VA
exeCutiVe DireCtor: Robert E. Skinner, Jr., Transportation Research Board
MEMBERS
Victoria A. Arroyo, Executive Director, Georgetown Climate Center, and Visiting Professor, Georgetown University Law Center, Washington, DC J. Barry Barker, Executive Director, Transit Authority of River City, Louisville, KY
William A.V. Clark, Professor of Geography and Professor of Statistics, Department of Geography, University of California, Los Angeles Eugene A. Conti, Jr., Secretary of Transportation, North Carolina DOT, Raleigh
James M. Crites, Executive Vice President of Operations, Dallas-Fort Worth International Airport, TX Paula J. C. Hammond, Secretary, Washington State DOT, Olympia
Michael W. Hancock, Secretary, Kentucky Transportation Cabinet, Frankfort
Chris T. Hendrickson, Duquesne Light Professor of Engineering, Carnegie Mellon University, Pittsburgh, PA Adib K. Kanafani, Professor of the Graduate School, University of California, Berkeley
Gary P. LaGrange, President and CEO, Port of New Orleans, LA Michael P. Lewis, Director, Rhode Island DOT, Providence Susan Martinovich, Director, Nevada DOT, Carson City Joan McDonald, Commissioner, New York State DOT, Albany
Michael R. Morris, Director of Transportation, North Central Texas Council of Governments, Arlington Tracy L. Rosser, Vice President, Regional General Manager, Wal-Mart Stores, Inc., Mandeville, LA Henry G. (Gerry) Schwartz, Jr., Chairman (retired), Jacobs/Sverdrup Civil, Inc., St. Louis, MO
Beverly A. Scott, General Manager and CEO, Metropolitan Atlanta Rapid Transit Authority, Atlanta, GA David Seltzer, Principal, Mercator Advisors LLC, Philadelphia, PA
Kumares C. Sinha, Olson Distinguished Professor of Civil Engineering, Purdue University, West Lafayette, IN Thomas K. Sorel, Commissioner, Minnesota DOT, St. Paul
Daniel Sperling, Professor of Civil Engineering and Environmental Science and Policy; Director, Institute of Transportation Studies; and Acting
Director, Energy Efficiency Center, University of California, Davis
Kirk T. Steudle, Director, Michigan DOT, Lansing
Douglas W. Stotlar, President and CEO, Con-Way, Inc., Ann Arbor, MI
C. Michael Walton, Ernest H. Cockrell Centennial Chair in Engineering, University of Texas, Austin EX OFFICIO MEMBERS
Rebecca M. Brewster, President and COO, American Transportation Research Institute, Smyrna, GA Anne S. Ferro, Administrator, Federal Motor Carrier Safety Administration, U.S.DOT
LeRoy Gishi, Chief, Division of Transportation, Bureau of Indian Affairs, U.S. Department of the Interior, Washington, DC John T. Gray II, Senior Vice President, Policy and Economics, Association of American Railroads, Washington, DC John C. Horsley, Executive Director, American Association of State Highway and Transportation Officials, Washington, DC Michael P. Huerta, Acting Administrator, Federal Aviation Administration, U.S.DOT
David T. Matsuda, Administrator, Maritime Administration, U.S.DOT
Michael P. Melaniphy, President and CEO, American Public Transportation Association, Washington, DC Victor M. Mendez, Administrator, Federal Highway Administration, U.S.DOT
Tara O’Toole, Under Secretary for Science and Technology, U.S. Department of Homeland Security, Washington, DC
Robert J. Papp (Adm., U.S. Coast Guard), Commandant, U.S. Coast Guard, U.S. Department of Homeland Security, Washington, DC Cynthia L. Quarterman, Administrator, Pipeline and Hazardous Materials Safety Administration, U.S.DOT
Peter M. Rogoff, Administrator, Federal Transit Administration, U.S.DOT
David L. Strickland, Administrator, National Highway Traffic Safety Administration, U.S.DOT Joseph C. Szabo, Administrator, Federal Railroad Administration, U.S.DOT
Polly Trottenberg, Assistant Secretary for Transportation Policy, U.S.DOT
Robert L. Van Antwerp (Lt. Gen., U.S. Army), Chief of Engineers and Commanding General, U.S. Army Corps of Engineers, Washington, DC Barry R. Wallerstein, Executive Officer, South Coast Air Quality Management District, Diamond Bar, CA
Gregory D. Winfree, Acting Administrator, Research and Innovative Technology Administration, U.S.DOT
NCHRP
REPORT 736
Resource Allocation Logic
Framework to Meet Highway
Asset Preservation
John Wiegmann Balaji Yelchuru Booz Allen HAmilton
McLean, VA
Subscriber Categories
Administration and Management • Highways • Maintenance and Preservation
T R A N S P O R T A T I O N R E S E A R C H B O A R D
WASHINGTON, D.C.2012
www.TRB.org
Research sponsored by the American Association of State Highway and Transportation Officials in cooperation with the Federal Highway Administration
Systematic, well-designed research provides the most effective approach to the solution of many problems facing highway administrators and engineers. Often, highway problems are of local interest and can best be studied by highway departments individually or in cooperation with their state universities and others. However, the accelerating growth of highway transportation develops increasingly complex problems of wide interest to highway authorities. These problems are best studied through a coordinated program of cooperative research.
In recognition of these needs, the highway administrators of the American Association of State Highway and Transportation Officials initiated in 1962 an objective national highway research program employing modern scientific techniques. This program is supported on a continuing basis by funds from participating member states of the Association and it receives the full cooperation and support of the Federal Highway Administration, United States Department of Transportation.
The Transportation Research Board of the National Academies was requested by the Association to administer the research program because of the Board’s recognized objectivity and understanding of modern research practices. The Board is uniquely suited for this purpose as it maintains an extensive committee structure from which authorities on any highway transportation subject may be drawn; it possesses avenues of communications and cooperation with federal, state and local governmental agencies, universities, and industry; its relationship to the National Research Council is an insurance of objectivity; it maintains a full-time research correlation staff of specialists in highway transportation matters to bring the findings of research directly to those who are in a position to use them.
The program is developed on the basis of research needs identified by chief administrators of the highway and transportation departments and by committees of AASHTO. Each year, specific areas of research needs to be included in the program are proposed to the National Research Council and the Board by the American Association of State Highway and Transportation Officials. Research projects to fulfill these needs are defined by the Board, and qualified research agencies are selected from those that have submitted proposals. Administration and surveillance of research contracts are the responsibilities of the National Research Council and the Transportation Research Board.
The needs for highway research are many, and the National Cooperative Highway Research Program can make significant contributions to the solution of highway transportation problems of mutual concern to many responsible groups. The program, however, is intended to complement rather than to substitute for or duplicate other highway research programs.
Published reports of the
NATIONAL COOPERATIVE HIGHWAY RESEARCH PROGRAM
are available from:
Transportation Research Board Business Office
500 Fifth Street, NW Washington, DC 20001
and can be ordered through the Internet at: http://www.national-academies.org/trb/bookstore
Printed in the United States of America
Project 14-21 ISSN 0077-5614 ISBN 978-0-309-25871-5
Library of Congress Control Number 2012952706 © 2012 National Academy of Sciences. All rights reserved.
COPYRIGHT INFORMATION
Authors herein are responsible for the authenticity of their materials and for obtaining written permissions from publishers or persons who own the copyright to any previously published or copyrighted material used herein.
Cooperative Research Programs (CRP) grants permission to reproduce material in this publication for classroom and not-for-profit purposes. Permission is given with the understanding that none of the material will be used to imply TRB, AASHTO, FAA, FHWA, FMCSA, FTA, or Transit Development Corporation endorsement of a particular product, method, or practice. It is expected that those reproducing the material in this document for educational and not-for-profit uses will give appropriate acknowledgment of the source of any reprinted or reproduced material. For other uses of the material, request permission from CRP.
NOTICE
The project that is the subject of this report was a part of the National Cooperative Highway Research Program, conducted by the Transportation Research Board with the approval of the Governing Board of the National Research Council.
The members of the technical panel selected to monitor this project and to review this report were chosen for their special competencies and with regard for appropriate balance. The report was reviewed by the technical panel and accepted for publication according to procedures established and overseen by the Transportation Research Board and approved by the Governing Board of the National Research Council.
The opinions and conclusions expressed or implied in this report are those of the researchers who performed the research and are not necessarily those of the Transportation Research Board, the National Research Council, or the program sponsors.
The Transportation Research Board of the National Academies, the National Research Council, and the sponsors of the National Cooperative Highway Research Program do not endorse products or manufacturers. Trade or manufacturers’ names appear herein solely because they are considered essential to the object of the report.
government on scientific and technical matters. Dr. Ralph J. Cicerone is president of the National Academy of Sciences.
The National Academy of Engineering was established in 1964, under the charter of the National Academy of Sciences, as a parallel organization of outstanding engineers. It is autonomous in its administration and in the selection of its members, sharing with the National Academy of Sciences the responsibility for advising the federal government. The National Academy of Engineering also sponsors engineering programs aimed at meeting national needs, encourages education and research, and recognizes the superior achievements of engineers. Dr. Charles M. Vest is president of the National Academy of Engineering.
The Institute of Medicine was established in 1970 by the National Academy of Sciences to secure the services of eminent members of appropriate professions in the examination of policy matters pertaining to the health of the public. The Institute acts under the responsibility given to the National Academy of Sciences by its congressional charter to be an adviser to the federal government and, on its own initiative, to identify issues of medical care, research, and education. Dr. Harvey V. Fineberg is president of the Institute of Medicine.
The National Research Council was organized by the National Academy of Sciences in 1916 to associate the broad community of science and technology with the Academy’s purposes of furthering knowledge and advising the federal government. Functioning in accordance with general policies determined by the Academy, the Council has become the principal operating agency of both the National Academy of Sciences and the National Academy of Engineering in providing services to the government, the public, and the scientific and engineering communities. The Council is administered jointly by both Academies and the Institute of Medicine. Dr. Ralph J. Cicerone and Dr. Charles M. Vest are chair and vice chair, respectively, of the National Research Council.
The Transportation Research Board is one of six major divisions of the National Research Council. The mission of the Transporta-tion Research Board is to provide leadership in transportaTransporta-tion innovaTransporta-tion and progress through research and informaTransporta-tion exchange, conducted within a setting that is objective, interdisciplinary, and multimodal. The Board’s varied activities annually engage about 7,000 engineers, scientists, and other transportation researchers and practitioners from the public and private sectors and academia, all of whom contribute their expertise in the public interest. The program is supported by state transportation departments, federal agencies including the component administrations of the U.S. Department of Transportation, and other organizations and individu-als interested in the development of transportation. www.TRB.org
AUTHOR ACKNOWLEDGMENTS
The research team acknowledges the assistance of Zongwei Tao, Weris Inc., who was a subcontractor for this project. The team also recognizes the following people for their assistance with facilitating data acquisition from their respective state DOTs during the course of this project: Anita Bush, Nevada State DOT; Kevin Porter, Nevada State DOT; David Luhr, Washington State DOT; Pat Morin, Washington State DOT.
In addition, the research team acknowledges the contributions of the NCHRP Project 14-21 panel and numerous state DOT members, who participated in phone interviews to provide information on the state-of-the-practice of allocating resources for preservation and maintenance activities.
CRP STAFF FOR NCHRP REPORT 736 Christopher W. Jenks, Director, Cooperative Research Programs Crawford F. Jencks, Deputy Director, Cooperative Research Programs Andrew C. Lemer, Senior Program Officer
Sheila Moore, Program Associate Eileen P. Delaney, Director of Publications Kami Cabral, Editor
NCHRP PROJECT 14-21 PANEL
Field of Maintenance—Area of Maintenance of Way and Structures
Ken McEntire, Asset Management Association, LLC, Apex, NC (Chair) Edgardo D. Block, Connecticut DOT, Newington, CT
Anita K. Bush, Nevada DOT, Carson City, NV
Syed Waqar Haider, Michigan State University, East Lansing, MI David R. Luhr, Washington State DOT, Olympia, WA
Marion G. Waters, III, Gresham Smith & Partners, Alpharetta, GA Jeffrey H. Smith, AASHTO Monitor
Deborah Walker, FHWA Liaison Frank N. Lisle, TRB Liaison
Invited Workshop Participants
Jennifer Brandenburg, North Carolina DOT, Raleigh, NC Tom E. Cole, Idaho Transportation Department, Boise, ID Patrick E. Morin, Washington State DOT, Olympia, WA
Jon Wilcoxson, Kentucky Transportation Cabinet Division of Maintenance, Frankfort, KY Russell Yurek, Maryland State Highway Administration, Hanover, MD
This report presents a logic framework for allocating limited highway asset preservation funds among competing demands to achieve high levels of system performance. The report also presents a spreadsheet-based computational tool that implements the framework. The tool uses linear programming optimization to allocate resources across asset classes or geo-graphic regions, subject to constraints that typically must be considered in such decision-making, to achieve target asset performance or condition levels. Prototypical application scenarios and case-study examples illustrate how transportation agency staff may use the framework to assist resource allocation decisionmaking.
State departments of transportation (DOTs) and other government agencies have invested significant resources in building our nation’s highway system. The investments are embodied in the pavements, bridges, lighting, signals, signage, intelligent transportation system (ITS) devices, pavement markings, drainage systems, traffic barriers, landscaping, noise walls, rest areas, and other assets that constitute the network. These various assets, distributed geographically through a highway system, are expected to provide many years of service.
DOTs undertake asset preservation activities to protect past investments and thereby ensure that the full value of these investments is realized. These activities include both maintenance and rehabilitation. A DOT’s resources for preservation activities are inevitably limited and often inadequate to undertake all of the activities that agency staff believe are needed. How to allocate limited resources among competing needs to achieve the greatest benefit is a complex, continuing problem that all DOTs face.
The objectives of NCHRP Project 14-21 were to describe in practical, usable terms an analysis framework that DOT staff may use to allocate resources across principal categories of highway assets to ensure system preservation, and to demonstrate the framework’s appli-cation. An analysis framework of this sort must reflect the fundamental principles under which a DOT operates, for example, how classes of assets are defined and how the agency administers the system for which it is responsible. The framework must also reflect how asset condition and performance are characterized and measured and the condition and performance targets that a DOT seeks to meet. The framework must effectively account for the constraints to be met by the agency, for example ensuring reasonable balance of effort within all parts of the system. For the framework to be useful, it must not impose unrealistic demands on agency staff for extensive data or excessively complex computation.
A research team led by Booz Allen Hamilton reviewed available literature and current practices that decisionmakers use to support resource allocation and considered ways that DOTs typically undertake to allocate preservation resources. The team assessed DOT data
By Andrew C. Lemer
Staff Officer
ties that such agencies may experience. Based on this assessment, the team specified a logical framework using linear-programming optimization.
The team developed a spreadsheet-based approach to implementing the optimization framework and developed examples of its application using data provided by several DOTs. A workshop was held to engage the NCHRP Project 14-21 panel and other invited DOT practitioners to comment on the optimization approach and help the team to refine specific implementation details to enhance the framework’s utility.
This report presents in detail the overall logic framework and the proposed procedures for developing and applying the framework to inform an agency’s resource allocation decisionmaking. A demonstration model (in Excel workbook format) was developed to accompany this report (see text box for details). The files are functional illustrations of the procedure applied under scenarios typical of conditions a DOT may face. DOT staff may adapt the spreadsheet files or develop their own implementation of the logic framework tailored to the specific characteristics of their own agency and system.
The following spreadsheet files are available for download from the NCHRP Project 14-21 web page at http://apps.trb.org/cmsfeed/TRBNetProjectDisplay.asp ?ProjectID=2718:
NCHRP 14-21_Resource_Allocation_Model_Demo_July2012 - Baseline.xlsm NCHRP 14-21_Resource_Allocation_Model_Demo_July2012 - Scenario 2.xlsm NCHRP 14-21_Resource_Allocation_Model_Demo_July2012 - Scenario 3.xlsm NCHRP 14-21_Resource_Allocation_Model_Demo_July2012 - Scenario 4.xlsm
Note: Many of the photographs, figures, and tables in this report have been converted from color to grayscale for printing. The electronic version of the report (posted on the Web at www.trb.org) retains the color versions.
1
Summary
5
Chapter 1
Introduction
5 1.1 Project Background 7 1.2 Organization of the Report
8
Chapter 2
Literature Review
9 2.1 Business Case
15 2.2 Data Collected and Maintained for Resource Allocation 19 2.3 Analytical or Optimization Techniques
22 2.4 Outputs and Reporting 23 2.5 Summary of Findings
25
Chapter 3
Resource Allocation Solution Context
and Requirements
25 3.1 Problem Statement
26 3.2 Resource Allocation Solution Requirements 27 3.3 Key Considerations
30
Chapter 4
Resource Allocation Logic Framework Development
30 4.1 Computational Logic 31 4.2 Solution Components 34 4.3 Data Needs
40 4.4 Allocation Logic
41
Chapter 5
Case Studies and Workshop Findings
41 5.1 Case Studies 42 5.2 Workshop Findings
44
Chapter 6
Resource Allocation Logic Framework
44 6.1 Logic Process
44 6.2 Logic Framework and Demonstration Model 57 6.3 Setup of Additional Case Examples
60 6.4 Results from Sample Runs
64
Chapter 7
Conclusion
67
Appendix A
Literature Review Summary
71
Appendix B
State DOT Interview Guide Book
75
Appendix C
References
76
Appendix D
Acronyms
1
Introduction and Approach
The overarching goal of the National Cooperative Highway Research Program (NCHRP) Project 14-21, “Resource Allocation Framework to Meet Highway Asset Preservation Needs,” is to develop an analysis framework that state DOTs can use as a guide and tool to allocate highway system preservation resources across various principal asset groupings, preser-vation activities, and regions within their jurisdiction. There is no widely accepted logic framework to address preservation resource allocation decisions that account for a broader (multi-asset) view of preservation program needs, nor does a sound logic framework exist for adjusting and optimizing allocations and results accountability across all asset groups— after the inevitable funding constraints and priority changes are introduced.
It is not uncommon in resource allocation processes that preservation needs for some highway asset groups are initially estimated based on priorities and expected performance or condition results. Tools exist to support this estimation—particularly for bridge struc-tures and pavement, but these tools do not effectively support optimization decisions on the division of available resources between asset groupings and regions. Minimal decision support is currently available to estimate preservation needs and allocation adjustments for asset groupings outside the bridge or pavement domains.
The research team performed extensive literature review and conducted numerous inter-views on the processes followed and state-of-the-practice for preservation resource alloca-tion. With analysis of this information, the team derived a clarified statement of the highway preservation resource allocation problem to be considered, and the key decision factors for resource allocation. The research team then formulated a mathematical model to represent the essence of the problem, and to guide solution logic and computations. A solution was then derived based on the mathematical model, applying standard linear programming algorithms and appropriate objective functions. To validate the logic and practicality of the mathematical model, the analysis and linear optimization were developed further, using Microsoft Office Excel and the integrated Solver function.
An initial test solution was developed for demonstration of the logic based on plausible state preservation program structures and underlying data sets for asset inventories, costs, deterioration rates, asset condition, and performance goals. The initial data set was adapted from real state DOT data gathered from document research and prior project experience of the research team. This model was demonstrated and then further tested in two state DOT case applications.
Based on the results of the case studies and recognizing that there is a significant variety of user approaches and taxonomies for preservation resource allocation, the research team
Resource Allocation Logic
Framework for Highway
Asset Preservation
developed a streamlined Excel-based model that permits users to enter appropriate preser-vation program taxonomies, inventory performance and deterioration estimates, priorities, and performance goals. The logic demonstration model is scalable to a wide set of user-defined asset/activity groupings (AAG) and multiple districts. The model offers optimized alloca-tions across all AAGs that are supported by data or reasonable estimates of inventory, aver-age condition, deterioration rates, and unit costs. Alternative allocation solutions are built in for specific AAGs that are not supported by sufficient data or reasonable estimates. The demonstration model is available in Excel workbook format on the NCHRP Project 14-21 web page at www.trb.org.
Logic Framework and Model
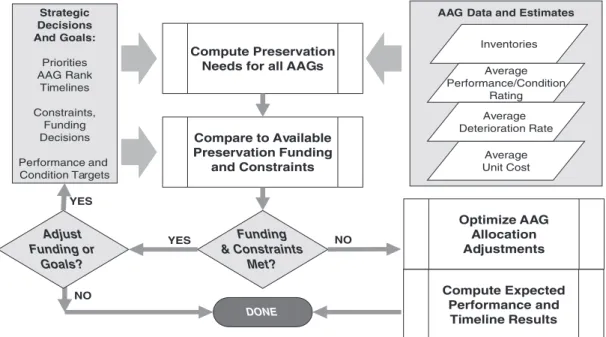
The Resource Allocation Logic Framework and supporting mathematical model deter-mine the optimal investment allocations by AAG for specific allocation cycles and specific regions or districts given statewide goals and objectives, available funding constraints, and performance thresholds. Figure S-1 is a high-level view of the allocation logic. Key outputs from the resource allocation model include realistic performance/condition expectations (both performance/condition and timelines to achieve targets) by AAG after allocations are adjusted to conform to funding limitations and other strategic variables.
Once the strategic inputs and targeted performance/condition (left side of the diagram), and the data inputs (top right side of the diagram) are introduced, the computations and objective function optimize and compute allocations to match available resources, as well as achievable performance results that are accountable to the investments (unshaded blocks). If the performance and timeline results are unacceptable to decisionmakers, adjustments to AAG performance goals or to the overall funding commitment can be made, resulting in new allocation and performance results.
The predicted end-of-cycle performance/condition rating results for each AAG (after funds-available adjustments), when compared with desired targets, is useful to assess the
AAG Data and Estimates
Compute Preservation Needs for all AAGs
Inventories Average Performance/Condition Rating Average Unit Cost Average Deterioration Rate Strategic Decisions And Goals: Priorities AAG Rank Timelines Constraints, Funding Decisions Performance and Condition Targets Compare to Available Preservation Funding and Constraints Optimize AAG Allocation Adjustments Compute Expected Performance and Timeline Results NO NO YES YES Adjust Funding or Goals? Funding & Constraints Met? DONE
effects of funding shortfalls on preservation of the road network. This will help to calibrate stakeholder expectations and high-level decisionmaking on funding in subsequent cycles.
The allocation solution is primarily designed to address situations where (a) available pres-ervation funding is less than estimated or computed overall prespres-ervation needs and (b) asset performance or condition ratings for specific AAGs are below desired targets. Where the opposite is the case, we assume the allocation challenge is met by simply estimating the preservation needs for each asset group and jurisdiction and funding the need or possibly by reassessing the rating targets and priorities for a more aggressive preservation program.
The allocation solution and model are not intended to have granularity below the District/ AAG level; rather the solution is intended to provide a logical total preservation funding envelope for an AAG within a jurisdiction—either district or state. Neither selection of specific projects nor preservation tactics are intended to derive from this logic model. These are considered technical decision within the work planning process.
Solution options were developed for users to treat specific AAGs that lack key data or estimates to compute and optimize allocation needs in the way intended by the framework.
Key Conclusions
The Resource Allocation Logic Framework is fundamentally based on needs. Optimiza-tion applies to the adjustments of needed allocaOptimiza-tions to match available funds. A needs-based determination of allocation resources means that it is necessary (a) to connect preservation investments directly to expected performance/condition results and (b) to enable correction of expected performance/condition outcomes commensurate with any positive or negative allocation adjustments. Connecting investments to results requires reasonably reliable data or estimates on AAG-specific inventories, average performance/condition, average deterio-ration, and average preservation unit costs. Key conclusions include the following:
• Based on literature review and interviews, each state DOT has unique practices, defini-tions, account structure, and taxonomies for the allocation of funds to preservation— there is no one-size-fits-all solution.
• Inventory, performance/condition, deterioration, and preservation unit cost data avail-ability for non-bridge pavement (NBP) assets is very scarce among DOTs, making it challenging to apply a complete analytical approach for allocating resources, without sig-nificant estimating and judgment.
• Agencies track performance metrics and asset inventory in unique ways, so the framework is flexible for a wide range of definitions of both asset-activity groupings and performance standards.
• Deterioration is a very strong driver of preservation need. Where deterioration-based pres-ervation need exceeds funding allocations for any particular AAG, performance improve-ment is not possible; rather performance can be expected to regress. In these cases, optimized allocation of available funds would seek to minimize this regression across AAGs.
Guidance
Several suggestions are included for activities to support and enhance adoption of the Resource Allocation Logic Framework. These are further discussed in Chapter 7.
1. Average Deterioration Rates. Research is suggested to support improved methods for determination or estimating of average deterioration rates for various AAGs. This is a very important factor in the allocation logic framework.
2. Asset Inventory and Condition Management. Compilation of practical NBP inventory and condition assessment and management approaches (in use by DOTs) would be use-ful and helpuse-ful to potential users of the allocation logic framework, both for enhanced resource allocation and for other asset management purposes.
3. Objective Functions for Optimizing Resource Allocation. It makes sense that preferred optimization strategies (and therefore objective functions) would vary considerably across multiple DOTs. Prospective users of the allocation logic framework would benefit from the exercise of developing the right object functions and collecting ideas and prefer-ences from multiple peer agencies.
4. Added Case Applications for Logic Framework. Additional case applications would sup-port, build, and communicate confidence among prospective adopters of the Resource Allocation Logic Framework.
5. Methodology to Facilitate Initial Adoption of the Resource Allocation Logic Frame-work. The team envisions that an adopting DOT will want to populate a full version of the framework with the actual AAG taxonomy and real-time estimates or facts on inven-tory, unit costs, performance status, deterioration, and so forth. It will likely run and calibrate the allocation results in parallel with the normal allocation process.
6. Development and/or Sponsorship of Practitioner Training. Training support is likely to be needed at both strategic and modeler/operator levels for effective assessment, adoption, and implementation of the Resource Allocation Logic Framework, and to build accep-tance and deployment of the allocation framework.
7. Application of the Framework to Other Resource Allocation Areas. It may be use-ful to explore application of the logic more broadly to maintenance and infrastructure improvement programs. The logic model can support any application with any taxon-omy, a quantifiable inventory, performance ratings that can be normalized, and known average cost factors to link investment to results.
5
1.1 Project Background
The highway system infrastructure includes several commonly described asset groupings. These groupings typically include pavements and pavement markings, bridge structures, light-ing, traffic control devices, signage, Intelligent Transportation Systems (ITS), drainage struc-tures, traffic barriers, landscaping, noise barriers, and rest areas. State DOTs manage various programs to maintain, preserve, and rehabilitate these assets to extend their useful life and ensure that they can provide safe and acceptable service throughout it. State DOTs have to balance vari-ous considerations and points of view on priorities as they allocate (usually) scarce resources across and within their highway management programs. Overall, it is challenging for states to balance multiple priorities; to optimize the allocation of these resources to meet expectations on service performance; and, at the same time, to maximize expected useful life from existing assets. Large-scale replacement of failed or badly deteriorated highway assets is far beyond the means of most agencies and will be for the foreseeable future.
The challenge in developing a logic framework to support allocation decisions across the wide variety of highway asset groupings has not been met to date. Many decision-support and planning tools are available to support project selection, estimation, accounting, and operational deci-sions, but these tools tend to be specialized and focused technically on particular assets. There is no widely accepted logic framework to address resource allocation decisions that account for a broader (multi-asset) view of preservation program needs.
The overarching goal of the NCHRP Project 14-21, “Resource Allocation Framework to Meet Highway Asset Preservation Needs,” is to develop an analysis framework that state DOTs can use as a guide and tool to allocate highway system preservation resources across various principal asset groupings, preservation activities, and regions within their jurisdiction. To achieve this goal, this project has three main objectives:
1. Develop and describe a practical logic framework (including principles, objective functions, and constraints) using operations research methodologies.
2. Develop a logic process to apply the logic framework.
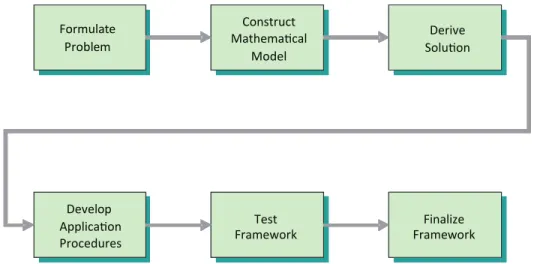
3. Develop a demonstration application of the logic framework using example cases and data. To accomplish these objectives and ensure the success of this project, the research team devel-oped and implemented a detailed technical process (shown in Figure 1-1) to guide the research plan, analyses, and activities.
1. Formulate the Resource Allocation Problem. As a first step, the research team studied the relevant information and developed a well-defined statement of the highway preservation resource allocation problem to be considered. This study included determining the appropriate objectives, the constraints on what can be done, and interrelationships among the areas to
study. This was a crucial process, because it greatly affected the relevance and practicality of the research results.
2. Construct a Mathematical Model. After defining the decision factors for resource allocation, the research team formulated the resource allocation problem for analysis and solution, to construct a mathematical model that represents the essence of the problem. The mathemati-cal model broadly defines the problem and guides the computational solutions. This tool aided in making the overall structure of the problem comprehensible and revealed important cause-and-effect relationships.
3. Derive a Solution from the Model. After formulating the mathematical model, the next step was to derive a solution from this model. This is an analytical step in which one of the stan-dard algorithms of operations research was applied. To ensure the model is practical and can be easily used by DOT managers and applied in broad programmatic investment decision processes, the analysis and linear optimization model were developed using Microsoft Office Excel and Microsoft Solver.
4. Develop Application Procedures. In parallel with developing a logic framework for the resource allocation problem, the team developed appropriate processes and logic to put the logic framework to practical use, recognizing that there is a significant variety of user approaches and program structures for preservation resource allocation. These processes will help to guide state DOTs in optimizing resource allocation in a way that recognizes preserva-tion resource needs and reflects programmatic priorities and system performance goals for asset condition and life.
5. Test and Demonstrate the Logic Framework. An initial solution model was developed for demonstration of the logic based on plausible state preservation program structures and underlying data sets for asset inventories, costs, deterioration rates, asset condition, and per-formance goals. This data set was adapted from real state DOT data gathered from document research and prior project experience of the research team. This solution model was dem-onstrated for the NCHRP Project 14-21 panel, and then further tested in two case applica-tions and a workshop with panel members and resource management subject matter experts (SME). These cases engaged real-world processes and program structures extant at two state DOTs. After the casework and workshop, numerous refinements and streamlining changes were made to the logic framework based on the findings. The refinements were made to pro-vide greater flexibility and scalability in the preservation program asset and activity taxonomies that can be applied as well as to accommodate realities in the availability and quality of key data
Formulate Problem Construct Mathematical Model Derive Solution Develop Application Procedures Test
Framework FrameworkFinalize
Figure 1-1. NCHRP Project 14-21 Resource Allocation Logic Framework technical approach overview.
sets and estimates needed to fully exercise the optimization potential of the solution. The latter accommodation will support useful application of the logic framework with which data and estimates are presently available while enabling the phasing in of more features when that data is developed.
6. Finalize the Framework. Based on the results of the case studies and the workshop, the research team developed a streamlined Excel-based solution model that permits users to enter appropriate preservation program taxonomies, information on available data sets, and program priorities and goals. The model is scalable to a wide set of user-defined asset/activity groupings (AAG) and multiple districts (statewide allocations can be rolled up from district totals or computed as a “single” district). The model incorporates comments and findings from the workshop, and it offers optimized allocations across all AAGs that are supported by data or reasonable estimates of inventory, average condition, deterioration rates, and unit costs. For specific AAGs that are not supported by this data or reasonable estimates for these factors, alternative optimization approaches are built in. Particulars on these options are treated extensively in Chapter 6, and example versions of the model solutions are found in the text and Appendix E.
1.2 Organization of the Report
This report summarizes the methodology for developing an analysis framework that state DOTs can use as a guide to allocate limited resources to maintain crucial transportation and highway assets. The following describes the organization of this report:
• Chapter 2: Literature Review. This chapter addresses the current state-of-the-practice in
preservation resource allocation.
• Chapter 3: Resource Allocation Solution Context and Requirements. This chapter describes
the decisionmaking context for preservation resource allocation within state DOTs. This includes determining the appropriate objectives and the constraints on the process.
• Chapter 4: Resource Allocation Logic Framework Development. This chapter formulates
the resource allocation computational model as a basis for optimization.
• Chapter 5: Case Studies and Workshop Findings. This chapter describes the key findings
from the case studies and workshop that were conducted to test application of the Resource Allocation Logic Framework.
• Chapter 6: Resource Allocation Logic Framework. This chapter describes the solutions
developed to optimize resource allocation. Assumptions, formulae, data and estimates, pri-oritization, and optimization logic are discussed and detailed with examples. It provides alter-native approaches for application of the logic framework as well as key considerations in data collection and estimation of key factors, including deterioration and unit costs. A companion demonstration model (in Excel workbook format) is available on the NCHRP Project 14-21 web page at www.trb.org.
• Chapter 7: Conclusion. This chapter wraps up key lessons learned from the research and
case-work, summarizing a number of key challenges for DOTs to address in adopting the Resource Allocation Logic Framework in support of agencies’ regular allocation processes. Suggestions are offered to facilitate understanding, acceptance, and deployment of the logic framework.
• Appendix A. Literature Review Summary
• Appendix B. State DOT Interview Guidebook
• Appendix C. References
• Appendix D. Acronyms
8
The research team began the work by augmenting our understanding of the current state- of-the-practice in resource allocation. We focused on the policies and principles that typically govern the practices in use as well as the data, methods, and constraints that affect preservation resource allocation decisions. The research team (a) reviewed relevant information available in current literature—research articles, journals, NCHRP reports and so on and (b) interviewed cognizant managers at nine state DOTs to understand the logic process and decisionmaking tools used to allocate preservation funds.
The research team’s review of relevant reports, journals, and articles found that useful lit-erature on preservation resource allocation is limited. In general, there is a lack of information on how state DOTs actually conduct or practice preservation resource allocation. For instance, limited information is available on the following:
• Processes adopted to develop preservation budget at the state and district levels
• Factors that affect the resources available for preservation
• Logic process that state DOTs adopt to allocate preservation resources across different high-way assets and districts/regions
• The role of performance measures and targets in the preservation resource allocation process
• Data, analytical tools, and methods used to support preservation resource allocation decisions The team interviewed managers involved in the resource allocation process at the following state DOTs: • Florida • Maryland • Michigan • Minnesota • Nevada • Oregon • Wyoming • Utah • Washington
The interviews were typically an hour long and involved three or four state DOT partici-pants. The team sent relevant materials and an interview guide in advance to the point of contact at each state DOT to ensure selection of the appropriate participants and allow them to prepare for the discussion. Appendix B provides the interview guide. Typical participants in the interviews included representatives from maintenance management, pavement man-agement, bridge manman-agement, capital programs, asset manman-agement, traffic and safety, and planning.
2.1 Business Case
2.1.1 Defining Highway Preservation
The team established a working definition of preservation—actions to restore and maintain assets in good condition and to extend useful service life. The following definition of preservation
maintenance is from NCHRP Report 551(1):
Definition of System Preservation (Source: NCHRP Report 551 (1))
System preservation encompasses work to extend the life of existing facilities (and associated hardware and equipment) and to repair damage that impedes mobility or safety. The purpose of system preservation is to retain the existing value of an asset and its ability to perform as designed. System preservation counters the wear and tear of physical infrastructure that occurs over time due to traffic loading, climate, crashes, and aging. It is accomplished through both capital projects and maintenance actions.
The Federal Highway Administration (FHWA) (2) and Bridge Preservation Expert Task Group (BPETG) (3) have developed definitions for pavement and bridge preservation. Per BPETG, “For a treatment to be considered pavement preservation, one must consider its intended purpose. As shown in table 1, the distinctive characteristics of pavement preservation activities are that they restore the function of the existing system and extend its service life, not increase its capacity or strength.” According to an FHWA memorandum (2) to local and state transportation agencies, pavement preservation includes three components:
• Minor Rehabilitation. This includes structural enhancements that extend the service life of
highway systems or improve its load-carrying capacity.
• Preventive Maintenance. This includes cost-effective treatment of the existing roadway to
retard future deterioration and maintain or improve the functional condition of the system without significantly increasing the structural capacity.
• Some Routine Maintenance Activities. This includes planned work performed on a
rou-tine basis to maintain and preserve the condition of the highway system or to respond to specific conditions and events that restore the highway system to an adequate level of service (LOS).
Depending on the timing of the application, nature of the distress, and type of activity, certain routine maintenance activities are classified as preservation and eligible for federal funding. Any corrective maintenance that is not part of planned maintenance is normally not considered part of preservation under these definitions and guidelines.
The same memorandum explains and provides examples for these three components.
Minor rehabilitation refers to nonstructural enhancements necessary because of age and
envi-ronmental exposure. Examples of preventive maintenance activities include asphalt crack sealing; chip sealing; slurry or micro-surfacing; thin and ultra-thin, hot-mix asphalt overlay; concrete joint sealing; diamond grinding; dowel-bar retrofit; and isolated, partial, or full-depth concrete repairs to restore functionality of the slab (e.g., edge spalls or corner breaks). Examples of pavement-related routine maintenance activities include cleaning of roadside
ditches and structures, maintenance of pavement markings and crack filling, pothole patching, and isolated overlays.
The state DOT interviews revealed that many states consider some routine preventive main-tenance, corrective mainmain-tenance, and minor rehabilitation work activities to be part of the preservation program, because they are important to extending useful life. Most of the state DOTs interviewed actually allocate preservation resources based (at least in part) on factors driven by asset condition and actual or expected service levels. Many states also determine resource allocation for typical “routine maintenance” (e.g., locally performed pothole repair, crack sealing) based on historical factors (e.g., last year’s budget and district staffing levels for this work).
Ideally, determination of preservation needs should consider measures and estimates of the
expected useful life of an asset along with condition and traffic load factors. Only a few of our
interviewees indicated this orientation, and we recognize that there is a difference of opinion on the precision and certainty of measures associated with useful life estimates.
The boundary between preservation and maintenance is obscure, and states use leeway in interpreting the guidelines on this. However, the interpretive issue is not a critical problem in developing the framework for preservation resource allocation.
2.1.2 Resource Allocation Processes
In addition to the interview findings, the research team relied heavily on two NCHRP products: NCHRP Project 20-68 scan tour report (4) and NCHRP Web-Only Document 154 (5).
These discussions provide an overview of the following:
• State DOTs’ organization context and stakeholders in budget development and resource allocation
• Preservation resource allocation process, addressing the broader context within which pres-ervation allocation decisions are typically made, development of budget, allocation of funds across various programs, and allocation of resources within the preservation program
2.1.2.1 Organizational Context
State DOTs are typically hierarchical organizations, with a cabinet-level officer as the high-est ranking transportation official. This officer is usually under oversight by a transportation commission or legislative committee. There is no standard organizational structure; however, the central office under direction by the top official typically executes policymaking, planning, programming, budgeting, and administrative functions.
In some states, district administrators and officials are directly accountable to the top official for both preserving and maintaining the highway assets and have a strong role in top-level deci-sionmaking on program priorities and geographic distribution of resources for preservation of most asset groups. This is a decentralized model as defined below.
Our interviews revealed that a more centralized model is common, where much of the pres-ervation resource allocation decisionmaking appears to take place centrally. We also observed hybrid versions, particularly regarding bridge preservation programs (usually centrally man-aged) or statewide safety or mobility programs:
• In a centralized model, the central office leads the development of the budget, definition of needs, identification of improvements or projects, and direction of preservation resources. The regional or district offices typically support the budget development process by providing
inputs requested by the central office and refine the projects identified by the central office. The states that have strong legislative oversight tend to have a centralized model.
• In a decentralized model, the regional or district offices have more autonomy in the devel-opment of the budgets, definition of needs, and decisions on significant improvement or preservation projects. In this model, the central office may provide support in the budget development process and usually provides guidance on project selection by the district offices.
• The hybrid model is a blend of both centralized and decentralized models, with specific varia-tions based on program. For example, the initial allocation to all programs is made centrally, with virtually all bridge projects prioritized, selected, and administered centrally; pavement preservation projects are budgeted and recommended centrally, but specific pavement proj-ects are selected and managed in the districts. Resources for other programs, such as traffic, safety, and roadside asset preservation, also tend to exhibit variations on this hybrid model. Overall, the interviews showed that this model is the more common context for typical resource allocation approaches.
2.1.2.2 Process Context for Resource Allocation
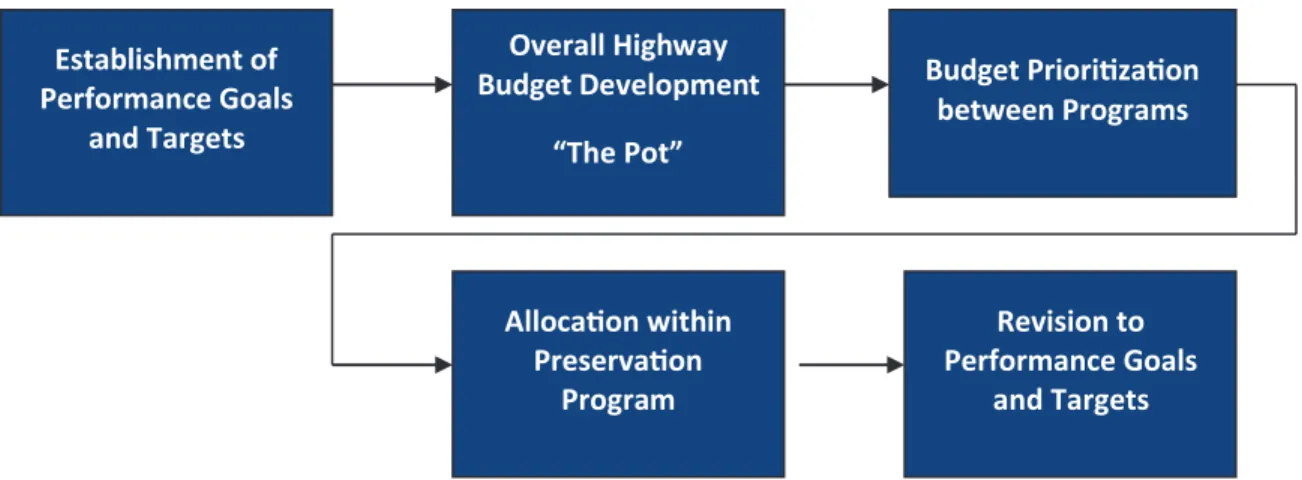
Figure 2-1 summarizes the overall resource allocation logic flow that we observed, notwith-standing the specific organizational models or state DOT entities studied. This is context for the preservation resource allocation processes that are the primary focus of this research.
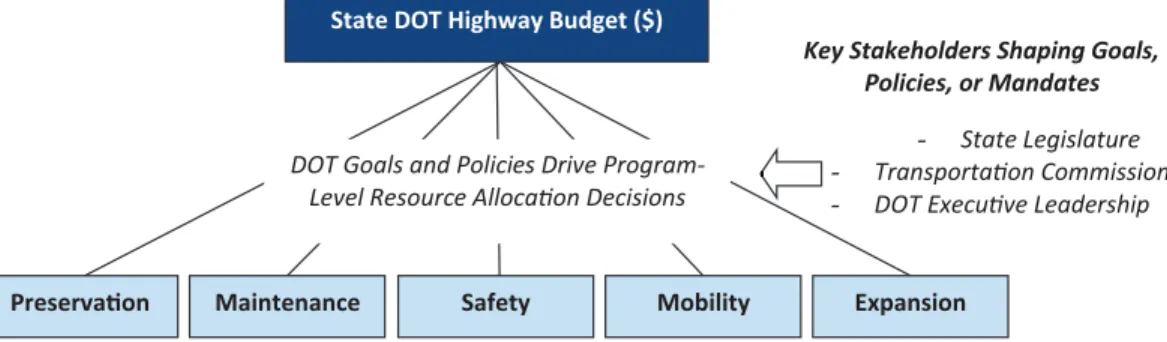
The state DOT’s policy, performance goals, and priorities drive the overall allocation pro-cess. The overall highway budget can include tax revenues, user fee collections, federal funding, credits, and funding from other sources. The DOT organizes funds with certain mandates, con-straints, rules, or policies on their specific use. The DOT prioritizes budgets for each program (including the preservation program) and designates funding based on high-level strategies, policies, and performance objectives for the highway program. This prioritization involves DOT executive leadership and may involve state legislative committees or oversight commissions as well as other stakeholder interests outside of the DOT. Methodology, rationale, and analytic support for this decisionmaking vary significantly in practice, ranging from negotiation and adjustment of historical “shares” for various programs to data-driven decision models based on program performance and need.
The following sections discuss findings in performance targeting, prioritization among pro-grams, and allocation within preservation programs.
Establishment of Performance Goals and Targets Overall Highway Budget Developmen “The Pot” t Allocation within Preservation Program Revision to Performance Goals and Targets Budget Prioritization between Programs
2.1.2.2.1 Establishment of Performance Goals and Targets. Setting performance goals is
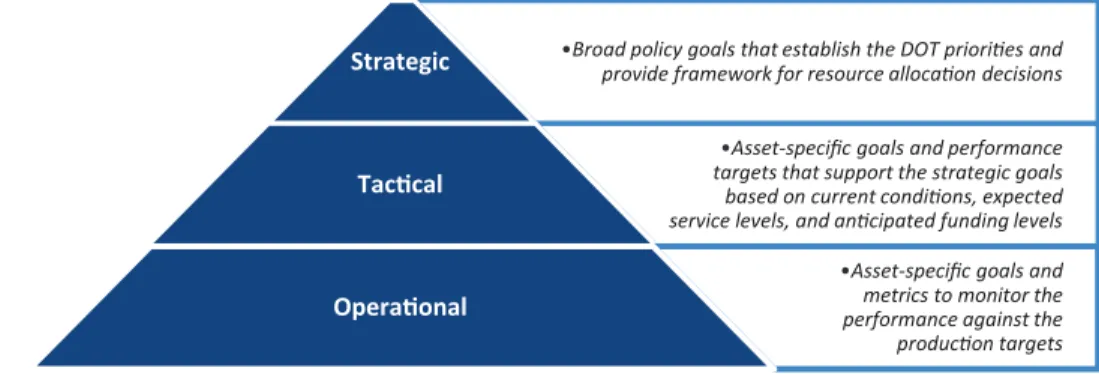
usually a tiered process and occurs at the strategic, tactical, and operational levels, as shown in Figure 2-2.
At the top tier, the state legislature, state transportation commission or advisory commit-tee, governor, and executive leadership usually define the strategic policy framework and the blueprint to make investment decisions. These goals and targets are usually broad and are not frequently updated. For example, Washington State law establishes the following policy goals for its transportation program:
Broad policy goals that establish the DOT priorities and provide framework for resource allocation decisions
Strategic
Asset-specific goals and performance targets that support the strategic goals based on current conditions, expected service levels, and anticipated funding levels
Tactical
Asset-specific goals and metrics to monitor the performance against the production targets
Operational
Figure 2-2. Performance goals and targets by level.
Washington State law (RCW 47.04.280) establishes the policy goals for the transportation program
Preservation. To maintain, preserve, and extend the life and utility of prior investments in transportation systems and services.
Safety. To provide for and improve the safety and security of transportation customers and the system.
Mobility. To improve the predictable movement of goods and people throughout the state.
Environment. To enhance Washington’s quality of life through transportation investments that promote energy conservation, enhance healthy communities, and protect the environment.
Stewardship. To continuously improve the quality, effectiveness, and efficiency of the transportation system.
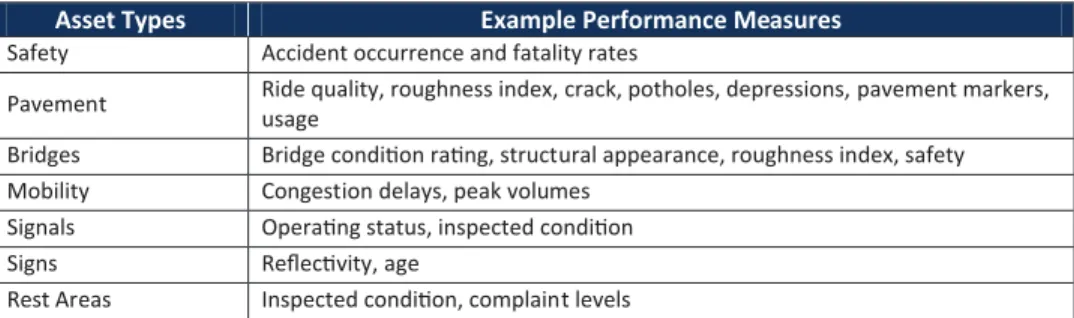
At a tactical level, the goals and targets are typically more asset specific (although still high level) and support the strategic goals and policies. These goals and targets are updated more often (i.e., annually or once every 2 years) depending on budget cycles. The target values for the performance metrics are determined based on the current asset condition and projected asset condition and may be constrained by resource availability for the cycle. Pavement condition
Finally, at an operational level, central or district offices (depending on the program and management model) assess needs and typically use inventory-specific and condition metrics for pavement and bridges. In some cases, this has been extended to other asset groups. These goals and targets are also sometimes updated annually or once every 2 years, depending on the DOT budget cycle.
2.1.2.2.2 Budget Prioritization among Programs. There are varying degrees of state
leg-islature involvement in program budget prioritization decisions. In states with legleg-islature play-ing an active role in these decisions, mandates or statutes might define how the funds should be distributed across different programs and even to districts (e.g., using a formula basis). It is not uncommon for state legislatures or transportation commissions to define and mandate specific policy goals and priorities and set performance standards for various programs within the highway program.
Budget prioritization typically follows the program structure established in each state’s high-way program. For example, Washington State’s highhigh-way program has two main components: the Preservation Program and the Improvement Program. Other states break out more pro-grams at the top level (e.g., preservation, safety, mobility, expansion, maintenance). Either way, most highway management resources flow through these programs after funding is divided among them. Figure 2-3 presents an example highway program structure.
Performance Targets Established in the Florida State Legislature
• Ensure that 80 percent of the pavement on the state highway system meets department standards.
• Ensure that 90 percent of the department-maintained bridges meet department standards.
• Ensure that the department achieves 100 percent of acceptable maintenance standard on the state highway system.
indices and bridge condition indices are a few examples of asset-specific performance metrics at the tactical level. For example, the Florida state legislature defines the following performance targets for the state highway system:
Key Stakeholders Shaping Goals, Policies, or Mandates
- State Legislature - Transportation Commission - DOT Executive Leadership
State DOT Highway Budget ($)
Maintenance Mobility
DOT Goals and Policies Drive Program-Level Resource Allocation Decisions
Preservation Safety Expansion
Many of the interviewed states prioritize safety and preservation needs over other programs. They fund emergency programs, including snow removal and high-priority rehabilitation activi-ties, separately or off the top, followed by other prioritized programs.
The following are some examples of program-level prioritization:
• In Florida, the Florida DOT Executive Board, which is composed of a department secretary, assistant secretaries, deputy secretaries, and program heads, is involved in resource allocation. In Florida, the state legislature requires funding the preservation and maintenance of the existing highway system first. The state legislature also has a formula for distributing discre-tionary capital funds, as needed.
• In Minnesota, Chapter 152 legislative direction provides guidance for prioritizing programs. Until 2004, the Minnesota DOT regarded preservation as a top priority and fully funded the preservation program over safety, mobility, and local community needs. Since then, because of divergence between the projected costs and anticipated revenues, the state has realized that this is not sustainable and has sought to implement a more balanced budget program.
• The Utah Transportation Commission is the governing body responsible for making the state’s investment policies and setting strategic goals. The first priority is system preservation, followed by system performance improvement, and then capacity enhancement.
• In Wyoming, program priority and resource allocation decisions are primarily based on the input provided by the district offices and the DOT executive staff. The state legislature is not actively involved in resource allocation decisions.
2.1.2.3 Resource Allocation within the Preservation Program
Our interviews and recent work with state DOTs found wide variations in approaches and the rationale for resource allocation decisions within preservation programs. All of the observed approaches have the following common objectives:
• Allocation of preservation resources to two primary asset groups (bridges, pavements)
• Allocation of preservation resources to other asset groups, including drainage, signs, guard-rail, lighting, sound barriers, grouped in various ways
• Allocation of resources to specific districts, locations, roadway classifications, or projects Our interviews and recent work also found wide variations in the execution of resource alloca-tion approaches:
• Basis for resource allocation decisions—whether history driven, inventory driven, or needs driven
• Tools for decisionmaking—whether useful measures, models, and analytic models are avail-able to facilitate and support allocation decisions
• Process for reaching resource allocation decisions—whether the logic process is top-down, bottom-up, or a combination of both, depending on asset grouping
• Accountability and control of resource allocation—centralized or decentralized
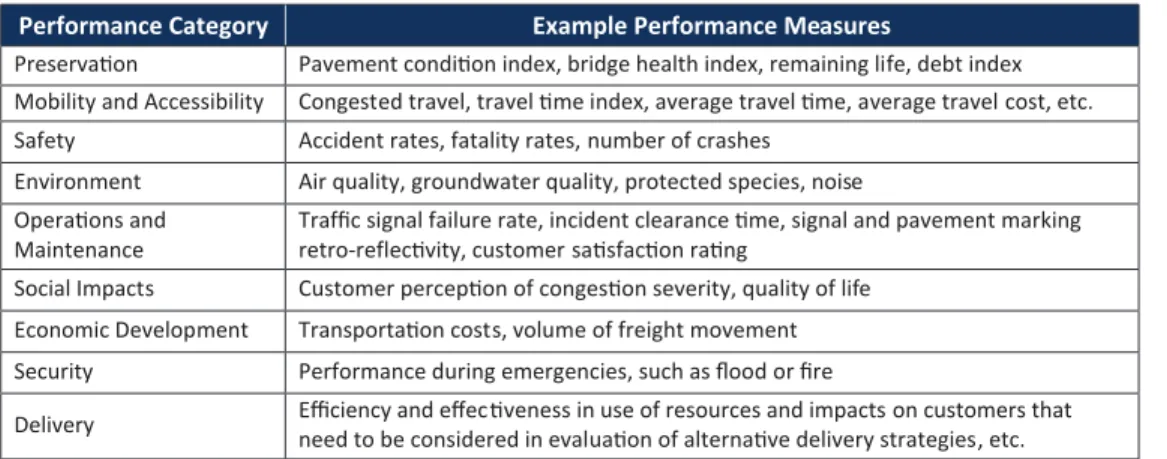
We found from the available literature and our interviews that most state DOTs reported using a data-driven, performance-based approach to resource allocation. In those cases, the per-formance measures and targets play three key roles in assessing the results of year-to-year invest-ments. Resource allocation decision practices within preservation programs also range from history-based to much more sophisticated models, and most approaches incorporate bridge and pavement inventory and condition data as a foundation for decisionmaking.
Confidence was generally high in available inventory and specific condition-rating informa-tion for bridge and pavement assets. All states interviewed reported having a Bridge Manage-ment System (BMS) and a PaveManage-ment ManageManage-ment System (PMS) that track and monitor the
condition of the bridges and pavements, respectively. State DOTs widely adopt the ability to forecast asset conditions based on varying investment levels for bridges and pavements.
Confidence was not as evident for the availability of inventory and condition data for other system assets; only a few DOTs had specific programs or methods in place to assess needs/condition for their other asset categories. Allocation for these tended to be based on a combination of histori-cal budgets and periodic sample condition surveys to determine whether adjustments to allocations were needed.
We found a preponderance of top-down centralized approaches to allocation of preserva-tion resources. Generally, control of allocapreserva-tions and project selecpreserva-tion was centralized for bridge preservation. For pavements, allocation tended to be centralized, but districts had greater influ-ence on specific project selection and execution. Allocations for other asset types were generally less specific as to the particular asset types to be invested in, and control of project selection and execution was at the district level.
Another dimension to resource allocation is the use of various analytical methods and tools to assess and compare the cost and benefits of alternative treatments and to identify the best treat-ment for the individual assets. A common principle used by the states is identification of pres-ervation investments that can maximize the useful life of the asset. Fairly sophisticated analysis tools and models are necessary for resource allocation tools to effectively target extension of useful asset life. These tools would need to integrate reliable condition data with cost–benefit algorithms to address both estimated remaining asset life and projected deterioration. One of the DOTs interviewed indicated it already uses lowest life-cycle cost and benefit–cost approaches to identify improvements and to select preservation projects.
2.2 Data Collected and Maintained
for Resource Allocation
To support resource allocation decisions, most state DOTs collect and maintain asset inven-tory and condition/performance data. The research team collected numerous samples and state-specific examples of this information, which were used to develop case information. This section provides an overview and characterization of inventory and condition/performance data in use.
2.2.1 Asset Data
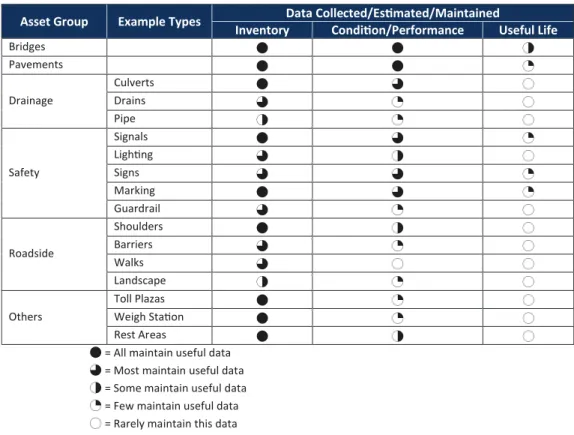
State DOTs spend significant effort to collect and maintain asset inventory data. Most DOTs interviewed have good bridge and pavement information. As shown in the Table 2-1, accord-ing to interviews conducted with nine state DOT agencies, information needed for data-driven resource allocation is typically much more limited for other asset types.
The data overview indicates the challenge practitioners face in implementing data-driven resource allocation logic that reflects needs. Outside the bridge/pavement area, condition and performance data is usually limited to estimation based on sample inspection programs. This can be acceptable for the purpose intended but is nevertheless costly to manage and perform. The need for consistent inspection protocols and sufficient frequency of inspection rounds to support the business cycles drives the cost of this kind of effort.
In a technical sense, inventory and condition/performance data is useful for managing the quality of service (e.g., safety, function) that an asset provides but is not sufficient alone to address useful life, which is intended to be a principal objective of preservation programs. To assess useful life as part of preservation resource allocation logic, reasonable estimates need to be
added for factors driving asset deterioration (e.g., traffic loads, accidental damage rates). Stan-dards for useful life assumptions are also needed for particular assets as well as knowledge of the present status of the asset in its useful life cycle. As can be expected, there is a growing body of knowledge in this area for bridge and pavement but little useful research for other assets. Never-theless, reasonable assumptions and principles can be applied to other assets to aid resource allocation logic, as long as the application is consistent and until sufficient results accumulate to adjust them.
2.2.1.1 Bridges and Pavements
Most state DOTs have detailed bridge and pavement data that usually spans several years. Bridge and pavement data are typically collected through coordination between the central and regional or district offices and maintained centrally at the state level. The data directly feeds the BMS and PMS.
Most state DOTs have developed guidance manuals on how and what data should be col-lected and maintained to monitor the bridge and pavement performance. Data collection occurs on an annual or less frequent basis. The data-collection process is typically a survey of sample data but, in some cases, is more comprehensive. For example, some states collect the pavement condition data on all state and interstate highways annually, while collecting arterial and local road data less frequently. Sensor-mounted vehicles typically collect pave-ment condition data, although some DOTs continue to use visual inspection. Typical data elements captured address rutting, cracking, International Roughness Index (IRI), coverage and faulting, ride quality, and structure or pavement quality. Bridge inspection and rating are performed using broadly accepted standard inspection protocols and rate various elements of the bridge structure.
Table 2-1. Asset data overview.
Asset Group Example Types Inventory Data Collected/Estimated/Maintained Condition/Performance Useful Life Bridges Pavements Drainage Culverts Drains Pipe Safety Signals Lighting Signs Marking Guardrail Roadside Shoulders Barriers Walks Landscape Others Toll Plazas Weigh Station Rest Areas
= All maintain useful data = Most maintain useful data = Some maintain useful data = Few maintain useful data = Rarely maintain this data