Design and Implementation of Wireless Sensors and Android
Based Application for Highly Efficient Aquaculture
Management System
Goib Wiranto1, Dayat Kurniawan1, Yudi Y. Maulana1, I Dewa P.
Hermida1, and David Oktaviandi2
1Research Center for Electronics and Telecommunication, Indonesian Institute of Sciences (LIPI), Jl. Sangkuriang, Bandung 40135, Indonesia
2Food Agency, Provincial Government of Bangka Belitung E-mail: 1[email protected],
Corresponding Author: 2[email protected]
Received June 8, 2020; Revised August 30, 2020; Accepted October 10, 2020
Abstract
The main problems in the practice of traditional shrimp aquaculture are related with maintaining good water quality and reducing high operational cost.In this paper it will be described the application of wireless sensors and Android based application as mobile monitoring tool in achieving highly efficient shrimp aquaculture monitoring system. A set of four water quality parameter sensors (pH, temperature, conductivity and DO) were submerged into the pond using a buoy, in which an electronics and Xbee wireless transmitter have been installed to transmit the measured data into a fixed monitoring station. The main component of the fixed monitoring station was a smart data logger capable of performing automatic aeration system. Data transmission from the monitoring station to the master station was done through GSM/GPRS module of a Raspberry microcontroller. Using internet connection, a web based server has been developed from which the Android based application retrieved the measured parameter data. Graphical analysis of water quality data can be performed from a mobile phone, allowing users to monitor the aquaculture regardless of their geographical location. This system has been implemented in a shrimp aquaculture in Bangka island, Indonesia. In addition to giving real-time water quality data, the system was able to reduce the operational electricity cost because of the automatic aeration feature. Consistently, the system has been sending the measurement data to the web server, which is accessible using Android mobile phones worldwide.
Keywords: Android application, water quality, online monitoring, web server, aquaculture, mobile monitoring.
1. INTRODUCTION
Monitoring water quality of aquaculture has become an area of specific interest to many researchers and practitioners over the past few years. They realised that water characteristics play a vital role in determining the output of an aquaculture business. From economic point of view, aquaculture products, especially shrimps, has been one of the major sources of export revenues for countries like Indonesia [1]. In 2018, the value of export revenue from shrimp products reached 1.3 billion US dollars [2] and is expected to increase in the coming years. Despite such a promising prospect, the practice of shrimp aquaculture in the country is still dominantly conducted using traditional manner [3], which is characterised by high operational cost for electricity and food, high cost for labour, high risk from disease infection, and untrustworthy from operational managers to the owners. Such condition often leads to substantial losses in the aquaculture business.
In moving from traditional to modern practice of aquaculture, it is required that water quality parameters must be constantly monitored and analysed. Thus, accurate measurement of water quality parameters such as pH, temperature, Dissolved Oxygen (DO), conductivity, among others, must be performed in real time and continuously. On the other hand, the use of mobile phones and internet almost can not be separated from daily activities, ranging from social networking, gaming, personal communication, business working groups, education, etc. It is due not only to cheaper communication cost, but also by diverse mobile applications that have been developed to fulfill the need of users of all ages. The ability of mobile phones to display almost all desktop applications has even made them more interesting. Monitoring applications, such as for environment, health, and agriculture, which in the past were primarily developed on windows based, now they can be developed on mobile phones using Android operating system [4–8]. Using mobile phones with internet, now the monitoring of aquaculture water quality can be performed quite easily [9,10].
This work was aimed to design an online monitoring system using wireless sensors, and apply it in a real aquaculture environment. Since the location of the aquaculture and the research center is separated by a distance of more than 1000 km, a web based data server and an Android application has been used to allow for easy monitoring and further development.
2. RELATED WORKS
Previous works on online monitoring for aquaculture include that by Chandanapalliet et al. [11] where low cost wireless sensor networks have been implemented to monitor temperature, pH, and humidity in Gudlavalleru aquaculture, Krishna district, India. The system was tested for data transmission from the fish pond to the control room. Simbeye and Yang [12] has demonstrated a similar system in Tanggu fish pond, China. The measured water quality parameters include DO, temperature and water level, with
automatic pump operation to reduce energy consumption during aeration. Alternatively, a power monitoring device can be connected to a smart power management system to further reduce energy consumption of the pond aeration operation [13], which should be attractive if it can be applied into a large scale aquaculture industry. The importance of monitoring the water circulation system of an aquaculture has also been highlighted by work of Faller and Rodriguez [14]. Overall, the use of sensors and Internet of Things (IoT) for aquaculture industries in China has been mentioned by Ma et al [15]. Although some work has been tested on real aquaculture environment, many works are still at laboratory scale [16–19], and thus need further testing for their long term stability.
3. ORIGINALITY
Work on water quality monitoring for shrimp aquaculture has been conducted since 2010 at the Research Center for Electronics and Telecommunication, Indonesian Institute of Sciences (LIPI). It has evolved from the use of offline method with onsite display to online monitoring through World Wide Web and mobile devices. The main aim was to help farmers increasing their shrimp productivity by using real-time water quality monitoring and reducing operational cost through automatic aeration system. In addition, the web server allows data from many aquaculture centers to be integrated, by which future study may be conducted to further optimise the aquaculture management system. Although similar work conducted by other researchers have focused on the monitoring of water quality parameters, this particular work has the significance of also allowing automatic aeration to maintain optimum DO level. By doing so, the use of power consumption for pond aeration can be significantly reduced. Thus, the work that will be described in detail here should provide a foundation for moving from traditional practice to modern and automatic aquaculture management system.
4. SYSTEM DESIGN
As shown in Figure 1, the system consisted of three main parts: a monitoring station, a master station, and a mobile monitoring station. The monitoring station has the function of performing initial data collection about the water quality parameters from the location of the aquaculture, and performing an automatic aeration system. In this case, if the DO value drops below the lower threshold then the aeration is ON, and if the DO goes above the upper threshold value then the aeration if OFF. Data from the monitoring station were transmitted to the master station using GSM/GPRS module of a Raspberry based microcontroller. At the master station, data were received by a web based data server running MySQL with GUI (Graphical User Interface) capability. The mobile station, i.e., mobile phones with Android application, then accessed the database via website and displayed the data in graphical format.
Figure 1. The concept of online water quality monitoring using Android based application
4.1 The Monitoring Station
The monitoring station basically consisted of sensors and a smart data logger. Initial data collection was performed by the sensors, and the data were sent to the data logger using an Xbee wireless transmission. Table 1 lists the desired water quality parameters for a general pond fish aquaculture [20]. Although there are many parameters that need to be considered in an aquaculture, such as ammonia, turbidity, nitrate, and salinity, but in this work, only four parameters were monitored; pH, DO, Conductivity and temperature. In addition to cost limitation, the monitoring of only these four parameters were also based on the most important ones as usually conducted in most fish aquculture application.
Figure 2. (a). The block diagram of sensor connection to the Arduino microcontroller, Xbee pro wireless transmitter and solar panel, (b). The buoy
structure used to submerge water quality sensors and keep the electronic components saved.
Table 1. Desired water quality criteria for the general pond fish aquaculture [20]
No Parameter Acceptable Range Desirable Range Stress
1 Temperature (oC) 15 – 35 20 – 30 <12, >35 2 Turbidity (cm) 30 – 80 <12, >80 3 DO (mg/L) 3 – 5 5 <5, >8 4 BOD (mg/L) 3 – 6 1 – 2 >10 5 CO2 (mg/L) 0 – 10 <5, 5 – 8 >12 6 pH 7 – 9.5 6.5 – 9.0 <4, >11 7 Alkalinity (mg/L) 50 – 200 25 – 100 <20, >300 8 Hardness (mg/L) >20 75 – 150 <20, >300 9 Calcium (mg/L) 4 – 160 25 – 100 <10, >250 10 Ammonia (mg/L) 0 – 0.05 0 - <0.025 >0.3 11 Nitrite (mg/L) 0.02 – 2 <0.02 >0.2 12 Nitrate (mg/L) 0 – 100 0.1 – 4.5 <0.01, >100 13 Phosporus (mg/L) 0.03 – 2 0.01 – 3 >3 14 Conductivity (S/cm) 30 - 50000 100 – 2000
PH refers to the concentration of hydrogen ions [H+] in the water and is the measure of water acidity. The pH measurement ranges from 0 to 14 with the lower the more acid the water is. For general aquaculture, the normal pH values are usually 7.0 to 9.5, with an optimum range between 6.5 to 9.0. PH is important because it affects the metabolism and other physiological processes of the culture fish. DO, on the other hand, refers to the solubility of oxygen in the water. It has a direct effect on fish growth and production of the aquaculture through feed consumption. Low DO level can be harmful to the culture fish because of the increase in the water toxicity level [21]. Conductivity is a measure of how well the water conducts electricity and is directly related to salt content. A small amount of salt content is needed to help fish maintain their osmotic balance, although high salt content is also needed by other fish species. As a cold blooded animal, the body temperature of fish is effected directly by its environment temperature. Higher temperature increases the oxygen demand and increases the level of ammonia in the water.
4.2 Water Quality Sensors
Four sensors have been used to measure pH, DO, conductivity and temperature of the pond water quality. The specification of each sensor is listed on Table 2. Atlas Scientific sensor probes have been used in many field application. In our case, we have used ENV-40 type for measuring pH, conductivity, and DO parameters, which are suitable for field application involving fresh and salt water. It can be seen that the measurement range of each sensor should be adequate to measure the acceptable ranges of the four parameters as listed in Table 1. As can be seen in Figure 2a, these sensors
were connected to an Arduino microcontroller with Xbee Pro wireless transmitter, which is capable of sending wireless data up to 3.200 m at 2.4 GHz in outdoor environment (according to Xbee Pro S2B datasheet). An interface signal processing circuit for pH, DO, and conductivity sensors was needed to convert the analog signal from the sensor to digital format that can be read by the microcontroller. For the temperature sensor, a direct connection to the Arduino port was possible using one wire connection. Power for the entire sensing block was supplied from a 50-watt peak solar panel system. The heart of an Arduino Uno is an ATMega 328 microcontroller, which must be programmed to allow a set of instructions be executed and performed the required functionality.
Table 2. Sensor types and specification used in the online monitoring system
No Sensor Type Model Range
1 pH Atlas pH Probe Part # ENV-40-pH 0 – 14
2 DO Atlas Dissolved Oxygen Probe Part # ENV-40-DO 0 – 100 mg/L 3 Conductivity Atlas Conductivity Probe K 0.1 Part # ENV-40-EC-K0.1 0.07 μS/cm– 50.000
4 Temperature DS18B20 -55 – 125 oC
To allow these sensors submerged into the water and keep the electronic components and wireless transmitter saved, a buoy has been designed as shown in Figure 2b. The depth of the fish/shrimp pond is normally between 80 – 100 cm. For an average pond area of 5.000 m2, the positioning of the buoy is very important. Thus as a means of monitoring system, the buoy was positioned near the effluent of the pond, where the water quality parameters should have the lowest values. The main problem affecting the reading, especially for the DO probe, was biofouling or the accumulation of microorganisms, plants, algae, or small animals on the surface of the probes. Therefore, we have conducted regular maintenance by cleaning and re-calibrating the sensor reading. In addition, the sensor probes were enclosed inside a PVC tube to reduce direct contact with algae and other microorganisms.
4.3 The Raspberry based Smart Data Logger
The smart data logger has the function of receiving data from the sensor block, controlling the automatic aeration system, displaying and transmitting the received data to the web server. As can be seen in Figure 3a, the main unit of the data logger was a Raspberry Pi 3 board. Compared to other microcontroller boards, Raspberry is a small size board with a lot of features suitable for system automation and IoT applications. Just like a mini computer, it has everything from built-in wireless and Bluetooth connectivity, 64 bit processor, 1 GB RAM, 4 USB 2.0 ports, 40 pin extended
GPIO, and HDMI and RCA video outputs. Although it doesn’t have an internal memory, but it is capable of reading a 32 GB external memory. The operating system is based on Linux kernel, and instructions can be performed using
Phyton programming language.
Figure 3. (a). Block diagram of the smart data logger based on Raspberry Pi 3, (b). The smart data logger, router board and relay box after installation
The use of Raspberry for IoT or online monitoring system has becoming popular since the past few years. Some of them has been applied for water quality monitoring [22,23], environmental monitoring [24], and smart home security system [25]. The most attractive feature of Raspberry is the GPIO (General Purpose Input/Output) pins that can be programmed to connect directly to sensors or any other devices, allowing remote monitoring of physical parameters via worldwide web. In this system, an Xbee Pro wireless receiver has been used to receive data sent from the sensing block. The data was then displayed immediately to the touch screen LCD to give a real time information about water quality to the person onsite the aquaculture.With the onsite display, an operator at the aquaculture can avoid the use of handheld instrument normally used to check the water quality parameters. The programming at the raspberry then checked the data for any threshold violation. In this case, the threshold value was set against the measured DO parameter. For the desirable value of 5 mg/L, the system will activate the relays in case the measured DO value dropped below 5 mg/L. The relays were connected to the pond aeration system. Since the aim was to maintain the DO value at the pond above 5 mg/L, therefore once the aeration system was triggered, it will continue running until the DO value reached 7 mg/L. This method was also meant to avoid relay activation/deactivation when the DO values were around 5 mg/L.
The final task of the data logger was sending the measured data to the web based server using built-in wifi transmitter to the router board and modem. Data transmission interval can be programmed depending on the urgency of the analysis. For some application with high data fluctuation, the transmission interval can be short resulting in almost real time measurement. But for general aquaculture application, a 5-minute data interval should be adequate. Figure 3b shows the installed data logger with router board and relay box positions.
4.4 The Master Station
The master station has the function of collecting all the data from the sensors that have been sent by the data logger. It consisted of web based server that has been designed to accept data from several locations of the monitoring sites. In addition to displaying the data through a worldwide web, the server also collected all data in a database format so that they can be accessed by client from anywhere using browser with internet connection. The database management system was based on MySql, an open-source relational database management system (RDBMS). Data querying was performed using PHP (Hypertext Preprocessor), a popular web based programming language, which allowed dynamic websites and database interaction. The website for the online monitoring system has been designed using Bootstrap, a free front-end framework for faster and easier web development. The websites has several features such as allowing data to be displayed in graphical and tabulation formats and exporting data in Microsoft excel, pdf, and image format. In addition, the website has a user management system, so that different users have different access privileges.
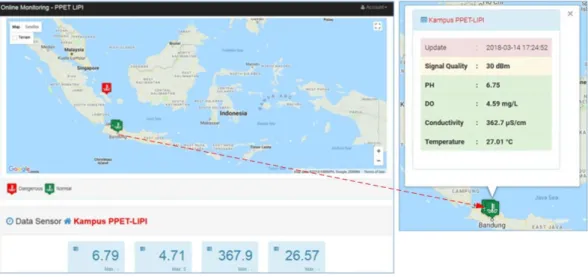
Figure 4. The front page of the web database server and real time parameter values as read from the front page of the web server for Kampus PPET-LIPI station
Figure 4 (left) shows the front page of the web database server accessed from client browser. The front page has several information about water quality parameter data. On the map it can be seen three flags showing the locations of the monitoring stations. Two green flags are in Bandung (laboratory measurement) and one red flag is in Bangka Island (real aquaculture monitoring). The green color indicated a normal water quality condition, whereas the red color indicated a violation of the threshold value has occurred, and the automatic aeration system is in operation. The numbers at the bottom of the page indicated four water quality parameters being measured at one of the locations, in this case at Kampus PPET-LIPI station. The real time parameter values for the measured water quality can also be read by clicking the station flag on the front page of the web server. This is given in Figure 6 (right) for Kampus PPET-LIPI station. At the moment, the values in this website was programmed to update every 5 minutes.
4.5 The Moblie Station
The mobile monitoring station was meant to allow users having a mobile phone with Android operating system to monitor the water quality measurement data more easily, since it is considered more practical than having to access a website or waiting for a sms gateway data. As such, an Android based application has been developed resembling the web-based server. The Android operating system is basically an open source Linux program that can be used to develop applications using Java programming language. However, the Android version itself has developed from its early release in 2009 (version 1.5, code name Cupcake) to 2018 (version 8.1, code name Oreo). The developed Android application is suitable for Android version 4.0 or above.
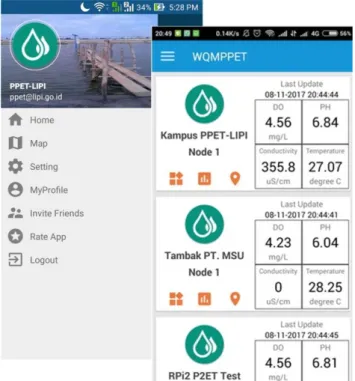
The data for the Android application was extracted from the web database. As has been described in the previous work [26], the process of data transfer from web server to the Android application involved data parsing using HTTP (Hypertext Transfer Protocol) connection. It also required an API (Application Program Interface) to connect the mobile and the website applications. The API used contained source codes based on PHP that has a function of querying data from the website. The data was then encrypted using AES (Advanced Encryption Standard) algorithm, and sent to Android in JSON (JavaScript Object Notation) format. But before the data could be read and displayed by the software developer for Android (Android Studio), the data must be de-encrypted by the Android program. Figure 5 shows the front menu and the real time parameter values of the measured water quality from three locations as appeared on the Android application. The data is automatically updated every 5 minutes. This time interval was chosen based on the urgency of the online data and to reduce the storage capacity if data were sent with shorter time intervals. For further detail about
graphical format, data table, and location of each station, the user can click on the corresponding button below the station names.
Figure 5. The front menu and the real time parameter values as appeared on the Android application
5. EXPERIMENT AND ANALYSIS
5.1 System Deployment and Implementation
The whole system of online water quality monitoring has been tested both in the laboratory and in real aquaculture environment. At the laboratory scale, the aim was to test the system in transmitting data from the sensors to the web based server and to the mobile phone application. Thus, the laboratory testing was done continuously for several months prior to the implementation in real aquaculture location.
One of the oldest shrimp aquaculture center in Babel Province is owned by PT. Merdeka Sarana Usaha. It has been in operation since 1984 with a total area of 100 ha consisting of 89 ponds (eah pond varies from 3.000, 5.000 to 10.000 m2). The main focus of their aquaculture is vannamei shrimp, with an average production of 4.000 kg per cycle from each pond. Each cycle period takes about 100 – 110 days. The main water source for the ponds is coming from the nearby estuary of Baturusa river. Normally after 1 cycle period, the pond is cleaned and prepared for the next cycle. This waiting period can take up to 1 month.
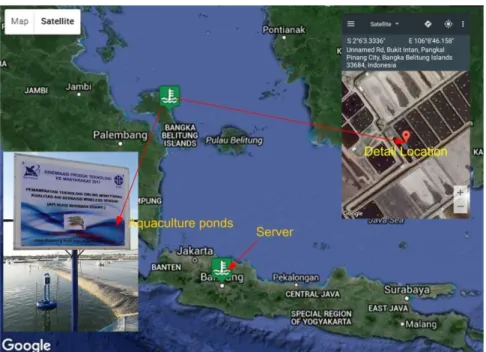
Figure 6 shows the location of the aquaculture where the system has been deployed and implemented. On the right inset it can be seen the detail coordinates and the aerial view of the shrimp ponds. Due to the geographical location which separated the aquaculture and server locations, and the fact that it was difficult to find the necessary components on the island, the system was basically 100% built in the laboratory before deployment to the location. Prior to the deployment, it is necessary to check the signal availability for the internet connection. In Indonesia, signal availability varies depending on the cellular company covering that area.
Figure 6. The detail location of the shrimp aquaculture center in Bangka island where the online monitoring system has been deployed
5.2 Discussion
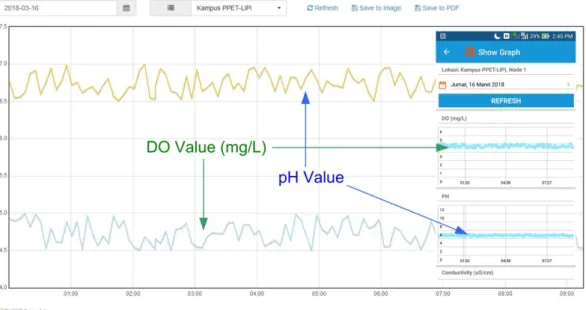
Based on the developed system and the testing that has been conducted, it was expected that the system could deliver real time data measurements to the website and the mobile application. Comparison between these two data information was important as it showed that the designed system could deliver the data correctly. In Figure 7 it can be seen the DO and pH measurement values on March 16, 2018 (from 1 to 9 am) as taken from the website and the Android application for station PPET-LIPI. The sensor data were transmitted using an Arduino based data logger, which was the first version of the developed data logger. As can be seen, both graphs showed identical values for the corresponding DO and pH measurement, with the DO values range between 4.5 – 5.0 mg/L and pH values between 6.5 – 7. As these data were taken in the laboratory, there was no significant variation in the measured values for both parameters.
Figure 7. Comparison of the measured DO and pH values as taken from the website and the mobile application (inset) for station PPET-LIPI on March 16, 2018
(from 1 to 9 am)
In Figure 8 it can be seen the conductivity and temperature measurement values on March 15, 2018 (from 1 am to 23 pm) as taken from the website and the Android application for station RPi2 P2ET Test. This station is also located in the laboratory and the sensor data were transmitted using a Raspberry based data logger. Both graphs showed identical values for the corresponding conductivity and temperature measurement, with conductivity values range from 350 – 375 S/cm, and temperature values around 28 oC. Again, as these data were taken in the laboratory, there was no significant variation in the measured values for both parameters.
A different condition obtained from the station at the aquaculture location. Figure 9 showed the measured DO values at the aquaculture center on the day of November 1, 2017. As can be seen, high variations for the parameter occured through out the day. The DO value was low in the morning, drifting from 4.5 to 4.0 mg/L, and beginning to rise from 4.0 mg/L at 6 am up to almost 8.0 mg/L at around 11 am. From then the DO value started to decrease and reached 5.5 mg/L at 22 pm. Noting that the threshold value for the automatic aeration was set by the data logger at 5.0 – 7.0 mg/L (the lower and upper threshold), it means that the aeration system should be operational from 1 am until around 9 am (for 8 hours), and stopped for the rest of the day since the DO value never dropped below the threshold again.
Figure 8. Comparison of the measured Conductivity and Temperature values as taken from the website and the mobile application (inset) for station RPi2 P2ET Test
on March 15, 2018 (from 1 am to 23 pm)
Figure 9. The measured DO values as taken from the website for station Tambak PT. MSU on November 1, 2017 (from 1 am to 23 pm)
From Figure 9 it can also be explained that the effect of aeration on the DO value was significant. This was seen from the steep rise of DO value in the morning after 6 am, which was due obviously to the increase in photosynthesis activity by underwater organism(in the present of sunlight) and the operation of aeration system. But after the aeration stopped operating at 9 am, the increase in DO value only was sustained for two more hours (until 11 am) before gradually decreased for the rest of the day. From this graph, it is understandable why traditional aquaculture practices always
have their aeration system running to keep the DO value high. However, it as also proven that to maintain the DO level above an acceptable threshhold of 5.0 mg/L in a normal day, the aeration system only needs to be running 30% of the time, which should save energy consumption quite significantly.
In Figure 10, it is shown the measured pH and temperature values at the aquaculture center on the day of October 27, 2017. From this graph, it can be seen that the pH value was nearly constant above 6.5, or within the desirable range for an aquaculture. But the value decreased a little at around 11 am as the temperature of the water rises. This slight decrease because of temperature was as expected, althouh it may not be the only factors affecting the drop in the pH values.
Figure 10. The measured pH and temperature values as taken from the website for station Tambak PT. MSU on October 27, 2017 (from 1 am to 23 pm)
6. CONCLUSION
This paper has described the design and application of wireless sensors and Android based application as a monitoring tool for an aquaculture system. Four water quality sensors (pH, temperature, conductivity and DO) have been used to obtain data from the laboratory and from a real aquaculture location in Bangka island, Indonesia. The measured data were transmitted using Xbee wireless transmitter to a smart data logger, by which they were further sent to a web based server. The smart data logger was designed and realised using a Raspberry Pi, which was capable of performing automatic aeration system to reduced energy consumption of the aquaculture.
An Android application has been developed to retrieve data using internet connection from the web server and displayed them on mobile phones. Graphical analysis of water quality data can be seen onsite, performed from the website or displayed using a mobile phone, allowing
users to monitor the aquaculture condition regardless of their geographical location. The overall system has been proven capable of transmitting accurate measurement data, either from the laboratory or real aquaculture stations. This online water quality monitoring system has been operating for several months, making the water quality management system of an aquculture more efficient.
Acknowledgements
This work was financially supported by the Ministry of Research, Technology, and Higher Education of Indonesia (Kemenristekdikti) under Insinas Project No. 021/P/RPL-LIPI/INSINAS-1/V/2017 and Dissemination Projects n No. 174/SP2H/PPM/DRPM/VIII/2017.
REFERENCES
[1] Lina Asmara Wati, Wen -I. Chang, Moch Muslich Mustadjab,
Competitiveness of Indonesian Shrimp Compare with Thailand Shrimp in Export Market, Wacana, Vol. 16, No. 1, pp. 24–31, 2013. [2] Puty Maharani, Analisis Kemampuan Indonesia Memproduksi
Udang dan Persaingan Ekspor di Pasar Internasional, Asian
Scenarios, February 15, 2020.
[3] Irsyaphiani Insan, Endhay Kusnendar Kontara, Raden Roro Sri Pudji Sinarni Dewi, Improved Production of Tiger Shrimp (Penaeus monodon) Through Probiotics Application, Indonesian Aquaculture
Journal, Vol. 10, No. 2, pp. 131–136, 2015.
[4] Rakesh Dwivedi, Design and Development of Energy Measurement System Based on the Android Platform, International Journal of
Computer Applications, Vol. 108, No. 1, pp. 32–35, 2014.
[5] Dai Ziwen, Liao Haiyang, An On-Line Water Quality Monitoring System for the Reservoirs Based on Android, Advanced Materials
Research, Vol. 945–949, pp. 2199–2202, 2014.
[6] Richard Duncombe, Mobile Phones for Agricultural and Rural Development: A Literature Review and Suggestions for Future Research, European Journal of Development Research, Vol. 28, No. 2, pp. 213–235, 2016.
[7] Mandy Yang, Xingzhou He, Lei Gao, Li Zhao, An Innovative System of Health Monitoring Using Mobile Phones, Proceedings of the 14th IEEE
International Conference on e-Health Networking, Applications and
Services, pp. 379–382, 2012.
[8] Gaikwad Varsha Bhagwan, V. G. Puranik, Real Time Air Pollution Monitoring Using Mobile Phone, International Journal of Innovative
Research in Science, Engineering and Technology, Vol. 3, No. 4, pp. 447–
453, 2014.
[9] Lin Wenmei, Liu Yuzhen, Aquaculture Monitoring System,
International Forum on Information Technology and Applications, Vol. 2,
[10] S. P. Kumar Gudapati, E-Aquaculture Monitoring Using Internet of Things, International Journal of Advance Research, Ideas and
Innovations in Technology, Vol. 4, No. 1, pp. 413–418, 2018.
[11] Suresh Babu Chandanapalli, Sreenivasa Reddy E., Rajya Lakshmi D.,
Design and Deployment of Aqua Monitoring System Using Wireless Sensor Networks and IAR-Kick, Journal of Aquaculture Research &
Development, Vol. 05, No. 07, pp. 1000283(1–10), 2014.
[12] Daudi S. Simbeye, Shi Feng Yang, Water Quality Monitoring and Control for Aquaculture Based on Wireless Sensor Networks,
Journal of Networks, Vol. 9, No. 4, pp. 840–849, 2014.
[13] Wen Pen Chen, Luke K. Wang, Tsai Ting Wang, Yu Ting Chen, An Intelligent Management System for Aquaculture’s Environmental
Monitoring and Energy Conservation, International Workshop on
Computer Science in Sports, pp. 194–198, 2013.
[14] Francisco J. Espinosa-Faller, Guillermo E. Rendón-Rodríguez, A ZigBee Wireless Sensor Network for Monitoring an Aquaculture Recirculating System, Journal of Applied Research and Technology, Vol. 10, No. 3, pp. 380–387, 2012.
[15] Guo-Qiang Ma, Yun-Chen Tian, Xue-Yan Sun, Jun Wu, Jian-Sheng Miao,
Applications and Countermeasures of IOT Technology for Aquaculture in Tianjin City, Proceedings of the 2nd Asia-Pasific
Management and Engineering Conference, pp. 458–461, 2016.
[16] S. Kayalvizhi, Koushik Reddy G., Vivek Kumar P., Venkata Prasanth N.,
Cyber Aqua Culture Monitoring System Using Ardunio And Raspberry Pi, International Journal of Advanced Research in Electrical,
Electronics and Instrumentation Engineering, Vol. 4, No. 5, pp. 4554–
4558, 2015.
[17] Li-jia Xu, Nan Wang, Yu Feng, Dan-ni Bao, K. Jorshin, Design of Aquaculture System Based on Wireless Monitoring and Its Testing,
International Journal of Online Engineering, Vol. 10, No. 5, pp. 68–73,
2014.
[18] Jijin C. K., Roshith K., Online Monitoring and Control Aquaponics Using Lab View, International Journal of Research in Engineering and
Technology, Vol. 5, No. 22, pp. 23–27, 2016.
[19] Lorena Parra, Sandra Sendra, Laura García, Jaime Lloret, Design and Deployment of Low-Cost Sensors for Monitoring the Water Quality and Fish Behavior in Aquaculture Tanks During the Feeding Process, Sensors, Vol. 18, No. 3, p. 750 (1-23), 2018.
[20] Anita Bhatnagar, Pooja Devi, Water Quality Guidelines for the Management of Pond Fish Culture, International Journal of
Environmental Sciences, Vol. 3, No. 6, pp. 1980–2009, 2013.
[21] Warish Khan, Abdul Vahab, Adil Masood, Najib Hasan, Water Quality Requirements and Management Strategies for Fish Farming,
International Journal of Trend in Scientific Research and Development,
[22] Ravi Kiran Varma P., P. L. N. Raju, M. Priyanka, An IoT Application for Environmental Monitoring and Control using Raspberry-Pi,
International Journal of Engineering and Technology, Vol. 9, No. 3S, pp.
546–552, 2017.
[23] M. B. Kalpana, Online Monitoring of Water Quality Using Raspberry Pi3 Model B, International Journal of Innovative Technology And
Research, Vol. 4, No. 6, pp. 4790–4795, 2016.
[24] Nagaraj Patil, Anand K. Warad, IOT and Raspberry PI Based Environmental Monitoring Application, International Journal of
Electrical, Electronics and Computer Systems, Vol. 4, No. 4, pp. 36–41,
2016.
[25] Pragati Ukey, Anita Shinde, Sneha Kasrung, Satish Kamble, Jidnyesh Kadu, Development of Smart Home Security System using Raspberry Pi, International Research Journal of Engineering and
Technology, Vol. 4, No. 6, pp. 1925–1928, 2017.
[26] Priyani Kusrini, Goib Wiranto, Iqbal Syamsu, Lilik Hasanah, Sistem Monitoring Online Kualitas Air Akuakultur untuk Tambak Udang Menggunakan Aplikasi Berbasis Android, Jurnal Elektronika dan

![Table 1. Desired water quality criteria for the general pond fish aquaculture [20] No Parameter Acceptable Range Desirable Range Stress 1 Temperature ( o C) 15 – 35 20 – 30 <12, >35 2 Turbidity (cm) 30 – 80 <12, >80 3 DO (mg/L)](https://thumb-us.123doks.com/thumbv2/123dok_us/1091055.2644986/5.892.171.726.198.536/desired-criteria-aquaculture-parameter-acceptable-desirable-temperature-turbidity.webp)