Gunady, S. and Keoh, S. L. (2019) A Non-GPS Based Location Tracking of
Public Buses using Bluetooth Proximity Beacons. In: 2019 IEEE 5th World
Forum on Internet of Things (WF-IoT), Limerick, Ireland, 15-18 Apr 2019,
ISBN 9781538649800 (doi:
10.1109/WF-IoT.2019.8767198
).
This is the author’s final accepted version.
There may be differences between this version and the published version.
You are advised to consult the publisher’s version if you wish to cite from
it.
http://eprints.gla.ac.uk/181047/
Deposited on: 04 March 2019
Enlighten – Research publications by members of the University of Glasgow
A Non-GPS based Location Tracking of Public
Buses using Bluetooth Proximity Beacons
Sydneyanata Gunady
School of Computing ScienceUniversity of Glasgow, UK sydney_gunady7@hotmail.com
Sye Loong Keoh
School of Computing ScienceUniversity of Glasgow, UK SyeLoong.Keoh@glasgow.ac.uk
Abstract—Tracking of public bus location requires a GPS device to be installed, and many bus operators in developing countries do not have such a solution in place to provide an accurate estimation of bus arrival time (ETA). Without ETA information, it is very difficult for the general public to plan their journey effectively. This paper proposes an innovative IoT solution to track the location of buses without requiring the deployment of a GPS device. It uses Bluetooth Low Energy (BLE) proximity beacon to track the journey of a bus by deploying an Estimote location beacon on the bus. BLE detection devices (Raspberry Pi 3) are installed at selected bus stops along the bus route to detect the arrival of buses. Once detected, the location of the bus is submitted to a cloud server to compute the bus ETAs. A field trial is currently being conducted in Johor, Malaysia in collaboration with a local bus operator on one single bus route. Our test results showed that the detection of BLE beacons is very accurate and it is feasible to track the location of buses without using a GPS device in a cost effective way. A mobile app –myBusz has been developed as well to allow for passengers to check the bus ETA in real-time.
I. INTRODUCTION
Stage Bus is the most commonly used mode of public transportation in the world. In many developing countries, people rely on public bus to commute between home and work place. However, public buses often suffer from over-crowding, and the current transportation infrastructure is not adequately supported by the government to deal with the overwhelming number of commuters. In addition, the public bus network in developing cities and rural areas are mostly unreliable, and the service frequency is unpredictable most of the time. Although a human time-keeper is employed at the bus terminal to enforce the schedule of the bus, it falls short due to human errors and non-compliance by the bus drivers.
With the advent of IoT and tracking technologies such as Global Positioning System (GPS) and cellular based Internet connectivity, bus fleets can now be tracked in real-time. This has provided great certainty to the commuters, allowing them to plan their journey more efficiently and hence reduce their waiting time at the bus stop. Developed countries such as Singapore took a step further to trial the concept of Smart
Bus Stop. The concept of Smart Bus Stop1 aims to improve
commuter experience by having enhanced cooling at the bus stop, as well as accurate arrival time of the buses on an
1
https://www.straitstimes.com/singapore/transport/an-oasis-of-cool-clean-air-for-bus-commuters
information panel. An interactive chatbot is also deployed to allow for commuters to converse with the chatbot using various local languages and dialects, to query the bus arrival time, weather forecast, and the quickest route to their destinations. All the cool features of Smart Bus Stop require that the real-time location of the bus fleet to be available. In many developing countries that are not able afford these advance solution, bus operators are not even thinking of installing GPS devices and 3G connectivity on their bus fleet. Deployment of GPS devices and data connectivity on the bus fleet implies additional operating cost to the bus operators, e.g., a stage bus service between two cities may have up to twenty buses servicing the route and this means that the bus operator will have to bear additional cost of GPS installation and the recurring data connectivity cost for each bus.
On the other hand, bus operators that deploy GPS on their fleet are reluctant to make the buses’ GPS traces available to the public. The GPS traces are mainly used for the purpose of speed monitoring, illegal route deviation, compliance to the service schedule, and generation of reports to the regulatory authority. Therefore, the crucial information, i.e., the real-time location of the bus, is not readily available in most cases. As a result, it is not possible to provide an estimation of bus arrival time (ETA), let alone the features ofSmart Bus Stopin many developing countries.
In this paper, we propose a novel and innovative IoT solution to track the location of buses without requiring the deployment of a GPS device. Our solution uses Bluetooth Low Energy (BLE) proximity beacon to track the journey of a bus along its service route. BLE beacons (i.e., Estimote location beacon) are deployed on buses to be tracked, while BLE detection devices (Raspberry Pi 3) are installed at selected bus stops along the route, including deployment at the bus terminals. With this, the proposed solution is able to first track (a) when the bus leaves the bus terminal, (b) at what time the bus arrives at a particular bus stop, (c) estimate the arrival time (ETA) of the bus along the route. The collected location data is then analyzed and in the future can be fed into a predictive analytics model to predict the bus ETA. We are currently running a field trial onKulai Bus Terminal-Johor Bahru Sentral(Malaysia) bus route with a bus operator, S&S. The paper is organized as follows: Section II describes our previous work that relies on crowd-sourced contribution of
bus location data, and related work. Section III presents an architectural overview of the proposed solution. In Section IV, we describes the implementation of the proposed system, followed by the evaluation of the system in Section V. We conclude the paper with future work in Section VI.
II. BACKGROUND ANDRELATEDWORK
A. Crowd-sourced Bus Location Reporting
In our previous work, we proposed a crowd-sourced ap-proach to obtain GPS traces of the bus through passenger contribution [6]. The system exploited the availability and capability of passengers’ mobile phone to share location information of the bus they were travelling on, and at the same time provided an estimation of bus ETA to the general public. The passengers onboard were also able to track the estimated arrival time at the destination. After six months of trial, it was observed that passengers were not bothered to share their location while onboard the bus and this had led to the unavailability of bus location data. Bus drivers could not be relied upon either, as they found it cumbersome to use the mobile app to report bus location. More importantly, reporting bus location throughout the day would consume their 3G data even though the data cost was subsidized.
This has led to the conclusion that the solution is not sufficiently robust and reliable to obtain GPS traces of the bus if no one was willing to share the location data while onboard the bus. We also realised that a solution that very much depends on human operators tend to be not reliable and prone to failure due to non-compliance of the operating procedures. Furthermore, without a viable incentive scheme to entice the passengers, a crowd-sourced solution [5] would not be successful.
B. Related Work
Menezes et al [7] proposed to use Radio Frequency Iden-tification (RFID) to track buses, in order to provide useful estimates of arrival times in India. Each bus is equipped with an RFID tag, while the RFID readers are mounted at intersections, lamp posts or bus stops. The tag readers are used to continuously monitor passing of the buses and report the detection in real-time. However, it is not clear whether the system has been deployed and tested in Mumbai as the authors claimed that there were problems with false or missing reads due to the distortion of radio waves and interference.
OneBusAway [3], [4] is a system that uses the published GTFS real-time data feed to provide bus arrival time, infor-mation about disruption of services, delays, and location of the buses. It is available for use through a variety of interfaces, including mobile app, webpage and SMS. OneBusAway is designed to be customizable and expandable, and it is now available for use in many big cities in the US including New York City, Atlanta and Puget Sound [1].
Zhou et al [11] proposed a bus arrival prediction system based on sensors on mobile phone and it does not require any GPS traces. Instead, it relies on the cell-tower signals, accelerometers on the phone to determine that the passenger
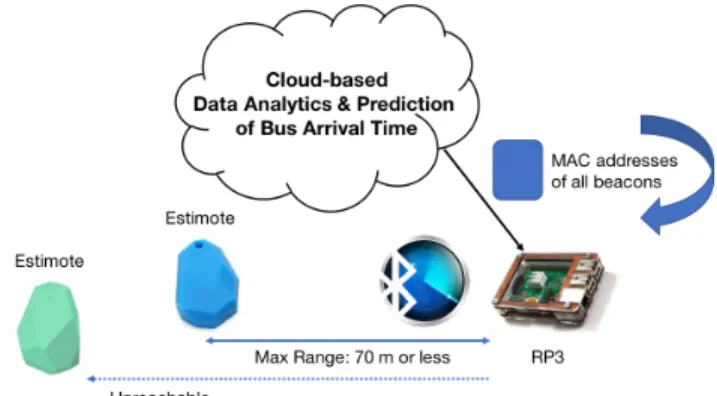
Fig. 1: Architectural overview of location tracking of public buses using BLE.
is travelling on the bus, subsequently using the Cell Tower ID reported by the mobile phone to identify the bus route, and finally utiliting both traffic data and history know ledge to predict the bus arrival time. Similarly, EasyTracker [2], [10] is a co-operative transit tracking using the passengers’ mobile data to detect that they are travelling on a bus and infer the route of the bus service, as well as to predict the ETA.
III. ARCHITECTURALOVERVIEW
Figure 1 illustrates the proposed system for tracking the lo-cation of public buses along their service route using Bluetooth Low Energy (BLE) proximity detection. Instead of installing a GPS device and 3G data connectivity on each bus, a BLE beacon (i.e., Estimote iBeacon) that periodically broadcasts Bluetooth signal is placed in the dashboard of the bus. When the bus passes by a bus stop, equipped with a BLE detection device (i.e., Raspberry Pi 3) that continuously scans for the beacon signal in the vicinity, it is able to detect the arrival of the bus at the bus stop. It will then send the bus location data and the arrival time to the cloud-based data analytics service to estimate the arrival time of the bus at subsequent bus stops towards the destination. Currently, the prediction of bus ETA is based on a simple average of the historical data, and the traveling speed of the bus in real time.
We have also built a deep-learning model with linear regres-sion [8], [9] to learn about the journey duration between two points during peak and non-peak period, taking into account the weather condition that might affect the journey time. The bus location data collected from this research will then be fed into our machine learning model to refine the prediction engine, thus increasing the accuracy of the estimation of bus arrival time. The ultimate objective of this research is to develop a predictive model of bus ETA, thus eliminating the need for deploying GPS onboard the bus. With an accurate prediction model, the number of beacon detection devices to be mounted at bus stops could also be reduced in order to minimize the operating cost in the future.
A. Bus Location Tracking using BLE
BLE is a power-conserving sub-technology of Bluetooth, designed for devices and machines that are connected to the
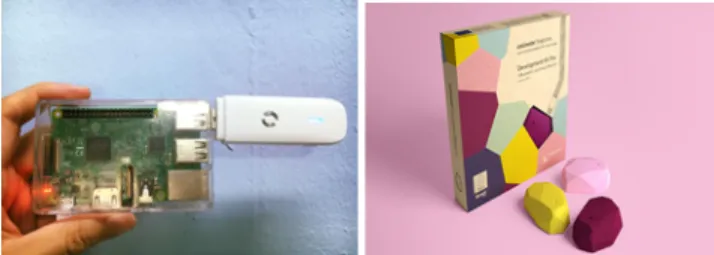
Fig. 2: Estimote location beacon detection using Raspberry Pi Model 3 (RP3).
Internet. Due to the low maintenance cost and long-lasting battery life, it is a popular technology that is being widely used for pervasive computing and IoT applications in recent years. BLE devices when set at 0 dBm (decibels/milliwatts) output power could produce a detection range of up to 50 meters. Any Bluetooth device, such as a Raspberry Pi 3 will be able to determine within the set range of the BLE, whether there are devices within the proximity.
Our proposed system uses BLE proximity detection in order to detect whether a bus is (1) stationary at the parking bay of the bus terminal (2) passing through a bus stop along its bus route. When the location of the bus is detected, the location information together with a timestamp are sent to the cloud service, to trigger real-time estimation of bus arrival time for all subsequent bus stops. When there is insufficient bus location data, the cloud service will use the averaged historical travelling time between bus stops to compute the ETAs.
As illustrated in Figure 2, the Estimote proximity bea-con is placed inside the dashboard of the bus, broadcasting itself using iBeacon protocol. The Estimote beacon can be configured to adjust the broadcasting power, maximum range of broadcast and the advertising interval. We advocate that the maximum range of ≈ 70m is used, to ensure that that the BLE beacon can be picked up by the BLE detection device. A standard Raspberry Pi Model 3 (RP3) device is used as the BLE detection device mounted at selected bus stops and bus terminals. It is programmed to periodically scan and discover BLE devices in the proximity. There is a white list that contains the MAC addresses of all the Estimote proximity beacons deployed on the buses, and the RP3 updates the list daily from the cloud server. This allows for the RP3 to filter out non-relevant BLE devices, and only discovers buses plying the route which pass by the bus stops.
1) Detection at the Bus Terminal: An RP3 device must be
mounted at the bus terminal to detect the departure of the bus. The RP3 maintains a list of detected beacons (also the buses) at the parking bays; If it detects that the beacon is no longer in the vicinity, this implies that the bus has left the bus terminal. As the BLE detection can be inconsistent due to the interference, a single non-detection does not necessary
Fig. 3: Detection of buses at the terminal: (1) Bus entering the terminal, (2) Bus is parked and stationary, (3) Bus leaving the terminal.
mean that the bus has departed. Therefore, when there are three consecutive non-detection of the beacon, RP3 concludes that the bus had left the bus terminal. Subsequently, the RP3 submits the location of the bus (i.e., the coordinates of the bus terminal) to the cloud-based analytics server, as the last known location of the bus. This would in turn trigger the prediction of bus ETA based on the bus’s departure time.
As shown in Figure 3, when the bus is entering the bus terminal, the RP3 is able to detect that the bus is already in the vicinity as the moving speed of the bus is slow. As the RP3 scans for the presence of beacons every 30 seconds, it continuously monitors and detects whether the beacon is still present at the bus terminal. When the bus is parked at the parking bay, the bus will be at its closest point to the RP3 and hence it will be easily detected. Finally, when the bus departs from the terminal, the beacon will no longer be detected.
2) Detection at Bus Stops: The proposed system assumes
that the bus usually stop at the bus stops to allow for passengers to alight, as well as to pick up new passengers. As the bus is stationary for about one to two minutes at the bus stop, it allows for the RP3 to accurately discover the Estimote beacon in the bus, and upon successful detection, sends the location of the bus stop (pre-set in the RP3) to the cloud-based analytics service for processing.
In the case that the bus stays at the bus stop for a longer period of time, as the RP3 scans for the beacons every 30 seconds, it will keep on sending the bus location to the cloud service. In this way, the system is aware that the bus is still at the bus stop, and the ETA to the next stops will be updated accordingly and accurately until the bus leaves the bus stop.
Fig. 4: Detection of bus at a bus stop.
on the opposite direction and this would have an adverse effect on the estimation of bus arrival time if the bus is mistakenly classified as plying the opposite service route. When a bus location is detected and then submitted to the cloud-based analytics server, it first checks the travel direction of the detected bus, ie., by checking whether the ETA of the last stop for that particular service route is known. If the ETA for the destination is not known, this implies that the bus is travelling on the opposite direction.
In addition, the placement of RP3 and also the number of RP3 deployed would significantly determine the accuracy of the ETA. Having a RP3 mounted at every bus stop means that more location data of the bus can be collected. This will improve the accuracy of the ETA, however there will also be an increase in the operating cost. Hence, placing the RP3 at a strategically located bus stop could help in terms of cutting down the number of RP3 being deployed, while maintaining a certain level of accuracy.
B. Estimation of Bus Arrival Time (ETA)
The bus service route is pre-defined prior to the deployment of the system. The route information is converted into a polyline, i.e., a set of GPS coordinates (latitude, longitude), so that the distance between a bus stop on the route with the last reported bus location can be calculated, and subsequently deriving the ETA. In addition, all the bus stops along the route are identified and then mapped to the closest point on the polyline for the route. Using Haversine Formula, the distance between two GPS points (obtained from the route polyline) can be accurately calculated, hence the distance between consecutive bus stops can be calculated based on the route and then stored in the database.
As each bus stop is mounted with an RP3 to detect the bus, essentially the proposed system is able to track the journey of the bus effectively when the bus passes by the bus stop. When detected, the location of the bus is sent to the cloud-based analytics server. An ETA computation process is executed every 30 seconds in order to update the time of arrival of all bus services at every bus stop, based on the reported bus location collected from the RP3.
Fig. 5: Computation of ETA based on data collected from RP3. As shown in Figure 5, for each bus service route, the ETA computation process determines the latest bus location, tn,
which is usually a bus stop. The distance between bus stops, such as d0 andd1, is fixed and pre-computed when defining the bus service route. In order to accurately estimate the bus
arrival time at the next few stops, the average speed of the bus in the past 5-10 minutes, v is used. As shown in the figure, the distance between two points in the past five minutes are determined, and using the total travelling time between the two points (tn to tn−3), the system is able to determine the average travelling speed. As a result, the ETA for the next few bus stops can be calculated. In the case that there was no reported bus location in the past five minutes, the historical averaged travelling time (c.f., Section III-C) is used.
C. Average Historical Journey Time
In our previous work, there was a batch processing job that is executed once a day to analyze the bus location data in order to compute the average journey time between bus stops for all routes. The algorithm simply iterates through the location data collected and find the closest point to the two consecutive bus stops and calculate the velocity,v of the bus. Using the pre-computed distance between the bus stops, the journey time between two bus stops, T can be derived. Currently, the computedT is averaged with the historical data, and organized according to the day, and time of the journey. With the historical average journey time, when the bus departs from the Terminal, as there is only one location data reported, our system first use the historical journey time to estimate the ETA for all bus stops along the route, until sufficient location data have been collected, only then the real-time prediction of ETA is triggered.
IV. IMPLEMENTATION
This section outlines the implementation details of the proposed bus location tracking system, and describes the field trial in Malaysia’s Iskandar Region, Johor.
The cloud-based analytics service was implemented using RESTful API as the interaction with the application are simple requests, such as POST and GET. It uses a stateless commu-nication protocol that treats every request as an independent transaction. The system was developed using PHP and it is currently hosted on Heroku Cloud Platform.
Fig. 6: bluez and nodeJS Noble libraries are installed on RP3, and Estimote location beacons.
As shown in Figure 6, the BLE detection was implemented using the NodeJS Noble library. The RP3 device which is used to detect the beacon uses the official Linux Bluetooth protocol stack, bluez. Each RP3 also has a 3G USB dongle to send bus location data to the cloud-based analytics server.
A. Deployment on Kulai-Johor Bahru (Malaysia) Route There are 37 bus stops along the Kulai Bus Terminal to Johor Bahru (JB) Sentral route, including two bus terminals. The distance between the two terminals is 34.2 km and a typical bus journey takes around 50 minutes each way. As illustrated in Figure 7, for this field trial, an RP3 is deployed at JB Sentral bus terminal, to detect departure of buses, while two RP3 are deployed at the first and sixth stop from Kulai Bus Terminal (denoted as A and Hospital in the figure). It was discovered that there is strong interference in Kulai bus terminal, due to a powerful Wifi Access Tower onsite to provide Free Johor Wifi service.
Fig. 7: Placement of RP3 in Kulai-JB Sentral route. As shown in Figure 7, for Kulai to JB Sentral direction, each time the bus passes by bus stop A, the location of the bus is tracked and then submitted to the cloud server. This will trigger the computation of ETA at bus stop B, C, D...to JB Sentral based on the historical averaged journey time as there is no other location data reported that can be used. Subsequently, when the bus arrives at bus stop Hospital, this triggers a location update to the cloud-based analytics server. Based on this location update and the journey time since the bus was detected at stop A, the cloud server is able to determine the speed of the bus, v and updates the ETA of the next three stops from Hospital; while the remaining stops towards JB Sentral are estimated based on the pre-computed historical averaged journey time. Ideally, when more RP3 are deployed along the route, the system will be able to provide a more accurate estimation of the bus arrival time.
When the bus arrives at its destination – JB Sentral, the deployed RP3 will detect that the bus is at the parking bay, until it senses that the bus had left the terminal, a location update is sent to the cloud-based analytics server. By using the bus departure time detected by RP3, the ETAs for all the bus stops (JB Sentral to Kulai direction) are computed by adding the pre-computed historical journey time to the departure time. B. Mobile App and Information Panel
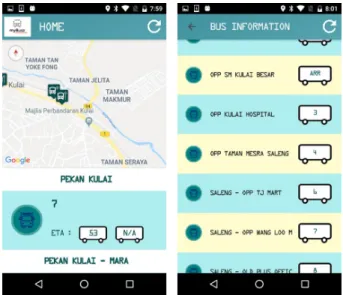
A Mobile App has been created to let the passengers check the bus’s ETA on their smart phones. The Mobile App is build based on the Ionic Framework and uses RESTful API to obtain the necessary data from the cloud server. As illustrated in Figure 8, the landing page of the Mobile App shows the current location of the user on a map as well as the bus ETA information of the top three nearest bus stops to the user. Bus stops are also shown in the form of a map marker, allowing the user to choose the bus stop manually. Upon clicking on
Fig. 8: Interfaces of themyBuszmobile app
the bus stop, the bus ETA information will be shown to the user. In order to keep the ETA information up to date, there is background process that obtains the updated ETA from the cloud server every 30 seconds. Alternatively, there is a refresh button that allows the user to instantly update the ETA at the selected bus stop. The user can also choose to display a list of bus stops belonging to a particular bus service route. For each bus stop listed, the bus ETA is displayed and refreshed every 30 seconds as shown in Figure 8.
A web information panel is also created to be deployed at the bus stops to provide ETA information of incoming buses to the passengers waiting at the bus stops. The panel shows a list of bus services (i.e., bus no.) that will stop at the particular bus stop; and for each bus service, the panel provides the ETA of the next two incoming buses.
V. EVALUATION
This sections describes a set of tests to determine the accuracy of Estimote location beacon detection.
A. Detection of Stationary Estimote Beacons
Table I shows the result of a range test for detecting a BLE beacon. The test measured the furthest distance the beacon could achieve based on it’s broadcasting power level, while still being detected by the RP3. The test was conducted by changing thebroadcasting power levelof the Estimote location beacon. The evaluation was performed in a void deck in a housing area, where there were interference from the building walls and also Bluetooth devices. The venue of where the test was conducted is a good gauge of how the actual usage of the system is being used, as the place where the RP3 is deployed would also have interference such as Bluetooth devices coming from the passengers’ smart phones.
Based on the result shown in Table I, the application of using the Bluetooth beacons to track the bus is feasible as it is possible to detect a Estimote beacon which is 33.7 m away,
TX power (in dBm) Maximum Range(in meters) -20 3.5 -12 5.5 -4 14.2 4 20.5 10 33.7
TABLE I: Table showing the Beacon Range testing result
with interference inclusive. We note that the distance between the bus stop and the furthest lane on the opposite direction is typically be less than 40 m.
B. Detection of Bus with an Estimote Beacon
The results from our field trial reveals that the detection of BLE beacons on the bus is very accurate. We have deployed BLE beacons on 8 buses out of the fleet of 20 buses.
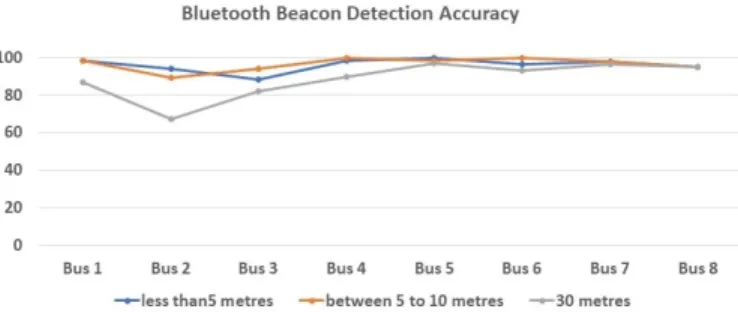
We measured the accuracy of detecting the beacon by RP3 device mounted at (1) the first bus stop after Kulai Bus Terminal (2) JB Sentral Bus Terminal. The bus will first be detected at the bus stop (< 5m), and when it arrives at JB Sentral, the RP3 device should also detects that the bus at the terminal (5-10m). On its way back to Kulai from JB Sentral (i.e., opposite service route), the RP3 device at the bus stop should also detect the bus on the opposite lane as well (30m). Figure 9 shows the accuracy of the detection for the month of January 2019. Our results show that the detection accuracy is approximately 90% and above for all buses when the distance between the RP3 device to the bus stop is (<5m) and between (5-10m). For detection of bus that is (30m) away, the detection accuracy is between 80% to 97% with an exception of one particular bus (bus ID 2) with detection accuracy of 67%. The reason for the outlier could be due to the fast speed of the bus and that the bus did not stop at the bus stop.
Fig. 9: Accuracy of bus detection using BLE Beacons In essence, the detection of beacon by RP3 mounted at the bus stop was very accurate when the distance of the bus and the bus stop is less than 5-10 m away. Even when the bus was travelling at low speed without stopping, the RP3 was still able to detect the bus accurately.
VI. FUTUREWORK ANDCONCLUSIONS
We have proposed a new way of tracking the location of public buses using BLE proximity beacon, in order to provide an estimation of bus arrival time. Instead of relying on the bus operators to upgrade its fleet to install a GPS
device or share their fleet’s GPS traces, we have provided an alternative means to collect, analyze, predict and disseminate transport information. With sufficient location and bus arrival data collected, the proposed system can be integrated with a deep-learning model to predict the bus arrival time. The ultimate aim of this research is to design an accurate bus location tracking and ETA system that does not rely on the availability of real-time GPS data. With such a solution, it can be deployed in many developing countries to improve people’s mobility and journey experience.
As part of the predictive analysis of ETA, the proposed system can make use of Google Traffic API to determine the traffic condition of the road that the bus will be traveling on. The current system could only detect delay based on the reported location of the bus by the RP3. Thus, there might be a slight miscalculation of ETA in the case where the bus was delayed for a long period of time and the distance between the previous RP3 and the next one is a long distance. Hence, by making use of the traffic data obtained by Google API, the calculation of ETA can be optimized by adding the amount of extra time the bus will spend on due to heavy traffic.
REFERENCES
[1] S. J. Barbeau, A. Borning, and K. E. Watkins. Onebusaway multi-region - rapidly expanding mobile transit apps to new cities.Journal of Public Transportation, 17, 2014.
[2] J. Biagioni, T. Gerlich, T. Merrifield, and J. Eriksson. Easytracker: Automatic transit tracking, mapping, and arrival time prediction using smartphones. InProceedings of the 9th ACM Conference on Embedded Networked Sensor Systems, SenSys ’11, pages 68–81, New York, NY, USA, 2011. ACM.
[3] B. Ferris, K. Watkins, and A. Borning. Onebusaway : A transit traveller information system. InMobile Computing, Applications, and Services. MobiCASE, 2009.
[4] B. Ferris, K. Watkins, and A. Borning. Onebusaway: Results from providing real-time arrival information for public transit. InProceedings of the SIGCHI Conference on Human Factors in Computing Systems, CHI ’10, pages 1807–1816, New York, NY, USA, 2010. ACM. [5] S. L. Lau and S. M. S. Ismail. Towards a real-time public transport data
framework using crowd-sourced passenger contributed data. In 2015 IEEE 82nd Vehicular Technology Conference (VTC2015-Fall), pages 1– 6, Sept 2015.
[6] W. L. H. Lim, J. T. W. Lum, I. J. W. Yeo, and S. L. Keoh. A crowd-assisted real-time public transport information service: No more endless wait. In2016 IEEE International Conference on Pervasive Computing and Communication Workshops (PerCom Workshops), pages 1–6, March 2016.
[7] B. L. Menezes, K. Laddhad, K. B. Kresit, and K. Dutta. Challenges in RFID Deployment – A Case Study in Public Transportation. 2006. [8] M. S. B. Othman, S. L. Keoh, and G. Tan. Efficient journey planning
and congestion prediction through deep learning. In2017 International Smart Cities Conference (ISC2), pages 1–6, Sept 2017.
[9] M. S. B. Othman and G. Tan. Predictive Simulation of Public Transportation Using Deep Learning. InMethods and Applications for Modeling and Simulation of Complex Systems. AsiaSim, 2018. [10] A. Thiagarajan, J. Biagioni, T. Gerlich, and J. Eriksson. Cooperative
transit tracking using smart-phones. In Proceedings of the 8th ACM Conference on Embedded Networked Sensor Systems, SenSys ’10, pages 85–98, New York, NY, USA, 2010. ACM.
[11] P. Zhou, Y. Zheng, and M. Li. How long to wait?: Predicting bus arrival time with mobile phone based participatory sensing. InProceedings of the 10th International Conference on Mobile Systems, Applications, and Services, MobiSys ’12, pages 379–392, New York, NY, USA, 2012. ACM.