Journal of Physics: Conference Series
PAPER • OPEN ACCESS
Tourism demand forecasting – a review on the variables and models
To cite this article: Sarah Mohd Khaidi et al 2019 J. Phys.: Conf. Ser. 1366 012111View the article online for updates and enhancements.
ICoAIMS 2019
Journal of Physics: Conference Series 1366 (2019) 012111
IOP Publishing doi:10.1088/1742-6596/1366/1/012111
Tourism demand forecasting – a review on the variables and
models
Sarah Mohd Khaidi1, Noratikah Abu1,a and Noryanti Muhammad1
Centre for Mathematical Sciences, Universiti Malaysia Pahang, 26300 Kuantan,
Pahang, Malaysia
aEmail: atikahabu@ump.edu.my
Abstract. With the growth of the world’s tourism industry, researchers took advantage to conduct numerous studies in forecasting of tourism demand. The objective of this paper is to review the studies on tourism demand starting from 2010 to 2018 which varies on the explanatory variables, such as tourist income, exchange rate, gross domestic product, and others. In addition, this study also reviewed the models used to forecast and analyse tourism demand which are time-series model, econometric causal model and artificial intelligence model. The result from this review shows it is difficult to conclude which models performed the best for tourism demand. However, in most of the studies, combined models outperformed single model. Furthermore, the authors mentioned about the roles of tourism practitioners in the industry, tourism seasonality and suggestions for further studies in the future.
1. Introduction
As reported by World Travel and Tourism Council (WTTC), global tourism industry generated $8.3 trillion which is about 10.4% of the world’s Gross Domestic Product (GDP) in 2017. The increasing of the number of international tourist arrivals globally, travel and tourism industries are rapidly growing compared to the other economy sectors. Tourism industry gives a large impact on the society, not only accelerate the growth of national economic, but also provide more work opportunities and also influence the cultural background of the local people. The growth of the industry globally makes the tourists expecting good services and facilities at their destinations. The number of visitors reflects the hospitality of the country visited.
The tourism forecast studies from Google Scholar could be found easily from 2010 and onwards. This is supported by Moro and Rita [1], the keyword involving “tourism forecasting” are seen to have inclination in the number of publications especially between 1980 and 2010. In addition, Song and Li
[2] reviewed 121 studies published starting from 2000 to 2007. However, it is believed that the
ICoAIMS 2019
Journal of Physics: Conference Series 1366 (2019) 012111
IOP Publishing doi:10.1088/1742-6596/1366/1/012111
2
domestic product (GDP) and other influencing factors of tourist arrivals, so that the future directions of
researchesinvolving the tourism demand forecasting are identified. Hence, the ideas for the researchers
to conduct future studies using different models or other types of variables using the existing models can be generated.
2. Studies of forecasting tourism demand 2.1. General observations
There are 14 studies about tourism demand forecasting published starting from 2010 to 2018 which are acquired from Google Scholar database. The destination of the tourism demand in the studies covered across the globe such as Asian countries, European countries and countries in African regions. As the country of origin, United Kingdom (UK) and the United States of America (USA) are the most popular countries studied (six studies mentioned USA and four for the UK) other than France, Portugal, Netherlands, Bulgaria, Georgia, South Korea, Canada, Russia and Canada. Even though only 14 studies are reviewed, the geographical location covered different countries and regions around the world.
Based on literatures, major studies are focusing on tourist arrivals. From the review article wrote by Song and Li [2] which studied 121 tourism forecasting literatures published between the year 2000 and 2007, the authors commented that “the tourist arrivals variable is still the most popular measure of tourism demand over the past few years.” This could be easily concluded that even though numerous literatures are published, the researchers believed that the tourist arrivals are still necessary to be forecasted even after a decade. This probably due to tourism industry contributes to major incomes for many countries and regions in the world. Therefore, the accuracy of forecasting is important especially for those involved in policy-making and tourism business. Apart from the number of tourist arrivals, two studies measure the number of overnight stays, which are Claveria and Torra [3] and Constantino et al. [4]. The source of data used for forecast in the overall tourism studies are secondary data; the data available from other sources such as governments and public or private organisations. In most of the publications, the researchers forecast on the visitor volume on long-term run such as monthly, quarterly and yearly data and not adapting daily and weekly data.
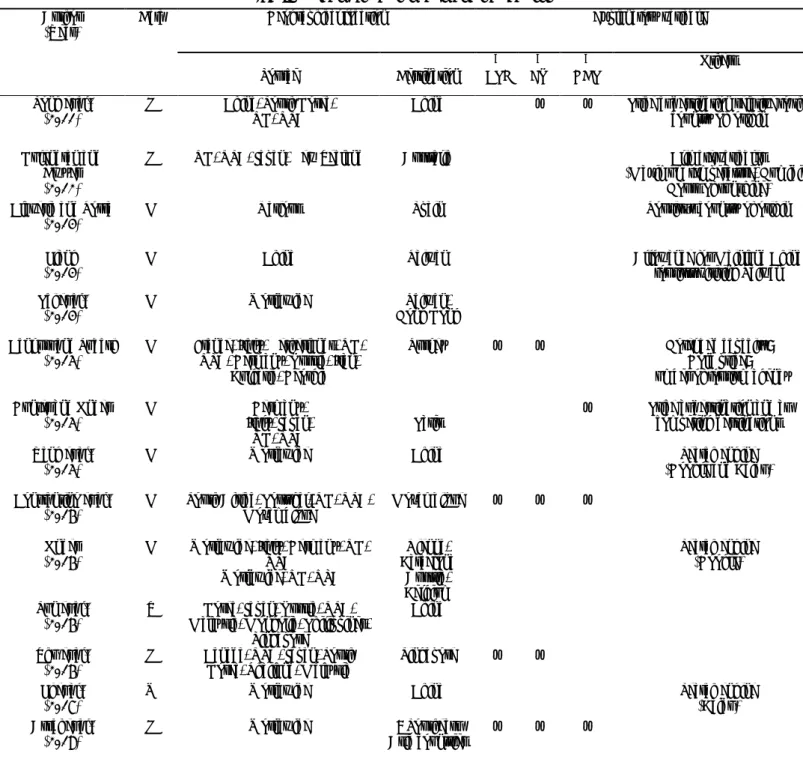
Explanatory variables in the studies comprise of tourist incomes which represented by real gross domestic products (GDP), exchange rate (ER), consumer price index (CPI), tourism price of destination relative to country of origins, living cost as well as the price of competing destination, are considered as the main factors affecting tourism demand [4–9]. Country of origin [3] and allowance for visitors [10] are also chosen as explanatory variable in certain studies. Besides, in the digital technology era, gadgets such as smartphones, computers and tablets are considered as essentials to the people not only in developed countries but also in developing countries. The people only need an internet access to search keywords of their “interest” to explore the content of the respective searched words. Moreover, the keywords are stored and the data from the search trend are accessible from the search engines provider which makes it convenient for the researchers. Hence, the researchers used this opportunity to forecast tourism demand based on the tourism-related keywords and images from the search engines [10–12]. Kulendran and Dwyer [13] mentioned that climate is the explanatory variable for the research in Australia. The climate variables are maximum temperature, humidity and hours of sunshine. Among the studies, two studies concentrated on the tourist arrivals forecasting [14,15] without mentioning the explanatory variables. The literatures are listed in Table 1 and are ordered by year. The table is classified into the following: author, data frequency, geographical location; source and destinations, and explanatory variables.
ICoAIMS 2019
Journal of Physics: Conference Series 1366 (2019) 012111
IOP Publishing doi:10.1088/1742-6596/1366/1/012111
Author
(Year) Data Geographical location Explanatory variable
Source Destination a CPI b ER c GDP Others Song et al.
(2011) Q China, South Korea, UK, USA China x x Price at destination relative to the country of origin
Kulendran and Dwyer (2012)
Q UK, USA, Japan, New Zealand Australia Climate variables
(Maximum temperature, Humidity, Hours of sunshine) Claveria and Torra
(2014) M Various Spain Tourist’s country of origin
Liang
(2014) M China Taiwan Allowance for Mainland China tourists visiting Taiwan
Pai et al.
(2014) M Worldwide Hong Kong Taiwan,
Cankurt and Subasi
(2015) M France, Italy, Netherlands, UK, USA, Germany, Russia, Iran, Bulgaria, Georgia
Turkey x x Hotel bed capacity;
Gold price; Number of tourism agency Gunter and Onder
(2015) M Italy, Japan, Germany,
UK, USA Paris
x Price at destination and at
competing destinations Yang et al.
(2015) M Worldwide China (Google and Baidu) Search engine
Constantino et al.
(2016) M South Africa, Portugal, UK, USA, Mozambique Mozambique x x x
Onder
(2016) M Worldwide, Italy, Germany, UK, USA
Worldwide, UK, USA
Vienna, Barcelona Austria, Belgium Search engine (Google) Sun et al.
(2016) Y Malaysia, Mongolia, Philippines, Korea, Japan, Russia, USA, Singapore
China Zhu et al.
(2016) Q Canada, USA, Japan, South Korea, Thailand, Malaysia Singapore x x Li et al.
(2017) W Worldwide China Search engine (Baidu)
Assaf et al.
(2018) Q Worldwide Asia countries 9 Southeast x x x
ICoAIMS 2019
Journal of Physics: Conference Series 1366 (2019) 012111
IOP Publishing doi:10.1088/1742-6596/1366/1/012111
4
2.2. Methodology
In forecasting tourism demand, quantitative, qualitative methods or the combination of both methods are usually practiced. This paper concentrates only on the quantitative methods. As revealed by Peng et al. [16] in a meta-analysis study, the three sub-categories in quantitative methods that commonly used are time-series models, econometric models and artificial intelligence (AI) methods. Peng et al. [16] also mentioned that traditional regression such as linear and multiple regression are the most commonly used in tourism forecasting before the 1990s. Song and Li [2] concluded in their review studies, 72 literatures used time-series analysis and 71 studies involved econometric models. Meanwhile, 11 studies applied artificial intelligence (AI) methods. From this point, many mathematical scientists and researchers agreed that there will be more studies published in the future involving the mentioned models. In the next section, the time-series model, econometric causal model and AI methods are outlined briefly.
2.2.1. Time-series model. The definition of time-series methods is a prediction approach of the future
trends based on the observations of past and current data available through time. Time-series model is the most common model used in the tourism industry [7,10,11]. Most of previous researches applied time-series method because it is less complex [17]. The reasons this model is still relevant because it requires only previous data of a single variable and cost effective throughout the study as mentioned by Song and Li [2]. Song and Hyndman [18] supported this relevancy by mentioning that pure time-series have been applied for both in generating forecast as main model and as benchmarking purposes to compare with another models. The example of time-series model is the famous Box-Jenkins technique; (seasonal) auto-regressive (integrated) moving average (SARIMA) model and basic structural model (BSM). Besides that, naïve-1 is usually used for benchmarking model as proposed by Önder [12].
2.2.2. Econometric causal model. Econometric causal model is taking over time-series model and
artificial intelligence in forecasting tourism demand because of its advantage of linking the causal relationships between the tourism demand (dependent variable) and its influencing factors (explanatory variables) [2,10,15]. This model aids practitioners in the tourism industry to identify certain aspects involving the development in the tourism area. Based on the literatures, the most influencing factors on tourism demand are exchange rates, living costs and tourists’ income. In addition, the examples of econometric models are correction models, time varying parameter (TVP), structural equations, and vector autoregressive (VAR) [18,19].
2.2.3. Artificial intelligence method. Artificial Intelligence (AI) technique is widely used for forecast
due to the emerging of programming systems recently. Claveria and Torra [3] mentioned that AI techniques have been part of economic modeling and forecasting because of their outstanding performance in handling nonlinear patterns of data sets. These methods are included, for example, genetic algorithms (GA), fuzzy theory, artificial neural networks (ANN), support vector regression (SVR) [1,18]. Taking one of the examples, ANN is defined by Law [20] as a computer software that mimics the human brain in order to deduce or learn from a database.
2.3. Applications of the models in the studies.
The simplicity of the time-series method is a well-known reason of its popular choice among practitioners. Auto-regressive moving average (ARMA) was applied by Yang et al. [11] who attempted to study the correlation between search engine query data and the visitor volume to Hainan province in China. The data collected were from two major search engine; Baidu and Google, where Google is the most popular search engine in the world and Baidu has bigger market share in China. Travel agents are the most popular and earliest search to plan for the trip; which is about 6 months prior. Flight information are searched about four months before and followed by the weather of destination, a month before the trip. This reveals that the tourists search and plan their travel and gain the destination’s information at a different time. Both Baidu and Google outperformed the traditional prediction method; ARMA model
ICoAIMS 2019
Journal of Physics: Conference Series 1366 (2019) 012111
IOP Publishing doi:10.1088/1742-6596/1366/1/012111
by having higher predictive power. The study found that Baidu Index performed better than Google Trends. Li et al. [21] extended the research of Yang et al. [11], by employing the econometric method in forecasting tourism demand with Baidu search engine to Beijing, China. They proposed to use generalised dynamic factor model (GDFM). In order to match the high number of information of search engine data, monthly data is converted to weekly data. Then, the result indicates that GDFM-based index possess a better performance than principal component analysis, PCA-based index and simple ARIMA. This means that there is correlation between the index and the tourism volume into Beijing. Next, using the same theme of big data sources, Önder [12] studied the forecasting accuracy between cities (Vienna and Barcelona) and countries (Austria and Belgium) using Google Trends. The model used in this study is the autoregressive distributed-lag model (ADLM). The other three models include Web search index, image search index, both web and image search indices. Besides, non-seasonal Holt-Winters and naïve-1 are used as the benchmark models. The result revealed that there is not much difference between city and country in forecasting tourism demand using Google Trends. The models with Web and/or image searches performed better for Belgium than Austria. Overall, Vienna tops the other four destinations in terms of forecast with the Web and/or image indices.
In 2014, Liang [10] proposed the combination of seasonal ARIMA (SARIMA) and generalised autoregressive conditional heteroskedasticity (GARCH) (SARIMA-GARCH) to forecast the tourism flow based on the allowance for Mainland China tourists visiting Taiwan. The predictive power of this combination of time-series model and AI technique is compared to other models; regression, exponential smoothing, Holt-winter exponential smoothing and backpropagation neural network with general algorithm approach and it shows superiority over the others. Based on the result analysis, Taiwanese tourism demand shows one cycle seasonality and inconsistent over time. Kulendran and Dwyer [13] studied on seasonal variations in tourist arrivals using basic structural model (BSM). The climate variables are maximum temperature, humidity and hours of sunshine. Quarterly data from September 1975 to September 2009 of tourists from the UK, US and Japan to Australia are collected. The authors concluded that climate variables play an important role for seasonal variations in holiday tourism demand.
Assaf et al. [9] modeled the Bayesian Global Vector Autoregressive (BGVAR) model to forecast regional tourism demand. Nine countries of Southeast Asia are involved in this study. The analysis of results reveals that BGVAR model performs better than another four models, VAR, BVAR, GVAR and the ARMA model. Besides, the authors mentioned that variables of economic growth such as gross domestic products (GDP), exchange rate (ER) and consumer price index (CPI) for a country has a significant effect to its neighbouring countries. Gunter and Önder [7] forecasted international city (UK, US, Germany, Italy, Japan) tourism demand for Paris. To achieve this objective, the models of univariate and multivariate are compared, with the explanatory variables of living cost, price of competing destinations and GDP are taken into account. The results found that the variants of conclusions based on the models employed. Univariate models are suitable for US and UK while multivariate models are better for German and Italy. Overall, even though similar models are used for these four international cities, the authors deduced that univariate models are suitable for US and UK while multivariate models are better for German and Italy in tourism demand forecasting.
The substantial growth in the interest of machine learning leaves a big impact in tourism areas. Hence, the researchers used this opportunity to conduct several studies to predict the tourism demand using AI method. Pai et al. [14] investigate tourism demand forecasting to Taiwan and Hong Kong using novel-hybrid system which is the hybrid of fuzzy c-means (FCM) with logarithm least-squares support vector regression (LLS-SVR). This study concludes that the proposed model, combination of FCM + LLS-SVRGA (genetic algorithm (GA)) has an outstanding performance in terms of forecasting
ICoAIMS 2019
Journal of Physics: Conference Series 1366 (2019) 012111
IOP Publishing doi:10.1088/1742-6596/1366/1/012111
6
Alternatively, the hybrid of time-series and econometric model or time-series and artificial technique can increase the forecasting accuracy. One of the examples is the application of time varying parameter and structural time-series models (TVP-STSM) in Song et al. [5]. Song et al. focused on the forecasting tourist arrivals to Hong Kong with GDP, ER and tourism price of Hong Kong relative to tourist origin as the explanatory variables. They expected that the proposed model can improve the forecasting accuracy when dealing with seasonal data sets. The result shows that TVP-STSM outperformed the other seven competitors which consist of time-series models (Naïve-1, Naïve-2, SARIMA, BSM) and econometric models (TVP, causal structural model (CSM) and ADLM). This means, that the proposed model successfully shows its effectiveness as expected. Sun et al. [15] proposed to forecast the tourist arrivals to China from eight countries by employing Grey-Markov model combined with Cuckoo search algorithm. Yearly data of 1997 to 2013 from China National Tourism Administration were used. They found that the proposed model of Cuckoo-Markov Chain Segment first order one-variable Grey model (CMCSGM (1,1)) outperformed the other models.
Instead of focusing on tourism flows, Constantino et al. [4] studied about overnight stays in Mozambique as the authors desired to achieve the combination of both local and international tourism and monthly data from five major markets such as USA, UK, Portugal, South Africa and Mozambique are collected. Explanatory variables that are considered include ER, CPI and GDP. The analysis is done using the ANN method. General observation shows that the tourist volume increase when there are
religious festivals or events in the country e.g. Christian Easter in April, 10th All African Games and
World Cup in South Africa in 2011 and mid-year 2010 respectively. Besides, the results reveal that the model with CPI of Mozambique, ER of euro, rand and dollar to metical as well as GDP of Portugal and USA enhance the forecasting accuracy of the model. Claveria and Torra [3] compared both time-series models; ARIMA and self-exciting threshold auto-regression (SETAR) with ANN in forecasting tourism demand to Catalonia. The estimation of models is observed by receiving the data of overnight stays and tourist arrivals from various countries. The biasedness arose when the authors mentioned that tourism data may exhibit seasonality characteristics and there is a probability of information loss in the process of filtering the data to eliminate outliers which causing ARIMA becomes dominant compared to ANN. The authors suggested that the accuracy of ANN might improve if original data is used because of ANN’s advantage in handling nonlinear patterns. In summary, ARIMA models performed better followed by SETAR and lastly, ANN. They also found that forecast of tourist arrivals are more accurate than the overnight stays.
2.4. Roles of tourism practitioners in tourism industry
Constantino et al. [4] presented three levels in tourism who benefitted from tourism forecast are: The upper level of economists, who track the growth of economy in tourism sectors, mainly the people from the government to allocate the budget in tourism industry. The middle level is the stakeholders. In order to satisfy the customers’ expectations, they need to plan the products or facilities offered to the tourists. The lower level consists of the organisations who deal directly with the tourists, such as hotels, travel agencies and other services. The concentration of the explanatory variables; real GDP, ER and CPI explains that the upper level are more concerned about forecasting the attendances of tourists to maintain the economic growth of the country. Besides that, observation on the hotel bed capacity and the number of tourism agency [6] are helpful to fulfil the demand of tourists’ accommodation and also to help the tourists in receiving good information about the destinations respectively. The advertisements of local attractions are not only focusing to attract people visiting the destinations, but to aware the locals that the place are welcoming tourists. The organisations from lower level and the locals are the one who are the closest and interact with the tourists and counted in creating a conducive environment. Therefore, every individual in the country are responsible in playing their roles in handling the tourists both directly and indirectly which then, will leave an impression towards them.
ICoAIMS 2019
Journal of Physics: Conference Series 1366 (2019) 012111
IOP Publishing doi:10.1088/1742-6596/1366/1/012111
2.5. Tourism seasonality and its practice
Seasonal variations have been a major effect in the movement of tourists to a region or a country. The two main factors affecting the variations are; natural factors and institutional factors [13]. Natural factors relate to the weather and the seasons in the destination which includes the duration of winter season in a year, humidity or the rainfall. Institutional factors relate to the timing decisions, for example, holiday seasons, school vacations, and religious festivals; Christmas, Ramadhan and Islamic pilgrimage seasons. Kulendran and Dwyer [13] also explained that the combination of both factors lead to the seasonality in tourism. The example of peak season is during summer and school vacations in European region that leads to the high number of outbound and inbound tourists. The latter is usually in January where mostly tourists are returning back home [4]. Tourism practitioners should not only anticipate the peak seasons to serve the tourists but to make use of low season to refine the ideas on the improvements and developments in the tourism structure. The improvements include the promotions, revising budget allocations and also providing a proper training for the staffs especially for governments and any tourism businesses. This is important preparation to encounter any shortcomings and also to avoid any complications in handling the people and the system, which may cause bad impressions to the tourists.
Monthly, quarterly and yearly data are useful for long-term planning. Both weekly and daily data can be approached for short-term forecast, which will affect short-term decision for example, increasing the frequency of buses in the city on the weekend due to high number of users compared to weekdays. However, the limitations when collecting weekly and daily data are because of high cost, time consumption and requires large amount of work. In contrast to the yearly data, monthly data are more favourable to the researchers due to two main reasons. First, higher data frequency can be collected in a year which will affect the forecasting accuracy. Second, it is more convenient and practical for business management to plan ahead the demand in a short period. In fact, the availability of yearly data might be limited as mentioned by Sun et al. [15] as the data before 1997 are not available.
2.6. Combined models and its effectiveness
Combining two models to optimise their advantages and producing more effective model have been widely used by researchers. For example, Song et al. [5] joined econometric model and time-series model; TVP-STSM, to measure the seasonality in tourism demand based on variants of explanatory variables. As the result, the authors manage to prove this model shows its forecasting effectiveness. Sun et al. [15] also proved that the combination of Cuckoo-Markov Chain Segment first order one-variable Grey model, CMCSGM (1,1) shows its robustness in forecasting accuracy compared to the first order one-variable Grey model and Markov Chain first order one-variable Grey model, GM (1,1) and MCGM (1,1). In Section 2.3, there is also stated that the combined method can give better forecasting accuracy. 2.7. Further ideas for studies
Forecasting of the tourism demand remains important to predict the future of tourism. Both researchers and tourism practitioners need to work together and combine ideas in suggesting future studies especially in the areas that need to be revised and improved. The information about the purpose of visiting and duration of visits can be obtained by the combination of qualitative and quantitative forecasting. This indirectly will help policy makers and management to reconstruct their business and marketing plans. Besides, instead of focusing on bigger perspective as a region or a country, the researchers can focus on the smaller areas such as the new tourism products in sports or education tourism or any facilities such as theme park and hotels that can attract visitors. For example, Hsiao et al. [22] studies if the plan of holding a Coffee Festival would affect the increment of the visitors to the theme park. Meanwhile, the emergence of studies based on the internet keywords is also good for
ICoAIMS 2019
Journal of Physics: Conference Series 1366 (2019) 012111
IOP Publishing doi:10.1088/1742-6596/1366/1/012111
8
3. Conclusion
Fast growing and perishable nature of tourism industry are the reason why forecasting is important so that the tourism practitioners will be able to progress together with the development of tourism. Every country and region should pay attention to the tourism industry and benefitting every single culture, modern and historical architecture, religions and nature to attract visitors to the destinations. Close relation of tourism practitioners and researchers are required so that continuous studies about the rising issues in tourism industry will be handled. Accurate forecast can be achieved if the researchers can fully optimized both models and variables. There is no clear reason stated as why each models are chosen in the study apart from stating only on the advantages of the models. The advantage of the first method, time-series model, requires greater range of historical data to increase the accuracy and also very powerful to detect seasonality in the data. The relation between tourist arrivals and explanatory variables can be perceived by employing econometric method. Artificial intelligence is useful in the presence of low number of data. However, from the three methods, it is tough to make a conclusion of which models performed the best because different models are used to analyse different explanatory variables in the studies. The idea of combining two or three methods, if possible, is advisable to maximise the potential in each models for forecasting. The authors acknowledge the limitations in this review. In terms of number of papers, this study includes 14 studies which unable to represent the whole tourism demand forecasting studies published. Finally, this study can contribute as reference to the latest study in tourism demand forecasting by the future researchers.
References
[1] Moro S and Rita P 2016 Worldw. Hosp. Tour. Themes8
[2] Song H and Li G 2008 Tour. Manag.29
[3] Claveria O and Torra S 2014 Econ. Model.36 220–8
[4] Constantino H A, Fernandes P O and Teixeira JP 2016 Tékhne - Rev. Appl. Manag. Stud.14
113–24
[5] Song H, Li G, Witt S F and Athanasopoulos G 2011 Int. J. Forecast.27 855–69
[6] Cankurt S and Subasi A 2015 Balk. J. Electr. Comput. Eng.3
[7] Gunter U and Önder I 2015 Tour. Manag.46
[8] Zhu L, Lim C, Xie W and Wu Y 2016 Curr. Issues Tour.21
[9] Assaf A G, Li G, Song H and Tsionas MG 2018 J. Travel Res.
[10] Liang Y H 2014 Comput. Ind. Eng.74 111–9
[11] Yang X, Pan B, Evans JA and Lv B 2015 Tour. Manag.46 386–97
[12] Önder I 2017 Int. J. Tour. Res.19
[13] Kulendran N and Dwyer L 2012 Tour. Anal.17
[14] Pai P F, Hung K C and Lin KP 2014 Expert Syst. Appl.41 3691–702
[15] Sun X, Sun W, Wang J, Zhang Y and Gao Y 2016 Tour. Manag.52 369–79
[16] Peng B, Song H and Crouch G I 2014 Tour. Manag.45 181–93
[17] Sheldon P J and Var T 1985 J. Forecast.4
[18] Song H and Hyndman R J 2011 Int. J. Forecast.27
[19] Croce V 2016 J. Tour. Futur.2
[20] Law R 1998 Int. J. Contemp. Hosp. Manag.10
[21] Li X, Pan B, Law R and Huang X 2017 Tour. Manag.59 57–66