San Jose State University
SJSU ScholarWorks
Master's Projects Master's Theses and Graduate Research
Spring 6-8-2016
Static and Dynamic Analysis for Android Malware
Detection
Ankita Kapratwar
San Jose State UniversityFollow this and additional works at:https://scholarworks.sjsu.edu/etd_projects
Part of theInformation Security Commons
This Master's Project is brought to you for free and open access by the Master's Theses and Graduate Research at SJSU ScholarWorks. It has been accepted for inclusion in Master's Projects by an authorized administrator of SJSU ScholarWorks. For more information, please contact
Recommended Citation
Kapratwar, Ankita, "Static and Dynamic Analysis for Android Malware Detection" (2016).Master's Projects. 488. DOI: https://doi.org/10.31979/etd.za5p-mqce
Static and Dynamic Analysis for Android Malware Detection
A Project Presented to
The Faculty of the Department of Computer Science San Jose State University
In Partial Fulfillment
of the Requirements for the Degree Master of Science
by
Ankita Kapratwar May 2016
c
○2016
Ankita Kapratwar ALL RIGHTS RESERVED
The Designated Project Committee Approves the Project Titled Static and Dynamic Analysis for Android Malware Detection
by
Ankita Kapratwar
APPROVED FOR THE DEPARTMENTS OF COMPUTER SCIENCE SAN JOSE STATE UNIVERSITY
May 2016
Dr. Mark Stamp Department of Computer Science Dr. Thomas Austin Department of Computer Science Fabio Di Troia Department of Computer Science
ABSTRACT
Static and Dynamic Analysis for Android Malware Detection by Ankita Kapratwar
Static analysis relies on features extracted without executing code, while dynamic analysis extracts features based on code execution (or emulation). In general, static analysis is more efficient, while static analysis is often more informative, particularly in cases of highly obfuscated code. Static analysis of an Android application can rely on features extracted from the manifest file or the Java bytecode, while dynamic analysis of Android applications can deal with features involving dynamic code loading and system calls that are collected while the application is running. In this research, we analyzed the effectiveness of combining static and dynamic features for detecting Android malware using machine learning techniques . We also carefully analyze the robustness of our scoring technique.
ACKNOWLEDGMENTS
I would like to express my gratitude to my advisor Dr. Mark Stamp for his continuous encouragement, patience, faith and for creating a very positive atmosphere for completing my thesis.
In addition, I want to thank my thesis committee members, Dr. Thomas Austin and Fabio Di Troia, for monitoring my progress and providing me a valuable feedback. Last but not the least, I would like to thank my parents Ashok Kapratwar and Vandana Kapratwar and my sister Aditi Kapratwar Gokhale for their constant love and support all these years.
TABLE OF CONTENTS CHAPTER
1 Introduction . . . 1
2 Background . . . 4
2.1 Overview of Android OS . . . 4
2.2 Types of Android application malware . . . 6
2.2.1 Trojan . . . 6
2.2.2 Spyware . . . 6
2.3 Application detection techniques . . . 7
2.3.1 Static Analysis . . . 7
2.3.2 Dynamic Analysis . . . 8
2.4 Machine Learning Algorithms . . . 9
2.4.1 Random Forest . . . 9
2.4.2 J.48 . . . 9
2.4.3 Naive Bayes . . . 9
2.4.4 Simple Logistic . . . 10
2.4.5 Sequential Minimal Optimization . . . 10
2.4.6 IBk . . . 10
3 Methodology . . . 12
3.1 Dataset . . . 12
3.2 Feature extraction . . . 13
3.2.2 Dynamic Analysis . . . 17
4 Experiments . . . 21
4.1 System Configurations . . . 21
4.2 Evaluation Metrics . . . 21
4.3 Discussion of Experiment results . . . 22
4.3.1 Machine Learning Algorithm Analysis . . . 22
4.3.2 System calls data analysis . . . 23
4.3.3 Permission based data analysis . . . 24
4.3.4 Combination of static and dynamic analysis data . . . 24
4.3.5 Reducing the count of features . . . 24
5 Conclusion and Future Work . . . 28
APPENDIX A ROC Curves for Permission Vector . . . 32
A.1 Machine Learning Algorithm Analysis - Permission features . . . . 32
B ROC Curves for System Calls app:b . . . 37
LIST OF TABLES
1 Dataset Description . . . 12 2 Permission Scores . . . 16 3 System Configurations . . . 22
LIST OF FIGURES
1 Mobile malware applications statistics 2010-2014 . . . 2
2 Android architecture . . . 4
3 Flow chart of permission feature extraction . . . 14
4 Flow chart of system calls feature extraction . . . 19
5 AUC of Machine Learning Algorithms for Static and Dynamic Analysis . . . 23
6 ROC for high ranked system calls feature vectors . . . 23
7 ROC for high ranked permission feature vectors . . . 24
8 Static and Dynamic Analysis Features Combined Result . . . 25
9 AUC for reduced number of permission . . . 26
10 AUC for reduced frequency count of system calls . . . 26
11 Reduced permission and frequency count . . . 27
A.12 ROC for Random Forest -100 Trees, Machine Learning Algorithm - Permission Feature . . . 32
A.13 ROC for Random Forest 10 Trees, Machine Learning Algorithm -Permission Feature . . . 32
A.14 ROC for J.48 Machine Learning Algorithm - Permission Feature . 33 A.15 ROC for NaiveBayes Machine Learning Algorithm - Permission Feature . . . 33
A.16 ROC for Simple Logistic Machine Learning Algorithm - Permission Feature . . . 33
A.17 ROC for BayesNet TAN Machine Learning Algorithm - Permission Feature . . . 34
A.18 ROC for BayesNet K2 Machine Learning Algorithm - Permission Feature . . . 34 A.19 ROC for SMO PolyKernel Machine Learning Algorithm -
Permis-sion Feature . . . 34 A.20 ROC for SMO NPolyKernel Machine Learning Algorithm -
Per-mission Feature . . . 35 A.21 ROC for IBk 1 Machine Learning Algorithm - Permission Feature 35 A.22 ROC for IBk 3 Machine Learning Algorithm - Permission Feature 35 A.23 ROC for IBk 5 Machine Learning Algorithm - Permission Feature 36 A.24 ROC for IBk 10 Machine Learning Algorithm - Permission Feature 36 B.25 ROC for Random Forest 10 Trees, Machine Learning Algorithm
-System Calls Feature . . . 37 B.26 ROC for J.48 Machine Learning Algorithm - System Calls Feature 37 B.27 ROC for NaiveBayes Machine Learning Algorithm - System Calls
Feature . . . 37 B.28 ROC for Simple Logistic Machine Learning Algorithm - System
Calls Feature . . . 38 B.29 ROC for BayesNet K2 Machine Learning Algorithm - System Calls
Feature . . . 38 B.30 ROC for SMO NPolyKernel Machine Learning Algorithm - System
Calls Feature . . . 38 B.31 ROC for IBk 5 Machine Learning Algorithm - System Calls Feature 39 B.32 ROC for IBk 10 Machine Learning Algorithm - System Calls Feature 39
CHAPTER 1 Introduction
Smartphone malware can come in the form of Trojan, botnet or spyware. Such applications are created with malicious intent, and can, for example, acquire a user’s private data [23]. Today, the majority of smartphones are based on the Android Operating System (OS). According to a recent report by International Data Corpo-ration, Android dominates the smartphones market, with a market share of 88.2% in 2015 [24]. As announced at a press event by Google, there are approximately 1.4 billion active Android phone users.
The large market for smartphones has drawn the attention of cybercriminals [25]. Android has various third party application stores which makes it easy for cybercrim-inals to repackage Android applications with malicious payloads. Such cybercrimcybercrim-inals develop malicious software which is often designed to gain access to information within a smartphone.
Reports estimate that during 2010 to 2014, the number of mobile malware ap-plications have grown exponentially and most of this malware has targeted Android systems. Figure 1 shows a rise in the number of total mobile malware applications and the share of Android malware applications [1, 2]. According to a report by Kaspersky Labs, there were 291,800 new mobile malware programs that emerged in the second quarter of 2015, which is 2.8 times more than in the first quarter. In addition, there were 1 million mobile malware installation packages in the second quarter, which is 7 times more than the first quarter of 2015 [20].
Figure 1: Mobile malware applications statistics 2010-2014
analysis and detection of Android malware has become an important research area. Many Android malware detection and classification techniques have been proposed and analyzed in the literature.
To collect the features used when analyzing malware, we can rely on static or dynamic analysis (or some combination thereof). Static analysis refers to features that are collected without executing the code. In contrast, in dynamic analysis we execute (or emulate) the code. Static analysis is usually more efficient, but dynamic analysis can be more informative, and dynamic analysis is often thought to be less susceptible to code obfuscation.
Static analysis of Android malware can rely on Java bytecode extracted by dis-assembling an application. The manifest file is also a source of information for static analysis. One disadvantage of static analysis is that it is blind to dynamic code load-ing, that is, static analysis fails to deal with parts of the code that are downloaded during execution. In contrast, dynamic analysis can examine all code that is actually executed by an application.
on static and dynamic features. The static features we consider are permissions extracted from the manifest file, while our dynamic analysis is based on system calls extracted at runtime. We analyze the effectiveness of these techniques individually and in combination. We also consider a robustness analysis, and carefully consider the interplay between these two approaches.
The paper is organized as follows. In Chapter 2, we discuss relevant background related to the Android OS. This chapter also includes a literature survey of various static and dynamic analysis techniques. Chapter 3 discusses the dataset used and the methodology used to extract static and dynamic features. Chapter 4 provides our experimental results. Finally, Chapter 5 highlights our conclusion and suggestions for the future work.
CHAPTER 2 Background 2.1 Overview of Android OS
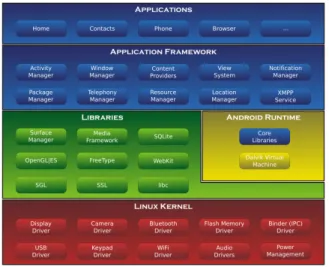
In the Figure 2 [5], the Android software stack items in green are the written in C/C++ and the blue ones are written in Java which executed using the Dalvik VM [5]. Here the Android Linux Kernel is a modified Linux Kernel which includes features like wake locks (memory management for optimizing the memory consump-tion), Binder IPC Drivers and other features which play a key role in mobile embed-ded platform [21]. The libraries item plays a vital role in optimizing CPU, memory consumption as well as the audio and video codecs for the device.
Figure 2: Android architecture
Android runtime is the managed runtime that is capable to compiling Android applications during the installation time. This component comprises of Dalvik vir-tual machine and core libraries of Java. During an Android application compilation, the Java bytecode is converted into Dalvik bytecode (Dalvik executable code) using dx tool, which is executed on Dalvik virtual machine. The classes.dex file consists
of the whole repackaged application code after removing the duplicate parts in the code. The Dalvik virtual machine is more powerful compared to the Java Virtual Machine in terms of multitasking ability. Application framework is an abstract layer to develop applications using the underlying reusable libraries and packages. Some major components of this layer are [8]:
∙ Activity Manager: This provides an interface for the users to interact with the
applications
∙ Intent/Notification Manager: This acts as messaging objects to facilitate the
inter-process communication with components
∙ Content Manger: They provide an interface to pass data in from process to
another process
∙ Telephony Manager: This provides telephony information like the IMEI number.
Applications are built on top of the Application framework which provide an interaction between users and the device. These are distributed as Android Package files (.apk). This .apk file is a signed ZIP file which consists of the classes.dex file, external libraries and AndroidManifest.xml file describing the capabilities of the An-droid application. The AnAn-droidManifest.xml file provides information about various application components. Various application components like the activities, services, intents, broadcast receivers must be declared in this xml file. This file contains a list of permissions which the appplication requires to access certain device components and the minimal API version necessary to run this application.
A system call is a mechanism with which a user application can request a service which belongs to the operating system kernel. Information flows within the
multi-layered Android architecture. For instance, an Android application can request for sending a text message. The request is transformed into a request to the Telephony Manager service which is later received by the Android runtime. Here the request is transformed to a set of library calls. These library calls are then transformed into the system calls to the Android Linux kernel. An example of the system call would be sendmsg(). Similarly, after the system calls are executed, information flows back in the reverse direction.
2.2 Types of Android application malware 2.2.1 Trojan
Android malware applications which belong to this category pretend to be either as installers or SMS malware apps. The former apps trick the user to install, by designing icons or user interfaces’ of a benign installer. In reality, these apps display a service level agreement during installation which obtains permissions to users personal information like phone number and run a background process which sends SMS’s to premium rate numbers. The later kind of trojans simply have a single activity with a button, which on click sends premium rate SMS’s
2.2.2 Spyware
This category of malicious applications intend to gain access to users private information and send it to a private server. The main purpose is to steal information like phone location, bank or credit card details, passwords, text messages, contacts, online browsing activity, etc. A more complicated malware can also trigger activities which are issued by the remote server.
2.3 Application detection techniques 2.3.1 Static Analysis
Static analysis is a technique to detect malicious behavior by analyzing the code segments. This technique is carried out without running the application in an An-droid emulator or device. However, this technique has a major drawback of code obfuscation and dynamic code loading. The advantages of static analysis is that the cost of computation is low, less time consuming and low resource consumption. How-ever,code obfuscation makes the pattern matching a major drawback in detecting the malicious behavior. There are two main detection techniques for Static Analysis -Misuse Detection and Anomaly detection.
2.3.1.1 Misuse Detection
This technique is also known as signature based detection technique. An appli-cation is detected as a malware if it matches a sequence of instructions or policies.
In the research by Feng et al. [14] the authors have presented Appopscopy, a semantic language based signatures for detecting malicious Android applications. In this approach, signatures are created for each malware family. Signature matching is achieved using the inter component call graphs to decide the control flow properties. Further, the results are enhanced using the static taint analysis to decide if the data flow properties. However, in this approach, it is very complicated to define a signature that is able overcome the drawback of code obfuscation and dynamic code loading problems. In another research by Fuchs et al. [15] implement Scandroid where the security specific features are extracted along with data flow to check the with the ma-licious signatures. Zhou et al. [29] extracts permissions and applies heuristic filtering to detect Android application malware.
2.3.1.2 Anomaly Detection
This technique relies machine learning algorithms to detect malicious behavior. Features extracted from known malware are used to train the model and predict a novel or unknown malware.
Abah et al. [5] proposes a machine learning approach relies on K-Nearest Neigh-bor classifier to train the model with features such as incoming/outgoing SMS and calls, Device status and running applications/processes. In another research by Aung et al. [21] proposes a framework which relies on machine learning algorithms to for Android malware detection using features obtained from Android events and permission based to learn and classify malware and benign applications.
2.3.2 Dynamic Analysis
Dynamic analysis is a detection technique aimed at evaluating malware by exe-cuting the application in a real environment. The main advantage of this technique is it detects dynamic code loading and records the application behavior during run-time. This technique fails to determine the amount of code that is executed while running the application. There are chances that the applications can fail to execute the malicious code while recording the features. Additionally, this technique is hard to implement as compared to static analysis, due to the overhead of executing the application.
Aphonso et al. [4] has proposed a dynamic analysis technique which records the frequency of system calls and API calls to detect the malware and goodware. The main drawback of this system is that it will detect a malware only in case the application meets certain API level. Taindroid [13] is another dynamic analysis system which captures the network data for analyzing applications. In another research by
the authors of Maline [12] have proposed a malware detection tool, based on tracing system calls and classify them based on machine learning algorithms.
2.4 Machine Learning Algorithms 2.4.1 Random Forest
This is an ensemble learning algorithm which classifies based on information aggregated from individual learner. This algorithm relies on the bagging approach where each classifier is built individually by working with a bootstrap sample of the input data. Normally in a decision tree algorithm, the decision is made considering all the features. However, in Random Forest Algorithm the decision is made by randomly selecting the features. This random selection, improves the scalability when there are large number of features. In addition, it reduces the interdependence between the feature attributes and makes the results is less susceptible to noise.
2.4.2 J.48
J.48 is based on the implementation of the decision tree algorithm C4.5. In this algorithm, a node for the tree is created by splitting the dataset. The data with highest information gain is chosen which effectively splits the into class variable. After choosing the data, a decision node is created to split based on the data chosen. The data obtained by splitting is the recursed and then added as children of the decision node.
2.4.3 Naive Bayes
In this algorithm we assume that all the features are independent of each other. The classification is based on the calculating the maximum probability of the
at-tributes which belong to a particular class. Let 𝑟 = (𝑟1, 𝑟2, , 𝑟𝑛) belong to class 𝐶, and 𝑃(𝐶) be the probability of the class and 𝑃 𝐶|𝑟 be the probability of feature for
a given class, then an application is considered as a goodware if,
𝑃(𝐶 =𝑏𝑒𝑛𝑖𝑔𝑛|𝑅=𝑟)> 𝑃(𝐶 =𝑠𝑢𝑠𝑝𝑖𝑐𝑖𝑜𝑢𝑠|𝑅 =𝑟)
2.4.4 Simple Logistic
This is an ensemble learning algorithm. To evaluate the base learners this ap-proach utilizes logistic regression using simple regression functions. Similar to linear regression, it tries to find a function that will fit the training data well by computing the weights that maximizes the log-likelihood of the logistic regression function. In this algorithm, the training phase is relatively longer than the testing phase.
2.4.5 Sequential Minimal Optimization
This is an impletmentation of SVM in Weka. In this algorithm the classification is computed using a separator between two classes and then maximizing the width of the margin. SMO calculates the maximization by splitting the problem into smaller parts. Each problem consists of optimizing two multipliers in order to maximize or minimize the solution. The algorithm solves the smallest first and adds these to the overall optimization. The classifier uses either a Gaussian or a polynomial kernel to map the data.[17]
2.4.6 IBk
This instance based learner is a lazy algorithm. The instance based learner saves all of the training samples and compares the test samples to each of the members
of the training set until it finds the closest match. This algorithm is implemented in Weka as a k-nearest neighbor classifier. The Weka implementation sets Euclidean distance as the default distance algorithm.
CHAPTER 3 Methodology
This chapter describes the Malware and benign dataset used in the project. The next section details the methodology used to extract features from the dataset. The last section describes the implementation details of the approach.
3.1 Dataset
The benign dataset was created by self since there was no standard dataset available. The benign dataset .apk files was collected randomly from the Google Play Store [16] which is considered as the official market with the least possibil-ity of malware applications. We obtained the malware dataset from the authors of Drebin [10]. This dataset mainly consists of applications obtained from various Android markets, Android websites, malware forums, security blogs and Android Malgenome Project [30]. The malware dataset is based on results acquired from Virtotal [28] service which aggregates information from different antivirus engines, website scanners and URL analyzers. Table 1 gives a brief about the dataset used for experiments.
Table 1: Dataset Description
Application type Total number of applications Year of extraction
Malware 103 August 2010- October 2012
3.2 Feature extraction
The appropriateness of extracted features determines the accuracy of the emu-lation results. The features are extracted in two phases described below.
3.2.1 Feature extraction using Static analysis
Android applications come in an Android package (.apk) archive. This .apk file is nothing but a zip bundle of AndroidManifest.xml, classes.dex and other resources and folders. For extracting these features we initially need to reverse engineer the .apk files. This is done using the apktool [28]. The AndroidManifest.xml file contains a lot of features that can be used for static analysis. One of the main feature is the permissions requested by the application. The AndroidManifest.xml contains the list of permissions required by the application. In order to extract these permissions, regular xml parsers cannot be used since Android has its own proprietary binary xml format. We designed a new xml parser capable of extracting permission feature from the AndroidManifest.xml file of the application.
3.2.1.1 Feature vector
Let 𝑅 be a vector containing a set of 135 Android permissions. For
ev-ery 𝑖𝑡ℎ application in the Android apps dataset, we generate a binary sequence
𝑅𝑖 ={𝑟1, 𝑟2, . . . , 𝑟𝑗} and 𝑟𝑗 = ⎧ ⎪ ⎪ ⎨ ⎪ ⎪ ⎩ 1, if 𝑗𝑡ℎ permission exists . 0, otherwise. (1) The permissions identified are stored as a binary sequence of 0 or 1 in a comma separated form. This sequence typically contains comma separated permission bits
which denote 1 if the corresponding permission is present or 0 if it is absent. In addition, we consider a variable 𝐶 where 𝐶 ∈ {𝑀 𝑎𝑙𝑤𝑎𝑟𝑒, 𝐵𝑒𝑛𝑖𝑔𝑛}. This variable 𝐶
indicates -1 for malware application and 1 for benign application. Following is an example of the permission vector for malware and benign application:
0,0,0,0,0,0,0,1,0,0,0,0,0,0,0,0,0,0,0,0,0,0,0,0,0,0,0,0,0, 0,0,0,0,0,0,0,0,0,0,0,0,0,0,1,0,0,0,0,0,0,0,0,0,0,0,0,0,0, 0,0,0,0,1,0,0,0,0,0,0,0,0,0,0,0,0,0,0,0,0,0,1,0,0,0,0,0,0,1
Sample Benign Application Permission Vector 0,0,0,0,0,0,0,1,0,0,0,0,1,0,0,0,0,1,0,0,0,0,0,0,0,0,0,0,0, 0,0,0,0,0,0,0,0,0,0,0,0,0,0,1,0,0,1,0,0,0,0,0,0,0,1,0,0,0, 0,1,0,0,1,0,0,0,0,0,0,0,1,0,0,0,0,1,0,0,0,0,1,0,0,0,0,0,0,-1
Sample Malware Application Permission Vector
Figure 3: Flow chart of permission feature extraction
Figure 3 explains the feature extraction method. Following are the steps to extract data
1. Create a dataset of all malware and benign files
2. Reverse engineer the android applications in the dataset. This reverse engineer-ing is achieved usengineer-ing the APK tool.
3. We extract the permission request features from the AndroidManifest.xml file using our special AndroidManifest xml parser
4. The permissions obtained for each Android application is then sent to the Fea-ture vector generator program where the application is feaFea-ture vector is gener-ated using the method discussed above
5. We finally build a permission vector dataset for all the applications and store it in an ARFF [9] file format.
3.2.1.2 Feature selection
For the feature vector obtained, there are many permissions which were redun-dant and never used in any of the Android applications. These redunredun-dant permissions are removed since they have the capacity of adverse effects for the classification pro-cess. Thus, the main aim of feature selection is to reduce the feature set in such a way that the new set of features give similar results as the original set. For this purpose, we have used the feature selection method known as Information Gain. Ac-cording to this scoring method, similarities in the pattern of permissions appearing in the Android application is calculated and then higher weights are provided to the permissions which are most effective.
The information gain of each permission is calculated by
InfoGain(𝐶, 𝑟𝑗) = entropy(𝐶)−entropy(𝐶|𝑟𝑗)
Here𝑒𝑛𝑡𝑟𝑜𝑝𝑦(𝐶)is the information entropy. Also,𝐴and𝐵 are random variables and
entropy(𝐴) = ∑︁
𝑖
𝑃(𝑎𝑖)𝐼(𝑎𝑖)
Conditional probability is calculates as
entropy(𝐴|𝐵) = ∑︁
𝑖,𝑗
𝑃(𝑎𝑖, 𝑏𝑗) log
𝑃(𝑏𝑗)
𝑃(𝑎𝑖, 𝑏𝑗)
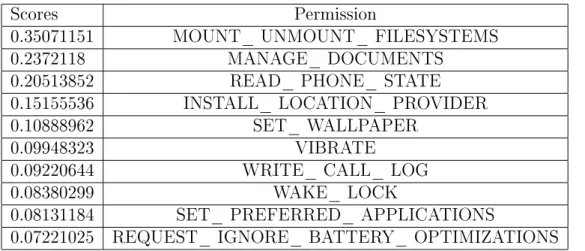
Table 2 shows the list of top 10 permissions and corresponding scores using the above method. Here higher values indicate more information gained from the attribute.
Table 2: Permission Scores
Scores Permission
0.35071151 MOUNT_ UNMOUNT_ FILESYSTEMS
0.2372118 MANAGE_ DOCUMENTS
0.20513852 READ_ PHONE_ STATE
0.15155536 INSTALL_ LOCATION_ PROVIDER
0.10888962 SET_ WALLPAPER
0.09948323 VIBRATE
0.09220644 WRITE_ CALL_ LOG
0.08380299 WAKE_ LOCK
0.08131184 SET_ PREFERRED_ APPLICATIONS
0.07221025 REQUEST_ IGNORE_ BATTERY_ OPTIMIZATIONS
After calculating the above scores using Information Gain method we started to reduce the number of 135 permission in such a way that we obtain an AUC greater than or equal to the original set. On applying the information gain algorithm, we excluded those permissions which scored 0 and obtained a subset of 99 top ranked features. We further reduced this feature set by 87 top permissions since it fetched a higher AUC than the original set.
3.2.2 Dynamic Analysis
A system call is the mechanism through which a user interacts with the kernel in the operating system to request an action to be performed. Similarly in Android users interact with the operating system through the system calls. In this approach, the system calls have been extracted in the Dynamic analysis phase. In order to achieve this we have made use of the Android Emulator which comes along with the Android Studio [7]. Here we execute each Android application in separate emulator and record the system calls as soon as the application is installed in the emulator. This methodology records the frequency of all the successful system calls recorded. The log file contains percentage of the time utilized by the system call, seconds of the time for which the system call executed, count of the successful execution of the system call, number of errors in the interaction of system call and the name of the system call.
We connect to the emulator instance using the Android Debug Bridge (adb) [6] that serves as a command line tool, found in Platform tools folder of Android SDK. This adb comes along with a Monkey tool [27] which is able to emulate the UI interactions. The Monkey tool uses a pseudo random number to generate a sequence of events into the emulator. These events are usually clicks, volume interactions, touches, etc. which trigger system calls. The frequency of system calls is recorded using a monitoring tool Strace [26]
The emulation is carried out in the following way for each Android application: 1. Open the AVD Manager in Android Studio and click on Create New Device.
Here, we create a clean copy of emulator instance with specifications mentioned in 3 and run it
2. After the emulator is up and running , open terminal and navigate to the platform tools folder of the Android SDK. Type ‘adb help’ to check if the adb is working normally
3. Next, use the command ‘adb devices’ which lists the name of the emulator ID which is running.
4. To install the Android application into the emulator type the command ‘adb in-stall ApplicationName.apk’ or create a batch file to and change the apk file name. You will now see the application file installed in the emulator.
5. Enter the emulator shell by typing ‘adb -s emulator-5646 shell’ on the terminal. 6. Begin the application and check the process id using the ps <package name>
command.
7. Use ‘strace -P <ProcessID> -c -o <path in emulator>Filename.csv <package name>’ This will begin recording the system calls
8. Start MonkeyRunner using the command ‘adb shell p <package name> v 500 -s 42’ Thi-s will create automatic event-s in application through the u-ser interface and simultaneously Strace will record the frequency count of the system calls generated
9. After the MonkeyRunner stops, pull the log file from command prompt us-ing ‘adb pull <path in emulator> <path in destination>’
We repeated the same process for all the applications in different emulator instance and gained the log files.
Figure 4: Flow chart of system calls feature extraction 3.2.2.1 Feature Extraction
The frequency representation of system calls carries information about its be-haviour [11]. A particular system call can be utilized more in malicious application than the one in benign application. The system call frequency representation that we have used captures this behavior of malicious Android application.
Let 𝜁 = {𝑠1, 𝑠2, . . . , 𝑠𝑛} be a list of all available system calls in an Android OS which belongs to a given processor architecture. Then, from the system call logs obtained for each application, we define a sequence𝜎 of length 𝑛, that represents the
frequency of captured system calls in a log file.
Let 𝜎= (𝑞1, 𝑞2, . . . , 𝑞𝑛),where 𝑞𝑖 ∈𝜁 is𝑖th observed system call in the log file. The feature vector obtained with this method, is passed to the feature extrac-tion phase. In this representaextrac-tion, each attribute in a feature vector represents the frequency of occurrence of a system call in the strace log. Using this 𝜎 sequence,
we define a feature vector 𝑥 = [𝑥1, 𝑥2, . . . , 𝑥|𝜁|], where 𝑥𝑖 is equal to the frequency of system call𝑠𝑖 ∈𝜎
Similar to the permission vector, we consider a variable 𝐶 where 𝐶 ∈
for benign application. Following is an examples of the malware and benign system calls frequency bits extracted.
0,0,0,0,0,0,0,2500,0,0,0,0,0,0,0,0,0,0,0,0,0,0,0,1500,0,0,0,0,0,0,1100,0,0,0,0,0,0,0,800,0,0,0,0,1,32, 0,0,753,0,0,0,36,0,0,0,0,0,0,0,0,1,0,0,0,0,0,60,0,0,0,90,0,0,0,0,0,0,0,1,0,0,0,0,298,0,0,966,0,56,0, 0,0,0,0,0,0,0,756,0,0,0,0,0,0,0,0,0,0,0,0,0,0,0,150,0,0,0,0,0,0,110,0,0,0,0,0,0,0,0,0,0,0,0,1,0, 0,0,660,0,0,0,0,0,0,0,0,0,0,0,0,55,0,0,0,0,0,60,0,0,0,0,0,0,0,0,0,0,0,1,0,0,0,0,298,0,0,0,87,1,0, 0,0,0,0,0,0,0,82,0,0,0,0,0,0,0,0,0,0,0,0,0,0,0,1500,0,0,0,0,0,0,1250,0,0,0,0,0,0,0,885,0,0,0,0,65,0, 0,0,0,0,0,0,25,0,0,0,0,0,0,0,1,0,0,0,0,0,0,0,0,0,9,0,0,0,0,0,0,0,1,0,0,0,0,298,0,0,0,82,1,0,8, 0,0,0,0,0,0,0,0,0,0,0,0,0,0,0,0,0,0,0,0,0,0,0,2580,0,0,0,0,0,0,1100,0,0,0,0,0,0,0,800,0,0,0,0,1,0 0,0,0,0,0,0,00,0,0,0,0,0,0,0,0,1,0,0,0,0,0,60,0,0,0,900,0,0,0,0,0,0,0,1,0,0,0,0,0,0,426,0,0,65,1
Sample Benign Application System Calls Vector
0,0,0,0,0,0,0,8400,0,0,0,0,0,110,0,0,0,0,0,0,0,0,0,1500,0,0,0,0,0,0,1100,0,0,0,0,0,0,0,800,0,0,0,0,1,32, 0,0,6523,0,0,0,368,0,0,0,0,0,0,0,0,1,0,0,0,0,0,60,0,0,0,90,0,0,0,0,0,0,0,0,0,0,0,0,298,0,0,966,0,5600,0, 0,0,0,0,0,0,0,756,0,0,0,0,0,0,0,0,0,0,0,0,0,0,0,150,0,0,0,0,0,0,110,0,0,0,0,0,0,0,0,0,0,0,0,1,0, 0,0,0,0,0,0,0,0,0,0,0,0,0,0,0,5865,0,0,0,0,0,600,0,0,0,0,0,0,0,0,0,0,0,1,0,0,0,0,298,0,4260,0,0,0,0, 0,0,0,0,0,0,0,82,0,0,0,0,0,0,0,0,0,0,0,0,0,0,0,1500,0,0,0,0,0,0,1250,0,0,0,0,0,0,0,885,0,0,0,0,6500,0, 0,0,2238,0,0,0,250,0,0,0,0,62,0,0,1,0,0,0,0,0,60,0,0,0,9,0,0,0,0,0,0,0,1,0,0,0,0,298,0,5024,0,8785,1,0,0, 0,0,0,0,0,0,0,0,0,0,0,0,0,0,0,0,0,0,0,0,0,0,0,1500,0,0,0,0,0,0,1100,0,0,0,0,0,0,0,800,0,0,0,0,0,252 0,0,0,0,0,0,0,0,0,0,0,0,0,0,0,0,0,0,0,0,0,0,0,0,0,0,0,0,0,0,0,0,0,0,0,0,0,0,98,0,426,0,0,855,−1
CHAPTER 4 Experiments
This chapter aims at discussing the experiments performed and the results ob-tained. For experiments in all three cases were evaluated. Firstly, we carried out experiment to choose correct machine learning algorithm. Secondly, the system call frequency data was analyzed for training and testing. Thirdly, static analysis was car-ried out using only the permission data for training and testing. Lastly, training and testing was carried out by combining the permission data and system calls frequency data. The system calls frequency results were not as effective as the permissions data. However, the effect of combining both the feature vector fetched a better result. 4.1 System Configurations
4.2 Evaluation Metrics
Accuracy of a test is evaluated on how well the test is able to distinguish be-tween a malware and goodware. An ROC efficiently demonstrates the effectiveness of machine learning classifier by varying the threshold. This is plotted considering as a sensitivity or True positive rate (TPR) versus specificity aslo known as False positive rate (FPR). The color represents the threshold value for a each pair of true positive rate and false positive rate. If a particular instance highly belongs to the class, its threshold will be closer to 1. Hence, for a higher threshold of instance, darker will be the color in the ROC. The Area under the Curve (AUC) is the percentage of correct test results in while classifying the testing data. AUC value of 1 represents a perfect test whereas the one with 0.5 represents the least accurate test [18].
Table 3: System Configurations Host Machine
Model Dell Inspiron 15R
Processor Intel CoreTM i7-4500U CPU @ 1.80GHz ÃŮ 4
RAM 8.00 GB
System Type 64bit OS
Operating System Windows 10
Guest Machine
Operating System Image Ubuntu 12.04 LTS
Memory 226.00 GB
System Type 32bit OS
Android Emulator Configuration Platform Android Studio 1.5.1
Device Nexus 5
Target Android 4.4.2- API level 19
CPU/ABU Intel Atom(x86)
RAM 1536 MiB
SD Card 200 MiB
4.3 Discussion of Experiment results
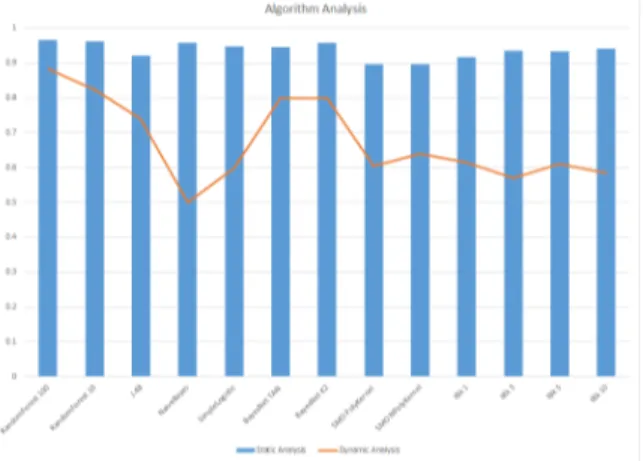
4.3.1 Machine Learning Algorithm Analysis
In order to decide with the machine learning algorithm to be used for our analysis we carried out this experiment. Figure 5 shows the AUC values of different algorithms analyzed with individual system calls and permission bits. We have considered the feature vector obtained before using the feature selection algorithm.
In this experiment we train the model with feature vector obtained from Sec-tion 3.2 of the paper. Figure 5 shows the results of AUC obtained for several machine learning algorithms in Weka. The main aim of this experiment is to compare the results obtained from several algorithms with Random Forest to verify the selection of correct machine learning algorithm. From the experiment results we can see that the Random Forest Algorithm with 100 trees, has given an AUC value closer to 1.0. When trained with static data we saw average accuracy of the results. Hence in the
next experiment we have tried a combination of both to detect unknown malware.
Figure 5: AUC of Machine Learning Algorithms for Static and Dynamic Analysis
4.3.2 System calls data analysis
In this experiment, we train the model with the feature vector obtained from Section 3.2. Figure 6 shows the AUC obtained for several machine learning algorithms in Weka.
Figure 6: ROC for high ranked system calls feature vectors
From the above experiment we observe that the system calls feature alone doesnot give a high Android malware detection accuracy. In next experiment, we evaluate the static analysis technique.
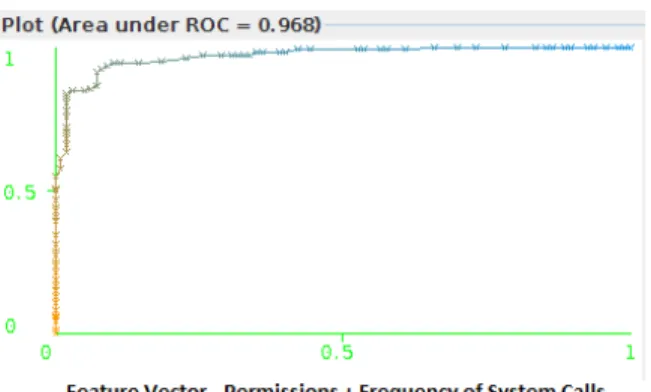
4.3.3 Permission based data analysis
In this section, we analyze the results obtained on static analysis. We use the scoring technique from Section 3.2.1.2 for permission based analysis and found that the 87 highest ranked features have produced an AUC of 0.972.
Figure 7: ROC for high ranked permission feature vectors
The Random Forest Algorithm has given the AUC value closer to 1.0. When trained with static analysis data we saw an increase in the accuracy of the results. Hence in the next experiment we have tried a combination of static and dynamic to detect unknown malware
4.3.4 Combination of static and dynamic analysis data
In this experiment we analyzed that the effectiveness of combining the feature vector obtained from dynamic analysis as well as static analysis. The combination of both has built a great result in classifying an application as goodware or malware. Figure 8 gives an ROC of the features obtained.
4.3.5 Reducing the count of features
The main aim of this experiment was to find out for the modifications of sys-tem calls and permissions,in such a way that the Android malware application was
Figure 8: Static and Dynamic Analysis Features Combined Result
undetectable. We modified the feature vectors by randomly reducing the permissions for the malware samples by 1 each time, until the maximum was reached (15 in our dataset). Figure 9 shows the results of AUC values obtained when the permissions are reduced each time. The blue line shows the results of 10 fold cross validation and the red line for 66% split of the whole data. We carried out similar process for the system calls and ignored the frequency of system calls for each malware sample by 1 each time, until the maximum was reached. Figure 10 shows the results of AUC values obtained when the system calls are reduced each time. We recomputed the scores and found that the detection rate was highly affected when the permissions were reduced by 3 upto the maximum count. In such cases the malware detection rate was reduced considerably from 0.97 to 0.5. However, there was no major effect in the detection rate while considering the system calls.
Figure 9: AUC for reduced number of permission
CHAPTER 5
Conclusion and Future Work
The main aim of this project was to evaluate the effectiveness of combining the static and dynamic analysis for detecting Android application malware. We have observed that the static analysis individually is more effective than the dynamic analysis. Additionally, the combination of both these analysis techniques have proven to be very effective than the individual ones. With our approach, we can successfully detect Android malware of unknown family with an AUC of 0.972. Our results also demonstrate the effectiveness of Random Forest classifier, to detect Android malware. The results have proven to be very effective. However, we conclude that this approach has opportunities which could be more explored. For future work, the com-bined feature set can be evaluated using Support Vector Machine technique. We can also evaluate the effectiveness of the above approach using a larger dataset. We have also faced a problem where the Monkey Runner fails to execute the part of malicious code or completely crashes. We need to research more on code coverage during dy-namic analysis. We can even generate a model in future which detects the malware application and classifies into malware families. Serveral machine learning algorithms can also be evaluated for combination of the feature vector and compare the results obtained from the current work. We can dig more into the network statistics, CPU and memory utilization while obtaining the dynamic features. Finally, we can de-sign a malware application which can break the above feature vectors and make it undetectable.
LIST OF REFERENCES
[1] 2011 Mobile Threats Report,Retrieved March 23, 2016, from https: //www.juniper.net/us/en/local/pdf/additional-resources/jnpr-2011-mobile-threats-report.pdf
[2] 2015 Mobile Threat Report, Retrieved March 23, 2016, from https://www. pulsesecure.net/lp/mobile-threat-report-2014/
[3] J. Abah, O. Waziri,M. Abdullahi, U. Arthur and O. Adewale, A machine learn-ing approach to anomaly-based detection on Android platforms,International Journal of Network Security and Its Applications, 7(6):15–35,2015
[4] V. M. Afonso, M. F. de Amorim, A. R. A. Gregio, G. B. Junquera and P. L. de Geus, Identifying Android malware using dynamically obtained features,Journal of Computer Virology and Hacking Techniques, 11(1):9–17, 2015
[5] Analysis of Android Architecture, Retrieved October 11, 2015, from https://os.itec.kit.edu/downloads/sa_2010_braehler-stefan_android-architecture.pdf
[6] Android Debug Bridge, Retrieved October 12, 2015, from http://developer. android.com/tools/help/adb.html
[7] Android Studio Overview, Retrieved October 12, 2015, from http://developer. android.com/tools/studio/index.html
[8] App Manifest, Retrieved October 19, 2015, from http://developer.android. com/guide/topics/manifest/manifest-intro.html
[9] ARFF(book version), Retrieved November 16, 2015, from https://weka. wikispaces.com/ARFF+%28book+version%29
[10] D. Arp, M. Spreitzenbarth, M. Huebner, H. Gascon and K. Rieck, Drebin: Effi-cient and Explainable Detection of Android Malware in Your Pocket,21th Annual Network and Distributed System Security Symposium (NDSS), February 2014 [11] I. Burguera, U. Zurutuza and S. Nadjm-Tehrani,Proceedings of the 1st ACM
workshop on Security and privacy in smartphones and mobile devices, 15–26, 2011
[12] M. Dimjasevic, S. Atzeni,I. Ugrina and Z. Rakamari, Evaluation of Android Malware Detection Based on System Calls, Retrieved December 11, 2015, from http://www.cs.utah.edu/docs/techreports/2015/pdf/UUCS-15-003.pdf
[13] W. Enck, P. Gilbert, S. Han, V. Tendulkar, B. Chun, L. P. Cox, J. Jung, P. Mc-Daniel and A. N. Sheth, TaintDroid: An Information-Flow Tracking System for Realtime Privacy Monitoring on Smartphones,ACM Transactions on Computer Systems, 32(2):1–29, 2014
[14] Y. Feng, S. Anand, I. Dillig and A. Aiken, Apposcopy: semantics-based detection of Android malware through static analysis,Proceedings of the 22nd ACM SIG-SOFT International Symposium on Foundations of Software Engineering,576– 587,2014
[15] A. P. Fuchs, A. Chaudhuri and J. S. Foster, SCanDroid: Automated Security Certification of Android Applications, Technical Report CSTR-4991, Depart-ment of Computer Science, University of Maryland,College Park, November 2009 [16] Google Play, Retrieved September 8, 2015, from https://play.google.com/
store?hl=en
[17] J. B. Guptil, Examining application components to reveal android malware, Re-trieved on March 12,2016 from, https://www.google.com/webhp?sourceid= chrome-instant&ion=1&espv=2&ie=UTF-8#
[18] D. J. Hand, R. J. Till, A Simple Generalisation of the Area Under the ROC Curve for Multiple Class Classification Problems, 45(2):171-186, 2001
[19] Juniper networks Mobile Threat Center Third Annual Mobile Threats Re-port: March 2012 through March 2013, Retrieved March 23, 2016, from http://www.juniper.net/us/en/local/pdf/additional-resources/3rd-jnpr-mobile-threats-report-exec-summary.pdf
[20] Kaspersky Lab Reporting: Mobile malware has grown almost 3-fold in Q2, and cyberespionage attacks target SMB companies, Retrieved March 23, 2016, from http://www.kaspersky.com/about/news/virus/2015/Kaspersky- Lab-Reporting-Mobile-malware-has-grown-almost-3-fold-in-Q2-and-cyberespionage-attacks-target-SMB-companies
[21] Linux Kernel, Retrieved September 16, 2016, from https://source.android. com/devices/#Linuxkernel
[22] Mobile Security, Retrieved March 23, 2016, from http://home.mcafee.com/ advicecenter/?id=ad_ms_wimm&ctst=1
[23] M. M. Saudi, F. Ridzuan, N. Basir, N. F. Nabila, S. A. Pitchay and I. N. Ahmad, Android Mobile Malware Surveillance Exploitation Via Call Logs: Proof of Con-cept,17th UKSIM-AMSS International Conference on Modelling and Simulation, 176–181, 2015
[24] Smartphone OS Market Share, 2015 Q2, Retrieved March 23, 2016, from http: //www.idc.com/prodserv/smartphone-os-market-share.jsp
[25] M. Spreitzenbarth, T. Schreck, F. Echtler, D. Arp and J. Hoffmann, Mobile-Sandbox: combining static and dynamic analysis with machine-learning tech-niques, International Journal of Information Security,14(2):141–153,2014 [26] strace(1) - Linux man page, Retrieved December 11, 2015, from http://linux.
die.net/man/1/strace
[27] UI/Application Exerciser Monkey, Retrieved January 10, 2016, from http:// developer.android.com/tools/help/monkey.html
[28] Virustotal, Retrieved October 23, 2015, from https://www.virustotal.com
[29] Y. Zhou, Z. Wang, W. Zhou, and X. Jiang and P. Ning, Detecting malicious apps in official and alternative Android markets, Proceedings of the second ACM conference on Data and Application Security and Privacy,2012
[30] Y. Zhou and X. Jiang, Dissecting Android Malware: Characterization and Evolu-tion, Proceedings of the 33rd IEEE Symposium on Security and Privacy, 95–109, 2012
APPENDIX A
ROC Curves for Permission Vector
A.1 Machine Learning Algorithm Analysis - Permission features
Figure A.12: ROC for Random Forest 100 Trees, Machine Learning Algorithm -Permission Feature
Figure A.13: ROC for Random Forest 10 Trees, Machine Learning Algorithm -Permission Feature
Figure A.14: ROC for J.48 Machine Learning Algorithm - Permission Feature
Figure A.15: ROC for NaiveBayes Machine Learning Algorithm - Permission Feature
Figure A.16: ROC for Simple Logistic Machine Learning Algorithm - Permission Feature
Figure A.17: ROC for BayesNet TAN Machine Learning Algorithm - Permission Feature
Figure A.18: ROC for BayesNet K2 Machine Learning Algorithm - Permission Feature
Figure A.19: ROC for SMO PolyKernel Machine Learning Algorithm - Permission Feature
Figure A.20: ROC for SMO NPolyKernel Machine Learning Algorithm - Permission Feature
Figure A.21: ROC for IBk 1 Machine Learning Algorithm - Permission Feature
Figure A.23: ROC for IBk 5 Machine Learning Algorithm - Permission Feature
APPENDIX B
ROC Curves for System Calls app:b
B.1 Machine Learning Algorithm Analysis - System Calls features
Figure B.25: ROC for Random Forest 10 Trees, Machine Learning Algorithm -System Calls Feature
Figure B.26: ROC for J.48 Machine Learning Algorithm - System Calls Feature
Figure B.27: ROC for NaiveBayes Machine Learning Algorithm - System Calls Fea-ture
Figure B.28: ROC for Simple Logistic Machine Learning Algorithm - System Calls Feature
Figure B.29: ROC for BayesNet K2 Machine Learning Algorithm - System Calls Feature
Figure B.30: ROC for SMO NPolyKernel Machine Learning Algorithm - System Calls Feature
Figure B.31: ROC for IBk 5 Machine Learning Algorithm - System Calls Feature