Procedia Technology 25 ( 2016 ) 464 – 472
ScienceDirect
2212-0173 © 2016 Published by Elsevier Ltd. This is an open access article under the CC BY-NC-ND license (http://creativecommons.org/licenses/by-nc-nd/4.0/).
Peer-review under responsibility of the organizing committee of RAEREST 2016 doi: 10.1016/j.protcy.2016.08.133
Global Colloquium in Recent Advancement and Effectual Researches in Engineering, Science and
Technology (RAEREST 2016)
Effective Iris Recognition System
Tossy Thomas,Anu George,Dr.K P Indira Devi*
Mtech,ACIS,Rajiv Gandhi Institute of Technology,Kottayam,686501,India
Assistant professor,Department of ECE,Rajiv Gandhi Institute of Technology,Kottayam,686501,India
Abstract
Biometric identification has provided a robust technique for proving identity and has become the standard in identity authentication and access control. Iris recognition is a prudent biometric identification system with promising results in the security systems area. In this work, our system introduces a more accurate method called RANSAC (Random Sample Consensus) for fitting ellipse around non circular iris boundaries. It can locate iris boundaries more accurately than the methods based on Hough transform. Also we used Daugman’s rubber sheet model for iris normalisation and elliptic unwrapping, and correlation filter based matching for intra class and inter class distance evaluation.PSR(Peak Side Lobe Ratio) is the similarity measure used for matching templates. By these the recognition process is improved compared to Daugman’s method. WVU database is used for conducting experiments and promising results are obtained.
© 2015 The Authors.Published by Elsevier Ltd.
Peer-review under responsibility of the organizing committee of RAEREST 2016.
Keywords:RANSAC;PSR,Normalisation;WVU
* Tossy Thomas. Tel.: 918547519239 E-mail address:[email protected]
© 2016 Published by Elsevier Ltd. This is an open access article under the CC BY-NC-ND license (http://creativecommons.org/licenses/by-nc-nd/4.0/).
1.Introduction
Biometrics refers to metrics related to human characteristics. Biometric recognition can be used as a form of identification and access control. A biometric recognition system is used to identify individual in a group that are under surveillance. Biometric identifiers are often classified as physiological characteristics and behavioural characteristics. Physiological characteristics are those related to the shape of the body like fingerprint, DNA ,palm veins, iris recognition, face recognition and so on. The second category includes the pattern behaviour of an individual like voice, gait etc.
Iris recognition is nowadays considered as one of the most accurate biometric recognition techniques. Iris recognition is user friendly since the iris can be captured from a certain distance. Critical step in the recognition process is the segmentation of the iris pattern in the input eye image. This process has to deal with the fact that the iris region of the eye is a relatively small area, wet and constantly in motion due to involuntary eye movements. Moreover, eyelids, eyelashes and reflections are occlusions of the iris pattern that can cause errors in the segmentation process. As a result, an incorrect segmentation can produce errors in biometric recognitions and seriously reduce the final accuracy of the system. After J Daugman proposed the first automatic iris recognition system, a lot of commercial iris recognition systems were developed to deal with eye images[8,9] and in most cases, iris segmentation is a challenge in the case of noisy images.In the previous works, great improvement have been made in constrained environment. Recent researchers have provided great attention on recognition in less constrained imaging condition. General framework for iris feature representation based on ordinal measure has been presented in [10].The challenging phase in all these previous works lies in the segmentation phase where iris boundary has to be localised with great accuracy.This paper studies iris recognition in the less constrained imaging conditions. In order to improve the segmentation accuracy,we are using an algorithm called RANSAC in conjunction with direct ellipse fitting[2] .
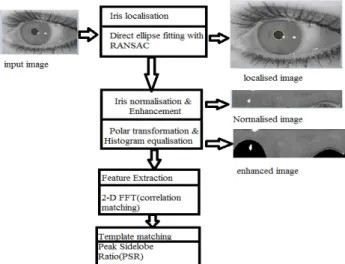
Random Sample Consensus (RANSAC)[2]is used for localizing iris outer boundaries with ellipses which results in improvement over existing approaches. After locating iris region, we will normalise the segmented region and it is used as template for matching. In order to compare two templates correlation is performed and PSR(peak Side Lobe Ratio) is used as a similarity measure in recognition process.DET curve is used for comparing its performance with Daugman’s method[1],where Hough transform is used for locating iris boundary. The different steps in implementing the proposed work is illustrated in Fig.1and each step is explained in detail in the following section.
Fig 1.Flow diagram of the proposed algorithm
2.Iris Localization
This step is to detect the inner boundary (the boundary between the iris and the pupil) and the outer boundary (the boundary between the iris and the sclera) of input image. i.e., we have two steps to evaluate:
a) Pupil localization
b) Iris outer boundary localization
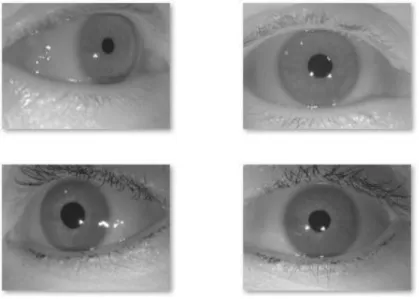
The proposed algorithm was evaluated on WVU Iris image database. The West Virginia University 5 developed an iris image database (WVU) comprised of 1852 images from 380 different eyes. Images of the WVU database captured under less constrained imaging conditions, incorporate several types of noise, such as iris obstructions, poor focused and off-angle iris images. There are few iris images with significant regions affected by specular and lighting reflections, which is found to be the most common type of noise because of the natural light imaging environments. In this work , 4 iris image of 18 different people were used. Among the 4 images 2 of them are frontal images and the other two are off angle images (15-degree and 30- degree).The examples of such images of a person is shown in Fig.2
Fig 2.Examples of iris images from WVU database 2.1.Pupil Localization
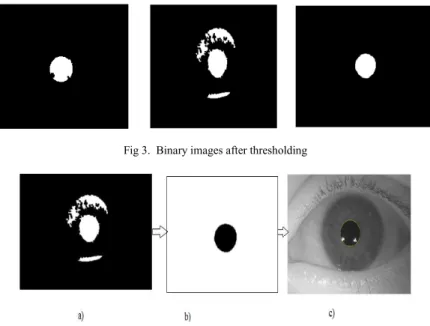
The proposed segmentation algorithm begins by finding the darkest region in the iris image. Around 1/8th to 7/8th portion of the iris is pupil, depending on contraction and dilation of the pupil .Select the pixels in the corresponding area and find those coordinates having black pixel(minimum intensity).Set all the coordinates other than the selected coordinates to black pixel(intensity=0) and the selected coordinates are converted to intensity value of 1(white pixel) resulting a binary image which may contain noisy region due to light reflections and presence of eyelashes which is shown in Fig 3.Certain morphological operations such as dilations and erosion are applied to remove the above said noise. Dilations fills up holes to remove the illumination inside the pupil region and erosion removes the spurious pixels which are dark spots caused by eyelashes. Dilation image is subtracted from the erosion image to obtain pupil boundary. This image is used as a mask for pupil localization. These are shown in Fig 4.Thus we locate the pupil boundary in the input image.
Fig 3. Binary images after thresholding
Fig.4. (a) Binary image after thresholding; (b) Binary image after dilation and erosion(mask image); (c) Pupil localization 2.2 . Iris Outer Boundary Localisation
It consists of two main steps: a) Apply Canny edge detection b) Fit ellipse using RANSAC
Canny edge detection method is applied to iris image .In the canny edge detected image, by applying morphological operation called area open,we removed all connected components having fewer pixels(< 50 pixels).Then the edge link algorithm is applied on the edge map and we get the list of connected edge points. Select the longest one that has the maximum number of edge points for fitting ellipse around the iris boundary. The edge map may be very noisy that it may contain many edge points ,which are not true ones on the boundary due to occlusion or noise. In non-ideal imaging conditions the outer iris boundary is non circular and so we use ellipse to fit the outer iris boundary, which is more accurate.
Due to the presence of noisy edge points, a direct application of existing methods, for ellipse fitting may get poor results. Hence, we use a robust method based on the RANSAC[2]for ellipse fitting. The RANSAC is able to estimate the parameters of a mathematical model from a set of observed data which contain many noisy or error points. It is an iterative algorithm that seeks the maximum number of inliers (accurate data) by leaving out the error points as many as possible. At each step, we need to estimate accurately the ellipse from a set of points, and the method proposed by Fitzgibbon[3] is used which is a direct method for ellipse fitting by solving a generalized eigen-system.
Given a set of edge points obtained by edge detection (Canny).The RANSAC algorithm[2] proceeds by N iterations. In each iteration, we randomly select n points in T to form a subset Tk, where n = 6 is the minimum
number of points required to estimate an ellipse. Let rzc,T,a,b = 0( r(z) = 0 for short) be the estimated ellipse, where the
subscripts zc, T, a, b denote the centre, orientation angle and major and minor axes of the ellipse, respectively. The ellipse r(z) = 0 is considered invalid if zc lies outside the minimum bounding box of the black region in the binary
image or (the quantity |a/b − 1| is larger than some threshold. This quantity measures the ellipticity of the outer iris boundary. The underlying assumption is that the value of ellipticity should not be too large; we empirically set this threshold value as 0.1. If the ellipse is invalid, then we set the persistent set Sk to be empty and proceed to the next
step; otherwise, we compute the persistent set Sk as follows:
where T \ Tk is the complement of Tk in T.
rzc,T,(1−)a,(1−)b(zi) = 0 denotes an ellipse with the parameters zc,T,(1−)a,(1 − )b and rzc,T,(1+)a,(1+)b(zi) = 0 has
analogous meaning. These two ellipses define an elliptical annulus centred at rzc,T,a,b(zi) = 0 whose width is
controlled by the parameter . The edge points located within the annulus are considered to belong to the persistent set. We set to be a small value so that the true edge points that are polluted by error points are tolerable. In the experiment = 0.1 is empirically determined.
After N iterations, we select, among the persistent sets Sk, k=0,1,. . . ,N-1, the one that has the maximum number of
elements as the optimal persistent set Sk. We finally estimate the ellipse with all the points in the set Sk as the final
result. By using this final point, fit the outer iris boundary using direct ellipse fitting method[3] and the results are shown in Fig.5.
Fig. 6 shows example of the iris boundaries localization. It shows localization results using the proposed algorithm (yellow curve) and the method based on circular Hough transform (green curve). It is clear that the former describes the boundary more accurately than the latter.
The computational complexity of the algorithm is O(KCo), where Co denotes the cost involved in one iteration that mainly concerns the ellipse fitting. There is no upper bound on the time the RANSAC takes to converge [2]. As we increase the number of iterations (N), the probability to obtain the optimal solution increases, but the computational cost as well. In our implementation, we set the iteration number N to 50 as a trade off between the optimal solution and the computational cost.
Fig.5. Iris inner and outer boundary localised image
Fig.6.Iris outer boundary localisation result using the proposed algorithm (yellow curve) and using the method based on circular Hough transform (green curve).
3.Iris Normalisation and Enhancement
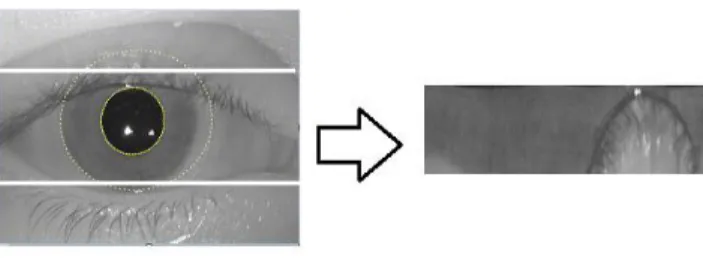
Normalisation maps each pixel in the localized iris region from the Cartesian coordinates to polar coordinates. The non-concentric polar representation is normalized to a fixed size rectangular block. In the experiments, the size of the normalized iris image is 64 × 360 pixels. An iris image normalisation result is illustrated in Fig 7 and we used Daugman’s rubbersheet method for normalisation[7].
Fig .7.An example of iris normalisation
The normalized iris image has low contrast and non-uniform illumination caused by the light source position. So a mask is developed for the normalized iris image to normalize brightness and increase the contrast of the image based on histogram equalization. Using this mask normalised image enhanced and the effect of non-uniform illumination is reduced and a well-distributed texture image is obtained. Fig.8. shows the enhanced iris image after local histogram equalization.
4. Feature Extraction Using Cross Correlation Method
Correlation is a measure of the degree to which two variables agree, not necessary in actual value but in general behaviour. The two variables are the corresponding pixel values in two images, template and source. Template matching techniques compare portions of images against one another. Sample image may be used to recognize similar objects in source image. So in order to measure the similarity measure between two images, find the cross correlation between the reference image and test image. The cross correlation function is given in the equation (2).
C(W)=³ r(x).s(x-W)dW (2)
Determine the cross-correlation between the reference and test images for all possible shifts. When the target scene matches the reference image exactly, output is the autocorrelation of the reference image.If the input r(x) contains a shifted version s(x−xo) of the reference signal, the correlator will exhibit a peak at x = xo. If the input does not contain the reference signal s(x), the correlator output will be low. Instead of calculating the cross correlation in time domain, we can use Fast Fourier Transform of the two images and then take its inverse Fourier transform.
c(W ) = IFFT([FFT(r(x)].[conjugate(FFT(s(x))]) (3)
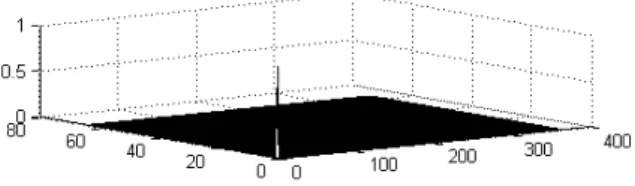
where c(W) is the correlation output ,r(x) is the reference image and s(x) is the test image. The output correlation plane should contain a sharp peak near the origin if the test image belongs to the same iris class. The output correlation plane contains multiple insignificant lobes(peaks) if the test image is not belongs to the that class and they are illustrated in Fig.9 & Fig.10.
. Fig .9.Correlator output when the test image belongs to the same class
Fig .10. Correlator output for different class
5. Template Matching Using PSR as Similarity Measure
peak sharpness of the correlation plane is measured using Peak to Sidelobe Ratio(PSR) as defined in Equation (4). An authentic iris image produces a large PSR while an imposter image yields a very low PSR.Here fix a particular value of PSR as threshold,such that the test images with PSR greater than the threshold belongs to the same class and otherwise it doesn’t belongs to that class.
PSR=(Peak-mean)/variance (4)
6. Experiments and Discussion
The experiments were performed using WVU iris image database and 4 images from 18 different persons are used for the experiment. We first evaluated intra-class distance for all the possible combinations of genuine attempts (4C2×18 = 108 attempts). Next, we evaluated the inter-class distance for 18C2 = 152 impostor attempts, where we take a single image for each eye and make all the possible combinations of impostor attempts.
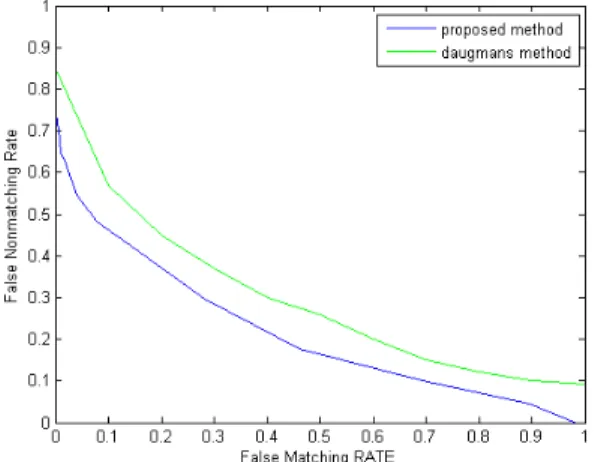
We use the Detection Error Trade-off (DET) curves for analyzing the performance of the proposed work. The DET curves generally plot false non-match rate (FNMR) vs. false match rate (FMR) or false rejection rate (FRR) vs. false acceptance rate (FAR) plots. Unlike the Equal Error Rate that considers only a pair of FAR and FRR, the DET curve describes variation of FRR versus FAR and thus can give a detailed trade off analysis of a biometric system.
x False Rejection Rate (FRR): The fraction of the number of rejected genuine attempts divided by total number of genuine attempts.
x False Acceptance Rate (FAR): The fraction of the number of falsely accepted imposter attempts divided by total number of imposter attempts.
The values of FRR and FAR are threshold dependent. By adjusting the threshold, a list of FRR and FAR values is plotted on the DET curve. A high FAR will increase the risk of granting access to unauthorized personnel. On the other hand, a high FRR will cause inconvenience to user access as the probability of rejecting a genuine attempt is increased. Unlike the Equal Error Rate that considers only a pair of FAR and FRR, the DET curve describes variation of FRR versus FAR and thus can give a detailed tradeoff analysis of a biometric system. The curve in Fig.11. shows that the proposed method is more accurate compared to Daugman’s[4],[6] method of iris recognition. Also Iris localization in the proposed method provided promising result, 99% of iris inner boundary and 98% of iris boundary are properly localised using RANSAC and ellipse fitting method.
Fig .11.DET curves for proposed and Daugman’s method 7.Conclusion
In this proposed system a better method for iris recognition in less constrained imaging conditions is obtained. In these cases, the iris images may be severely degraded because of the off-angle imaging, pose variation, image blurring, illumination changes, specular highlights and noise. Ellipse fitting through RANSAC provided a better
result in iris localisation compared to Hough transformed result. It is found that performance of our system is better than the Daugman’s iris recognition system. Although much results has been accomplished in this thesis, there are still some improvements for future work. The algorithm was evaluated on WVU iris database. The database has limited number of iris images. More experiments with more iris images from diversified populations can be conducted in the future instead of using data base. Multiple matching algorithms can also be used so as to improve the performance rate.
References
[1] John G. Daugman.,” High Confidence Visual Recognition of Persons by a Test ofStatistical Independence”, IEEE Trans. Pattern Anal. Machine Intell., Vol. 15 ,No.11,2003
[2] Fischler, M.A., Bolles, R.C,.” Random sample consensus: A paradigm for model fitting with applications to image analysis and automated cartography” Commun.ACM 24, 381–395,1981.
[3] Fitzgibbon, A., Pilu, M., Fisher, R.B., Direct least square fitting of ellipses”, IEEE Trans. Pattern Anal. Machine Intell. 21,pp. 476– 480,1999
[4] Daugman, J., ”New methods in iris recognition. IEEE Trans. Systems, Man, Cybernet”,2007,pp. 1167–1175. [5] Wildes, R.P.,”Iris recognition:an emerging biometric technology”, In: Proc. IEEE 85,1997, pp. 1348–1363. [6] Daugman J., ”How iris recognition works”, IEEE Trans. CSVT, vol. 14, no. 1,2004, pp.21-30.
[7] Daugman, High confidence visual recognition of persons by a test of statistical independence, Trans. Pattern Anal. Mach. Intell.15(11),1993 1148–1161.
[8] E. Newton, P.J. Phillips, Meta-analysis of third party evaluations of iris recognition, Biometrics Theory Appl. 2007, 1–4. [9] J. Daugman, The importance of being random: statistical principles of iris recognition, Pattern Recognit. 36 (2) 2003, 279–291. [10] Sun, Z., Tan, T., 2009. Ordinal measures for iris recognition. IEEE Trans. Pattern Anal.Machine Intell. 31, 2211–2226.