Insulin Glulisine Compared to Insulin Aspart
and to Insulin Lispro Administered by Continuous
Subcutaneous Insulin Infusion in Patients with Type 1
Diabetes: A Randomized Controlled Trial
Arianne C. van Bon, M.D.,1Bruce W. Bode, M.D.,2 Caroline Sert-Langeron, M.D.,3J. Hans DeVries, M.D., Ph.D.,1and Guillaume Charpentier, M.D.4
Abstract
Background:In a previous pilot study comparing insulin glulisine (GLU) with insulin aspart (ASP) administered by continuous subcutaneous insulin infusion (CSII), GLU-treated patients did show a trend toward fewer catheter occlusions compared with ASP-treated patients. Here we performed a randomized open-label, three-way crossover, controlled multicenter study comparing GLU with ASP and insulin lispro (LIS).
Methods:Subjects with type 1 diabetes were allocated to one of three treatment orders—GLU-ASP-LIS, ASP-LIS-GLU, or LIS-GLU-ASP—with each insulin used for 13 weeks. The study was designed to demonstrate the superiority of GLU over ASP and LIS on unexplained hyperglycemia and/or perceived infusion set occlusion. A prespecifiedPvalue of 0.025 was considered significant to correct for multiple testing.
Results:Percentages of subjects with at least one unexplained hyperglycemia and/or infusion set occlusion were not significantly different between GLU and ASP (68.4% [62.7–74.1%] vs. 62.1% [56.2–68.1%],P¼0.04) and GLU and LIS (68.4% [62.7–74.1%] vs. 61.3% [55.4–67.3%],P¼0.03). No differences were seen in hemoglobin A1c at end point, most points of the seven-point glucose curves, severe hypoglycemia, and symptomatic ketoacidosis. The overall rate of hypoglycemia with a plasma glucose level below 70 mg/dL per patient-year was significantly different between GLU and ASP (73.84 vs. 65.01,P¼0.008) and GLU and LIS (73.84 vs. 62.69,P<0.001). Insulin doses remained unchanged during the trial.
Conclusions:GLU was not superior to ASP and LIS with no significant difference seen among GLU, ASP, and LIS in CSII use with respect to unexplained hyperglycemia and/or perceived catheter set occlusion. GLU was associated with a higher frequency of symptomatic hypoglycemia, possibly because of slight overdosing, as previous trials suggested lower insulin requirements when GLU is initiated in type 1 diabetes.
Introduction
I
nsulin glulisine(GLU) is a rapid-acting insulin analogwith a molecular structure that differs from human insulin at two sites: asparagine B3 is replaced by lysine, and lysine B29 is replaced with glutamic acid. Also, GLU has a zinc-free formulation, and polysorbate 20 is added as a stabilizing agent. Therefore the insulin monomers are more stable, and polysorbate 20 prevents fibril formation.1Less fibril formation may be important in continuous subcutaneous insulin infu-sion (CSII) to low the frequency of catheter occluinfu-sion.
Hoogma and Schumicki2 examined the safety of GLU compared with insulin aspart (ASP) administered by CSII in a 59-patient, 12-week, controlled, open-label, randomized, par-allel-group pilot trial. A trend toward fewer catheter occlusions and unexplained hyperglycemia was noted in GLU-treated patients compared with ASP-treated subjects. The occurrence of catheter occlusion was probably underestimated as time to catheter change was fixed to 48 h (according to the label, but in daily practice patients often wait much longer) and the limited sample size of the study prevented definitive conclusions re-garding superiority to be drawn.
1
Department of Internal Medicine, Academic Medical Center, Amsterdam, The Netherlands. 2Atlanta Diabetes Associates, Emory University School of Medicine, Atlanta, Georgia. 3
sanofi-aventis, Paris, France.
4Department of Internal Medicine, Endocrinology and Diabetology, Centre Hospitalier Sud Francilien, Corbeil, France. This trial is registered at ClinicalTrials.gov with clinical trial registry number NCT00607087.
ªMary Ann Liebert, Inc. DOI: 10.1089/dia.2010.0224
The main objective of the current study was to demonstrate the superiority of GLU over ASP and insulin lispro (LIS) in terms of unexplained hyperglycemia (>300 mg/dL) and/or perceived infusion set occlusion. Therefore, GLU was com-pared in a randomized open-label multicenter study to ASP and LIS administered by CSII in subjects with type 1 diabetes in a three times 13-week crossover design.
Subjects and Methods
This 39-week multinational multicenter open-label cross-over randomized controlled trial was conducted in 44 centers in 12 countries (the United States, Israel, Spain, France, Sweden, Austria, The Netherlands, Italy, Hungary, the United Kingdom, Australia, and South Korea). All ethical committees approved the protocol. Patients gave written informed con-sent. The trial was monitored and carried out according to Good Clinical Practice and the principles of the Declaration of Helsinki.
Subjects
Adult subjects with type 1 diabetes mellitus treated with insulin for at least 2 years and CSII for at least 6 months were included. Other inclusion criteria were use of the same insulin analog, external pump, and type of infusion set for at least 3 months before study entry, hemoglobin A1c (HbA1c) below 8.5%, and body mass index (BMI) below 35 kg/m2. Exclusion criteria included total daily dose of insulin of >90 U/day, infection at the injection site in the last 3 months, severe ke-toacidosis requiring hospitalization in the last 6 months, ac-tive proliferaac-tive retinopathy, pregnancy, impaired renal function (creatinine 1.5 mg/dL), impaired liver function (transaminases more than three times the upper limit), and treatment with corticosteroids or medication that influences insulin sensitivity in the last 3 months before the first visit.
Design
After a 2-week run in period, subjects were randomized by block randomization per center with block size unknown to the investigator, using a telephone intelligence voice response system.
Subjects were allocated to one of three treatment orders— GLU-ASP-LIS, ASP-LIS-GLU, or LIS-GLU-ASP—with each period of treatment with GLU, ASP, or LIS lasting for 13 weeks of treatment (Fig. 1). The starting dose of the first in-vestigated insulin was identical to the patient’s dose when entering the trial. Glucose control was optimized on an indi-vidual basis. Recommendations for glucose targets were made according to the guidelines of the American Diabetes Association: preprandial glucose values between 90 and 130 mg/dL and 2-h postprandial glucose value below 180 mg/dL.3Also, replacing the infusion set every 48 h was recommended, but this was not mandatory.
The trial comprised five clinical visits, including a screening visit, three visits to provide the study insulins, and a con-cluding visit, as well as four telephone contacts, a week after the clinical visits. Subjects were instructed to record their seven-point blood glucose profiles and insulin doses on two consecutive days before each visit as well as before the tele-phone contacts.
Outcome measures
Primary outcome measure was unexplained hyper-glycemia (>300 mg/dL) and/or perceived infusion set occlusion.
Secondary outcome measures were perceived infusion set occlusion, unexplained hyperglycemia, HbA1c, the percent-age of patients having an HbA1c<7%, seven-point plasma glucose (PG) profiles, hypoglycemic episodes, episodes of asymptomatic ketonemia and ketoacidosis, insulin doses, treatment period (3x13 weeks)
insulin glulisine insulin aspart insulin lispro insulin aspart insulin aspart insulin lispro insulin glulisine follow-up period screening period dose adjustment period
* or clinical visit if needed Sequence 1
Sequence 2 Sequence 3
Extra phone calls at request phone call* phone call* phone call* phone call* insulin change insulin change V1 Visits
Time week - 2 week 0 week 1 week 13 week 14 week 26 week 27 week 39 week 40
Screening Randomization Fnd of study
V2 V3 V4 V5 V6 V7 V8 V9 dose adjustment period dose adjustment period insulin glulisine insulin lispro
time to change of the infusion set local reactions at the site of infusion, and serious adverse events.
HbA1c was measured at each clinic visit by ion-exchange high-performance liquid chromatography performed at a central laboratory. The seven-point blood glucose profiles were measured by a combined glucose-ketonemia meter provided by the sponsor (Abbott/Medisense [Alameda, CA] Optium Xceed) and recorded in a diary.
Hypoglycemia and hyperglycemia were self-reported. Hypoglycemia was defined as a PG concentration below 70 mg/dL with symptoms. Severe symptomatic hypoglyce-mia was defined as an event with clinical symptoms consid-ered to result from hypoglycemia for which the patient required assistance of another person and either a measured PG concentration of36 mg/dL or when the event was as-sociated with a prompt recovery after oral carbohydrates, intravenous glucose, or glucagon administration.
Unexplained hyperglycemia was defined as a PG concen-tration>300 mg/dL with no apparent medical, dietary insu-lin dosage, or pump explanation. Every hyperglycemia had to be complemented with a ketonemia assessment. Ketonemia is reported as nonsignificant (0–0.5 mmol/L), significant hy-perketonemia (0.6–1.5 mmol/L), or at risk for diabetic ketoa-cidosis (>1.5 mmol/L). Significant ketonemia was defined an adverse event, and ketoacidosis requiring hospitalization as a serious adverse event.
Basal insulin rates for CSII and mealtime insulin bolus were recorded in a diary. Perceived infusion set occlusion and time to change of the infusion set were measured. Per-ceived infusion set occlusion was defined as pump alarm for occlusion and/or patient observation of occlusion. Patients were advised to test the cannula by an air shot of insulin. Catheter occlusion was self-reported by the patient; there was no confirmation by microscope reading or other meth-od. Infusion set change was categorized in two outcomes: routine change (interval between changes according to the patient) and overall change, also taking into account change due to occlusion, unexplained hyperglycemia, or adverse event. Time interval between changes was calculated in hours.
Local reactions at the infusion site were recorded and di-vided into four categories: infection; inflammation or erythe-ma; pruritus; and pain.
Statistical analysis
The sample size was based on two criteria to show the superiority of GLU versus ASP and LIS. The primary criterion was the percentage of subjects experiencing at least one un-explained hyperglycemia and/or infusion set occlusion. As-suming an event rate of 40% with ASP and LIS and an event rate of 21% with GLU (48% relative risk reduction based on the precedent pilot study), 144 subjects had to be evaluated to provide a statistical power of 90% andaof 2.5% (two-sided). Theawas set at 2.5% because of multiple comparisons: the first between GLU and ASP and the second between GLU and LIS (Bonferroni’s correction). The secondary main outcome was the percentage of subjects experiencing an infusion set occlusion. Based on the precedent pilot study, an event rate of 27% with ASP and LIS and an event rate of 14% with GLU was assumed, resulting in 238 subjects to be evaluated. Assuming a dropout rate of 10%, 270 subjects had to be randomized.
Percentages of subjects were analyzed by McNemar’sw2tests at 2.5%alevel. Event rates for hypoglycemia were analyzed by analysis of variance with treatment, sequence group, and pe-riod as fixed effects and subject as random effect (mixed model). Event rates for ketonemia were analyzed by a rank analysis of variance with treatment, sequence group, and period as fixed effects and subject as random effect (mixed model). Change in HbA1c from beginning to the end of each study period was analyzed by analysis of variance with treatment, sequence group, and period as fixed effects and subject as random effect (mixed model) and baseline value as covariate.
A post hoc analysis was also conducted on the main effi-cacy criterion on four subgroups defined by quartiles of the time interval to change infusion set in routine. The difference between treatments according to the time interval between infusion set changes was tested by an interaction test using a multivariate model adjusting on sequence, period, and, with the treatment effect, the time interval between infusion set change effect and the interaction between this time interval and the treatment. A second post hoc analysis was conducted on the hypoglycemia rate per patient-year split up per month of each treatment phase to investigate whether hypoglycemia changed over time. The same was done for the hyperketone-mia rate at risk for ketoacidosis rate.
A planned multivariate analysis on determinants of the oc-currence of the primary outcome measure was performed. The treatment effect was tested in the model as well as adjusting variables: sequence; period and country and covariates; age; gender; BMI; HbA1c at study entry; insulin dose at study entry; insulin at study entry; type of pump; duration of treatment with CSII; the time interval between infusion set changes in routine; and the interaction between the treatment and the time interval between infusion set changes in routine. After a backward se-lection (threshold at 5%), only the following covariates were kept in the model: pump type; BMI; duration of treatment with CSII; and the time interval between infusion set changes in routine.
All results were based on the intent-to-treat population, defined as all patients that received the three insulins. APvalue below 0.025 was considered statistically significant. For the multivariate analysis,Pwas set at the 0.025 level for treatment effect and at the conventional 0.05 level for covariates. Results
Recruitment was from January 2008 with a study end in June 2009. In total, 359 patients were screened, and 288 pa-tients were randomized. Thirty-six papa-tients dropped out (GLU, 19; ASP, seven; and LIS, 10;P¼0.04,aat 0.05 for this comparison). The reasons for withdrawal were patients’ de-cision (n¼17), poor compliance (n¼2), adverse events (n¼8), lost to follow-up (n¼1), and other reasons not speci-fied (n¼8). The intention-to-treat population, having re-ceived the three insulins, included 256 subjects: 86 randomized to GLU-ASP-LIS, 86 to ASP-LIS-GLU, and 84 to LIS-GLU-ASP. A prespecifiedPvalue of 0.025 was considered significant to correct for multiple testing.
Table 1 displays the baseline characteristics. Overall, the mean age was 44.4 years, 47.3% were men, and mean HbA1c was 7.38%. Subjects had been treated with insulin for a mean of 22.5 years and by CSII for 6.0 years. Almost all subjects were using ASP or LIS before randomization; only eight subjects were using GLU.
Primary outcome
Percentages of patients with at least one unexplained hy-perglycemia and/or perceived infusion set occlusion were not significantly different between GLU and ASP (68.4% [62.7%; 74.1%] vs. 62.1% [56.2%; 68.1%],P¼0.04) and GLU and LIS (68.4% [62.7%; 74.1%] vs. 61.3% [55.4%; 67.3%],P¼0.03). Secondary outcomes
Percentages of patients with at least one unexplained hy-perglycemia were not significantly different between GLU and ASP (61.3% [55.4%; 67.3%] vs. 55.9% [49.8%; 61.9%], P¼0.08) and GLU and LIS (61.3% [55.4%; 67.3%] vs. 56.3% [50.2%; 62.3%], P¼0.11). No difference was seen between GLU and ASP (32.8% [27.1%; 38.6%] vs. 27.0% [21.5%; 32.4%], P¼0.08) and GLU and LIS (32.8% [27.1%; 38.6%] vs. 27.0% [21.5%; 32.4%],P¼0.06) in percentages of patients with at least one perceived infusion set occlusion. The monthly rate of unexplained hyperglycemia or perceived infusion set occlu-sion was significantly different between GLU 2.02 (1.73–2.32) and ASP 1.32 (1.02–1.61) (P<0.001) and between GLU and LIS 1.54 (1.24–1.83) (P<0.001). The monthly rate of unex-plained hyperglycemia was significantly different between GLU (1.61 [1.36–1.86]) and ASP (1.04 [0.79–1.29]) (P<0.001) and between GLU and LIS (1.22 [0.98–1.47]) (P<0.001). The monthly rate for perceived infusion set occlusion was signif-icantly different between GLU (0.41 [0.3–0.52]) and ASP (0.28 [0.16–0.39]) (P¼0.02) but not between GLU and LIS (0.31 [0.2–0.42]) (P¼0.07).
Glycemic control
The HbA1c remained stable from baseline to end of treat-ment period with the three insulins, and no differences were
observed between GLU and ASP and between GLU and LIS at the end of the treatment periods (Table 2). The percentages of patients achieving HbA1c<7% (28%, 31%, and 30%, respec-tively, for GLU, ASP, and LIS) was similar with GLU, ASP, and LIS, and there were no significant differences between most points of the seven-point PG profiles in the last week, except after lunch, where PG was higher for GLU compared with ASP (166.1 vs.155.5 mg/dL,P¼0.021) and during the night where PG was higher for LIS compared with GLU (159.4 vs.148.1 mg/dL,P¼0.018) (Fig. 2).
Hypoglycemia
The overall rate of symptomatic hypoglycemia per patient-year with a PG level below 70 mg/dL per patient-patient-year was somewhat higher with GLU compared with ASP (73.8 vs. 65.0, P¼0.008) and with LIS (73.8 vs. 62.7,P<0.001). Nocturnal hypoglycemia episodes per patient-year were seen more fre-quently during GLU administration (GLU vs. ASP, 12.8 vs. 9.7,P<0.001; GLU vs. LIS, 12.8 vs. 9.5,P<0.001; see Table 2). The rate per patient-year of overall and nocturnal severe hy-poglycemia was not different among the three insulin groups. The differences between GLU versus ASP and GLU versus LIS for rate per patient-year of symptomatic, nocturnal, and severe hypoglycemia decreased over the 3 months that each insulin was studied. The rates of symptomatic, nocturnal, and severe hypoglycemia were similar among GLU, ASP, and LIS during the third month. During the third month, the rates per patient-year were, respectively, 62.6, 59.3, and 55.9 for symptomatic hypoglycemia (GLU vs. ASP,P¼0.387; GLU vs. LIS,P¼0.07), 10.7, 8.9, and 8.9 for nocturnal hypoglycemia (GLU vs. ASP,P¼0.153; GLU vs. LIS,P¼0.157), and 1.1, 1.3 and 1.0 for severe hypoglycemia (GLU vs. ASP, P¼0.643; GLU vs. LIS,P¼0.785).
Table1. Patient Characteristics
Demographics GLU-ASP-LIS (n¼86) ASP-LIS-GLU (n¼86) LIS-GLU-ASP (n¼84) Total (n¼256) Age (years) Mean (SD) 42.74 (13.35) 45.37 (13.58) 44.96 (12.94) 44.35 (13.30) Min; Max 19.3; 73.8 18.5; 75.2 19.7; 71.7 18.5; 75.2 Sex [n(%)] Male 44 (51.2%) 36 (41.9%) 41 (48.8%) 121 (47.3%) Female 42 (48.8%) 50 (58.1%) 43 (51.2%) 135 (52.7%) BMI (kg/m2) Mean (SD) 25.13 (3.48) 25.15 (3.87) 25.75 (3.79) 25.34 (3.72) Min; Max 19.1; 35.0 16.3; 35.3 17.9; 35.0 16.3; 35.3 HbA1c (%) Mean (SD) 7.38 (0.66) 7.37 (0.61) 7.41 (0.70) 7.38 (0.65) Min; Max 5.6; 8.4 5.8; 8.4 5.5; 8.4 5.5; 8.4
Treatment with insulin (years)
Mean (SD) 22.15 (12.84) 22.49 (13.34) 22.90 (11.40) 22.51 (12.52)
Min; Max 1.3; 60.6 1.3; 54.7 4.3; 51.5 1.3; 60.6
Treatment with CSII (years)
Mean (SD) 5.98 (4.87) 5.62 (5.45) 6.32 (5.10) 5.97 (5.13)
Min; Max 0.5; 27.1 0.5; 28.3 0.9; 24.1 0.5; 28.3
Previous insulin use [n(%)]
Insulin glulisine 4 (4.7%) 2 (2.3%) 2 (2.4%) 8 (3.1%)
Insulin aspart 28 (32.6%) 43 (50.0%) 38 (45.2%) 109 (42.6%)
Insulin lispro 54 (62.8%) 41 (47.7%) 44 (52.4%) 139 (54.3%)
ASP, insulin aspart; BMI, body mass index; CSII, continuous subcutaneous insulin infusion; GLU, insulin glulisine; HbA1c, hemoglobin A1c; LIS, insulin lispro; Max, maximum; Min, minimum.
Ketonemia
The monthly rate of significant hyperketonemia and/or hy-perketonemia at risk for ketosis was higher for GLU compared with ASP (0.14 [0.43] vs. 0.06 [0.22],P¼0.01) and LIS (0.14 [0.43] vs. 0.06 [0.18],P¼0.02). During the trial, one patient was hos-pitalized for diabetic ketoacidosis, during GLU treatment.
The monthly rate of hyperketonemia at risk for ketosis (>1.5 mmol/L) was not statistically significant for GLU compared with ASP (0.03 [0.13] vs. 0.01 [0.08], P¼0.153). Between GLU and LIS the monthly rate was higher (0.03 [0.13] vs. 0.01 [0.05],P¼0.024). These differences were not observed during the third month of treatment: for GLU compared with ASP, 0.01 (0.15) vs. 0.02 (0.12),P¼0.169; for GLU compared with LIS, 0.01 (0.15) vs. 0.01 (0.14),P¼0.651.
Insulin dosages
Total daily insulin dose was similar among groups and remained unchanged during the trial (Table 2). Similarly,
there were no differences and changes in total daily basal or total daily bolus insulin dose. Body weight did not change during the trial (data not shown).
Time interval to infusion set change
The majority of the patients changed the catheter at a time interval greater than 2 days. The mean time for routine change was 70.619.7 h, and that for overall change was 69.219.3 h. The time interval for routine change was for GLU 70.72 (SD 21.47) h, for ASP was 71.00 (SD 20.68) h, and for was LIS 71.07 (SD 21.65) h, and for overall change the time interval was 69.01 (SD 20.70) h, 69.44 (SD 19.22) h, and 69.64 (SD 21.64) h for GLU, ASP, and LIS, respectively.
Local reactions at the infusion site and serious adverse events
No significant differences in percentage of patients were demonstrated between GLU versus ASP (P¼1.00) and GLU
Table2. Primary and Secondary Outcomes
Insulin glulisine Insulin aspart Insulin lispro Pvalue Unexpected hyperglycemia and/or infusion
set occlusion [% of patients (95% CI)]
68.4 (62.7–74.1) 62.1 (56.2–68.1)* 61.3 (55.4–67.3){ 0.04*/0.03{ Unexpected hyperglycemia [% of patients (95% CI)] 61.3 (55.4–67.3) 55.9 (49.8–61.9)* 56.3 (50.2–62.3){ 0.08*/0.11{ At least one infusion set occlusion
[% of patients (95% CI)]
32.8 (27.1–38.6) 27.0 (21.5–32.4)* 27.0 (21.5–32.4){ 0.08*/0.06{ HbA1c (%) [mean (SD)]
Start 7.31 (0.71) 7.33 (0.71) 7.28 (0.71)
End 7.32 (0.73) 7.26 (0.76)* 7.31 (0.74){ 0.08*/0.94{
Rate of symptomatic hypogycemia per patient-year [mean (SD)]
Overall 73.84 (82.10) 65.01 (72.07)* 62.69 (72.87){ 0.008*/<0.001{
Nocturnal 12.80 (18.02) 9.66 (13.75)* 9.48 (13.28){ <0.001*/<0.001{ Rate of severe hypoglycemia
per patient-year [mean (SD)]
Overall 1.63 (4.50) 1.38 (7.73)* 1.06 (3.81){
0.56*/0.186{
Nocturnal 0.61 (2.20) 0.33 (1.18)* 0.36 (1.40){
0.044*/0.070{ Total daily insulin dose (IU)
First week Mean (SD) 39.5 (15.1) 39.5 (15.7) 39.3 (14.9) Min; Max 12.9; 112.1 13.9; 116.3 14.4; 102.4 Last week Mean (SD) 39.5 (14.7) 39.5 (16.1)* 40.3 (15.6){ 0.73*/0.05{ Min; Max 13.4; 114.3 13.4; 106.3 13.6; 109.1
Total daily basal insulin (IU) First week Mean (SD) 20.8 (9.1) 20.9 (9.5) 20.9 (9.2) Min; Max 6.0; 62.1 6.0; 68.3 6.0; 60.4 Last week Mean (SD) 20.9 (9.2) 20.8 (9.7)* 21.1 (9.4){ 0.88*/0.25{ Min; Max 6.0; 68.3 2.4; 68.3 1.7; 62.1
Total daily bolus insulin (IU) First week Mean (SD) 18.6 (9.2) 18.5 (9.0) 18.4 (8.7) Min; Max 3.8; 53.7 2.0; 51.7 3.4; 56.2 Last week Mean (SD) 18.6 (8.5) 18.6 (9.6)* 19.2 (9.1){ 0.79*/0.10{ Min; Max 2.5; 52.4 1.7; 60.6 3.4; 61.2
Symptomatic hypogycemia is defined as plasma glucose level below 70 mg/dL. Significance is atP<0.025: *comparison of glulisine versus aspart;{
comparison of glulisine versus lispro. CI, confidence interval; HbA1c, hemoglobin A1c; Max, maximum; Min, minimum.
versus LIS (P¼0.70) regarding experiencing one ore more site infections or site inflammation/erythema or pruritus or iso-lated pain.
No death occurred during the trial. There were no differ-ences in serious adverse events reported for the three insulins: GLU, 10.6%; ASP, 6.8% (P¼0.157 vs. GLU); and LIS,P¼4.1% (P¼0.0038 vs. GLU).
Multivariate analysis
The determinants of unexplained hyperglycemia and/or infusion set occlusion are shown in Table 3. The multivariate model showed that the odds of having unexplained hyper-glycemia with PG value above 300 mg/dL and/or infusion set occlusion were not statistically different between GLU and ASP (odds ratio, 1.29; 97.5% confidence interval, 0.90, 1.86; P¼0.111) or between GLU and LIS (odds ratio, 1.40; 97.5% confidence interval, 0.95, 2.05; P¼0.050). However, other factors did have an impact on the primary outcome. These included a significant decrease of 9% for each 6-h increase in time interval between infusion set change in routine (odds ratio, 0.91; 95% confidence interval, 0.86, 0.95;P<0.0001) and a significant decrease of 6% for each 1 kg/m2increase in BMI (odds ratio, 0.94; 95% confidence interval, 0.881, 0.999; P¼0.046). Furthermore, there was a significant increase of about 8% for each additional year of CSII use (odds ratio, 1.08; 95% confidence interval, 1.02; 1.14;P¼0.005). The odds were
similar for the Accu-Chek(Roche, Basel, Switzerland) and Medtronic (Northridge, CA) insulin pumps, but the odds were 2.21-fold higher with other pumps (95% confidence in-terval of odds ratio, 1.18, 4.16; P¼0.013) compared with Medtronic.
Post hoc analyses
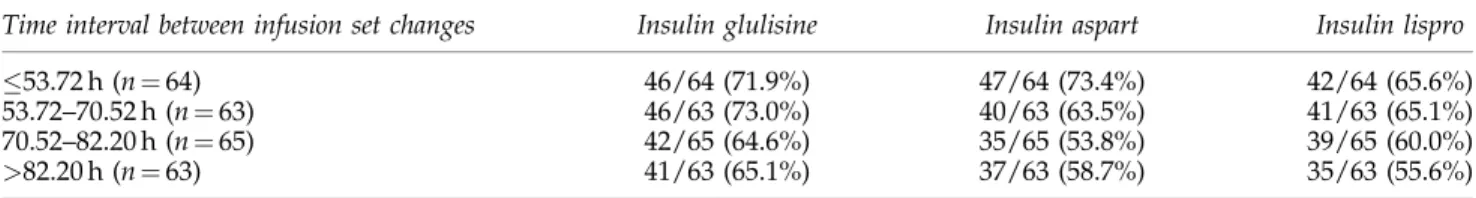
The post hoc analysis on the primary outcome taking into account the four subgroups defined by quartiles of the time interval to change of infusion set in routine demonstrated that in the subgroup with a mean time to change53.72 h, the percentages of patients presenting with at least one event was higher than in the intention-to-treat population for each in-sulin (71.9% of the patients presented when treated with GLU, 73.4% when treated with ASP, and 65.6% when treated with LIS) in accordance with the multivariate analysis. A similar rate of events was observed between GLU and ASP (71.9% and 73.4%, respectively) in this subgroup, but the interaction test treatment/time to change was not significant (P¼0.34), indicating that the difference between insulins is not signifi-cantly influenced by the time to catheter change (Table 4). Discussion
This trial demonstrated no significant difference among the three insulins GLU, ASP, and LIS for unexplained
hypergly-FIG. 2. Seven-point plasma glucose profiles measured in the last week for insulin glulisine, insulin aspart, and insulin
lispro. AB, after breakfast; AD, after dinner; AL, after lunch; ASP, insulin aspart; BD, before dinner; BL, before lunch; FG, fasting glucose; GLU, insulin glulisine; LIS, insulin lispro; N, night at 3 a.m.
cemia and/or perceived infusion set occlusion when used in insulin pumps. In fact, the use of GLU in CSII was not superior to that of ASP or LIS with respect to unexplained hypergly-cemia and/or perceived infusion set occlusion, as we hy-pothesized from the results of the pilot study. The use of GLU was associated with an increased rate per month of unex-plained hyperglycemia and/or perceived infusion set occlu-sion, a secondary outcome measure. From baseline to end of treatment period, HbA1c, percentages of patients with HbA1c
<7%, and the seven-point blood glucose profiles remained stable with the three short-acting insulins and were similar whatever the insulin used.
Taking together the number of patients experiencing an event in the pilot study by Hoogma and Schumicki2and in this trial, no clear differences were seen between ASP and GLU for unexplained hyperglycemia (155 of 286 patients [54.2%] vs. 163 of 285 patients [57.2%]) and catheter occlusion (77 of 286 patients [26.9%] vs. 88 of 285 patients [30.9%]). Thus, the non-significant trend toward higher incidence of unexplained hy-perglycemia or infusion set occlusion with GLU compared with ASP in this study is counterbalanced by a nonsignificant trend toward lower incidence of this outcome with GLU compared with ASP in the study of Hoogma and Schumicki.2 Another point to be discussed related to the pilot study of Hoogma and Schumicki2was the facts that the mean time to catheter change was 2.0 days (mandatory by protocol) and the time between catheter change was similar in patients with or without occlusion. In the current study, time to change cath-eter was around 3 days, far above the recommended 48 h specified in the protocol. In the current study only 25% of patients changed the catheter at close to 2 days, and in this subgroup unexplained hyperglycemia or catheter occlusion tended to be similar between GLU and ASP even if the general
conclusion on insulin effect remains the same (the interaction test between time to change catheter and insulin was not significant).
In another, laboratory-based, study, comparison of catheter occlusions using GLU, ASP, or LIS showed no catheter oc-clusions in the first 48 h, and within 72 h no differences in infusion set occlusions were seen. Over the whole 5-day study period, the probability of occlusion using GLU was signifi-cantly higher compared with that using ASP and LIS. The insulin doses used in this in vitro study were low: a basal rate of 0.1 IU/h and a bolus dose of 2 IU, further limiting the rel-evance a laboratory-based study may have for clinical prac-tice.4
In the multivariate analysis, time to change the catheter influenced unexplained hyperglycemia and occlusion. For every increase of 6 h, the odds for hyperglycemia and/or oc-clusion decrease by 9%. So, if the duration of use of the catheter increased, the occurrence of unexplained hypergly-cemia and catheter occlusion decreased. This is likely because of reverse causality, with patients experiencing fewer prob-lems with their catheter replacing them less frequently. Probably because of a higher insulin infusion rate, BMI is associated with a lower risk for the primary outcome. The finding of more unexplained hyperglycemia and catheter occlusion in association with the use of certain pumps should be interpreted with caution.
No significant difference in severe hypoglycemia or severe ketoacidosis was observed in this trial, but symptomatic hy-poglycemia was seen more often during GLU use. One pos-sible explanation is that GLU was slightly overdosed during this study, in particular at the beginning of the study, as rate of hypoglycemia episodes was similar among the three insulins during the third month of the study. Several studies have
Table4. Percentage of Patients with at Least One Unexplained Hyperglycemia with Plasma Glucose>300mg/dL and/or Infusion Set Occlusion, Split by Time Between Infusion Set Changes Quartiles
Time interval between infusion set changes Insulin glulisine Insulin aspart Insulin lispro
53.72 h (n¼64) 46/64 (71.9%) 47/64 (73.4%) 42/64 (65.6%)
53.72–70.52 h (n¼63) 46/63 (73.0%) 40/63 (63.5%) 41/63 (65.1%)
70.52–82.20 h (n¼65) 42/65 (64.6%) 35/65 (53.8%) 39/65 (60.0%)
>82.20 h (n¼63) 41/63 (65.1%) 37/63 (58.7%) 35/63 (55.6%)
Table3. Multivariate Analysis on Prognostic Factors of the Primary Outcome: Unexplained Hyperglycemia/Infusion Set Occlusion
Odds ratio 97.5% CI (a¼2.5%) P value
GLU vs. ASP 1.29 0.90; 1.86 0.111 (NS)
GLU vs. LIS 1.40 0.95; 2.05 0.050 (NS)
Odds ratio 95% CI Pvalue
Time to change (6-h increase) 0.91 0.86; 0.95 <0.0001
BMI (kg/m2) 0.938 0.881; 0.999 0.046
Previous CSII use duration (year) 1.08 1.02; 1.14 0.005
Accu-Chek vs. Medtronic 0.64 0.32; 1.29 0.211
Other pump vs. Medtronic 2.21 1.18; 4.16 0.013
The model was adjusted for sequence, period, and country.
ASP, insulin aspart; BMI, body mass index; CI, confidence interval; CSII, continuous subcutaneous insulin infusion; GLU, insulin glusiline; NS, not significant.
demonstrated small lower basal dose requirements for GLU compared with other rapid-acting insulins at the end of the study5–7with a need to adjust at initiation, during the titration phase in these trials. During this study, GLU basal, bolus, and total insulin doses dose were comparable to those with ASP and LIS and did not diminish during the use of GLU.
This study has several limitations. The impossibility of blinding of the study insulins due to reasons of quality as-surance is a major one. Unconscious preferences for either a new insulin or the insulin patients had been using before the trial cannot be ruled out. Of note is that only eight of the 256 patients were familiar with GLU at the start of the study. Also, the self-reported nature of both components of the primary outcome—unexplained hyperglycemia and catheter occlu-sion—might have influenced the results of this study. Finally, a study powered using a noninferiority approach would have been preferable. However, to demonstrate noninferiority, larger patient numbers would have been needed.
In conclusion, GLU was not superior to ASP and LIS, with no significant difference seen among GLU, ASP, and LIS in CSII use with respect to unexplained hyperglycemia and/or perceived catheter set occlusion. All three short-acting insulin analogs could be used in CSII as no difference was seen among GLU, ASP, and LIS on the primary outcome measure of this trial, unexplained hyperglycemia and/or infusion set occlusion. GLU was associated with a higher frequency of symptomatic hypoglycemia, possibly because of slight over-dosing, as previous trials had suggested lower insulin re-quirements when GLU is initiated in type 1 diabetes. Acknowledgments
This study was supported by sanofi-aventis. We thank the investigators (number of patients is given in parentheses): O. David (two), T. Duncan (one), R. Prager (five), T. Pieber (one), H. Drexel (two), G. Charpentier (two), H. Hanaire (one), M. Lamotte (one), N. Jeandidier (two), E. Renard (two), J. Cour-reges (two), T. Hidve´gi (two), Z. Kere´nyi (four), M. Philip (six), E. Leiberman (one), O. Cohen (three), A. Tiengo (four), U. Valentini (three), R. Trevisan (none), Y. Kim (one), R. Hoogma (three), F. Storms (three), J.H. DeVries (one), J. Am-pu´dia (two), I. Conget (none), M. Ruiz de Adana (three), F. Pallardo (two), A. Calle (two), J. Ortego (one), J. Bolinder (two), C. Berne (two), P. Hammarstro¨m (one), E. Schwarcz (two), D. Kerr (two), P. Weston (two), R. Urdaneta (two), B. Bode (two), A. Wynne (two), J. Rothman (two), T. Sherraden
(one), A.B. King (two), S. Garg (two), B. Miranda-Palma (two), R. Weinstock (two), J. McGill (two), S. Wittlin (two), and M. Rendell (two).
Author Disclosure Statement
A.C.v.B. declares no competing financial interests. C.S.-L. was an employee of sanofi-aventis. B.W.B., J.H.DeV., and G.C. have received research support and/or sit on advisory boards for Eli Lilly, Novo Nordisk, and sanofi-aventis.
References
1. Becker RH: Insulin glulisine complementing basal insulins: a review of structure and activity. Diabetes Technol Ther 2007;9:109–121.
2. Hoogma RP, Schumicki D: Safety of insulin glulisine when given by continuous subcutaneous infusion using an external pump in patients with type 1 diabetes. Horm Metab Res 2006;38:429–433.
3. American Diabetes Association: Standards of medical care in diabetes. Diabetes Care 2005;28(Suppl 1):S4–S36.
4. Kerr D, Morton J, Whately-Smith C, Everett J, Begley JP: Laboratory-based non-clinical comparison of occlusion rates using three rapid-acting insulin analogs in continuous sub-cutaneous insulin infusion catheters using low flow rates. J Diabetes Sci Technol 2008;2:450–455.
5. Dreyer M, Prager R, Robinson A, Busch K, Ellis G, Souhami E, Van Leendeert R: Efficacy and safety of insulin glulisine in patients with type 1 diabetes. Horm Metab Res 2005;37: 702–707.
6. Garg SK, Rosenstock J, Ways K: Optimized basal-bolus in-sulin regimens in type 1 diabetes: inin-sulin glulisine versus regular human insulin in combination with basal insulin glargine. Endocr Pract 2005;11:11–17.
7. Kawamori R, Kadowaki T, Ishii H, Iwasaki M, Iwamoto Y: Efficacy and safety of insulin glulisine in Japanese patients with type 1 diabetes mellitus. Diabetes Obes Metab 2009;11: 891–899.
Address correspondence to: J. Hans DeVries, M.D., Ph.D. Department of Internal Medicine Academic Medical Center Amsterdam Meibergdreef 9 1100 DD Amsterdam, The Netherlands E-mail:j.h.devries@amc.nl