Expediting an Improved Performance Based NAS:
The Rationale for Accelerating Avionics Equipage
*
Kent V. Hollinger, P.E.
† and Marc Narkus-Kramer‡Center for Advanced Aviation System Development (CAASD) The MITRE Corporation, McLean, Virginia 22102
Over the years, the FAA has introduced many new technologies into the National Airspace System (NAS) that have offered safety, capacity and/or efficiency improvements. However, since a number of users were often not equipped to take advantage of the new technologies, the older existing systems were continued in parallel. This has resulted in a NAS with several redundant and often obsolete systems still in operation. The operation of these multiple systems has caused FAA costs to grow at an ever increasing rate and has denied the full expected benefits to the users. Additionally, mixed aircraft equipage often results in tailoring operations to the least capable user, thus preventing operations that can reduce controller costs and provide user benefits.
By accelerating the equipage of improved capabilities into aircraft, the entire NAS is able to reach higher levels of Required Communications Performance (RCP), Required Navigation Performance (RNP), and Required Surveillance Performance (RSP). Certain operations may require higher levels of performance than others, resulting in a provision of service based upon the capability of the aircraft, and allowing for the removal of the older less capable ground-based systems. As this paper demonstrates, a higher-level of performance results in significant cost savings to both the users and the FAA.
FAA cost savings are realized from reduced infrastructure costs and increased controller productivity, while the users benefit from improved aircraft throughput, access and safety. Based upon historical trends, an evolution to a significantly improved Performance-based NAS could easily take until after 2030 to accomplish. An accelerated effort that achieves full operational status within the next 12 years could result in total savings in the range of $20-30 billion over the next 25 years.
I. Introduction
A. Purpose
he purpose of this paper is to provide significant evidence that taking advantage of the capabilities on the aircraft can provide significant increases in safety and efficiency while providing the FAA with major cost savings. However, these savings cannot materialize unless there is a coordinated investment in avionics in the aircraft along with investments in the ground and space-based infrastructure. The authors’ intent is to demonstrate to the reader that the aircraft is an essential part of the NAS and that avionics equipage is an investment of equal importance to ground and space-based infrastructure. Policy makers should be encouraged to find ways to stimulate equipage of necessary avionics and to insure that procedures, training and certification occur in time to take advantage of the investments in the aircraft and infrastructure.
B. Scope, Audience, and Limitations
The scope of this paper is extremely broad and the cost and benefit numbers are taken from a variety of studies. Not all concepts have been adequately validated and thus not all cost and benefit numbers are at the same level of
* Copyright ©2005 The MITRE Corporation. All rights reserved.
† Multi-Discipline System Engineer, Principal, F070, 7515 Colshire Drive, Mclean, Virginia 22102, N512. ‡ Simulation Modeling Engineer, Senior Principal, F020, 7515 Colshire Drive, Mclean, Virginia 22102, N560.
T
Approved for Public Release; Distribution Unlimited Case # 05-1122
fidelity. However, the authors believe that the magnitude of the cost and benefit calculations are reasonable and that the assertions in the paper are justified.
This paper is purposely aircraft centric since we are investigating the issue of accelerating equipage. One major limitation of this paper is that there are other proposed solutions to some issues (such as controller productivity) that can be at least partially achieved without relying as heavily on changes to the aircraft. The costs and benefits provided herein assume that these improvements are independent. For example, the improvement in controller productivity proposed by ADS-B operations is independent of other improvements being proposed that affect the controllers’ workplace. A more thorough study is needed to evaluate the combined sets of proposed solutions to determine if they overlap to result in reduced benefits or combine synergistically to augment the benefits. Additionally, the user benefits may be understated because there are a number of applications of ADS-B/CDTI and data link that were not estimated due to a lack of adequate data.
The audience is wide ranging, but the message is primarily meant to influence executives and policy makers on the need for government to stimulate investment in the aircraft so that the FAA investments in ground and spaced-based assets can result in maximum benefit to users and government.
C. The Problem
Why does a new investment strategy that addresses aircraft equipage need to be developed now? First, the air traffic management system has been based on operational concepts and procedures that have mostly been developed in the 1960s and 1970s. This has resulted in an extremely safe system. However, the cost of maintaining this system has risen rapidly over the past 20 years and with aging equipment, the costs are likely to continue to increase. Second, the demands on the system are increasing, and it is widely acknowledged that the system must be transformed to address the problems of congestion in the future. This is the reason why the Joint Program Development Office (JPDO) was established by Congress and involves top executives from seven different agencies.
It is also recognized that transformation cannot occur unless the system utilizes the advanced capabilities of the aircraft. Unless the aircraft evolves in lockstep with the ground and spaced-based air traffic control assets, this transformation will be severely delayed and we will not be able to adequately address the congestion and cost problems that are now upon us. The way we have done business in the past makes the synchronization of the evolution of the ground infrastructure and the aircraft difficult because it is hard to justify an equipage mandate when there is not a safety issue involved. Self-equipage often takes a great deal of time because each user has their own break-even point and the required return on investment for each user is often much higher than for the service provider. However, without the aircraft equipage being rapid enough it is hard to demonstrate a cost-effective investment for the service provider, thus resulting in non-action by all parties.
This paper suggests that the combined business case for the service provider and the user well exceeds the operational and capital costs, but since the majority of the quantifiable benefits are realized by the service provider, the government will need to find incentives to support the user in making investments.
D. Organization of the Paper
Section II of this paper presents definitions for a Performance-based NAS. It is important to understand that moving towards a more stringent set of performance requirements, which are achievable by new technologies and procedures, is the foundation for the improvements in safety, efficiency and cost savings. The major centerpiece of moving towards a Performance-based NAS is better utilizing the capabilities inherent in modern aircraft.
Section III presents a series of alternative scenarios. The baseline assumes that we do not realize an improved Performance-based NAS until 2033. In this scenario new capabilities are introduced through the natural phasing out of older aircraft and there is no major incentive to retrofit or accelerate the elimination of older aircraft. This is defined as the business-as-usual scenario. Three other scenarios are developed to contrast with the business-as-usual scenario. These scenarios assume that incentives and policies are established to accelerate the entire fleet towards a higher NAS performance level and the ground infrastructure and procedures are also changed. The combination of these changes results in significantly improved performance of the system with respect to safety, efficiency and cost. Section IV presents cost data associated with the different scenarios. These are divided into costs for the users and costs to the FAA. Section V presents benefits data in dollars for the users. Section VI provides conclusions drawn from the analyses presented in this paper.
II. Definition of Performance-Based NAS (PB NAS)
A. Overall Definition
A Performance-based NAS (PB NAS) is defined herein as a set of performance requirements that the users and the service provider can meet in a variety of methods (i.e. not tied to specific technologies) in order to gain and provide access and services in the NAS. The users meet their performance requirements through the capabilities of their aircraft. These aircraft capabilities are described as Required Communication Performance (RCP), Required Navigation Performance (RNP) and Required Surveillance Performance (RSP). The service provider is measured by its ability to supply Required Air Traffic Management Performance (RATMP). The summation of the user and service provider capabilities results in a measure of the Required Total System Performance (RTSP). Today we have a NAS with a certain level of performance, but the performance parameters are often tied to specific technologies that were introduced into the system 40 years ago. The performance of the system is mostly defined by the capabilities on the ground since the capabilities of advanced-aircraft are not fully used to increase the performance of the system. The definitions presented below include the benefits that are enabled by increasing the performance of the NAS.
B. Required Communications Performance Operational Changes
RCP is defined as the timely and accurate delivery of information via a digital connection between the aircraft and the ground, including a link to the service provider automation, and is allocated between the technical and human components of the system. Bandwidth should be sufficient to allow for both voice and data communications. Example metrics for RCP include latency, availability, accuracy and coverage.
Implementation of improved RCP will allow for a reduction in controller-pilot communications by transmitting, via data link, information such as initial contact, altimeter settings, clearances and sector handoffs. A reduction of human errors is possible once these types of information are linked directly into the aircraft’s flight management system, eliminating the need for retyping by the flight crew.
C. Required Navigational Performance Operational Changes
RNP is defined as the ability for aircraft to precisely know and manage their actual trajectories, and is allocated between the technical components and human abilities to operate the aircraft. RNP is measured by the lateral distance around the aircraft required to achieve the necessary positional accuracy and integrity (i.e. containment and time to alarm) for operation within a defined airspace. The positional accuracy is influenced by navigation system error, computational error, display error, course error and flight technical error. The degree of accuracy required may vary between oceanic, enroute, terminal and final approach applications.
RNP allows for flexibility in airspace design. Aircraft departure streams can be defined to allow for diverging courses with multiple fixes, allowing for simultaneous independent departures and increased departure rates. Multiple enroute routes can be created to allow for use of the most fuel efficient routes. Curved approach procedures with consistent vertical path angles can improve safety, reduce noise levels, and reduce pilot and controller workloads by flying predetermined paths without the need for frequent vectoring updates.
D. Required Surveillance Performance Operational Changes
RSP is defined as the ability to know the aircraft position, velocity and intent with a specified precision, accuracy and update rate. Example metrics for RSP include the accuracy of the reported position, the latency in reporting the position to the controller, and the integrity, availability and continuity of the surveillance data.
RSP can allow for reduced separation of aircraft by supplying a more accurate display of aircraft position to the controller, thus reducing the spacing buffer around each aircraft due to uncertainty in aircraft position. Implementing RSP on the surface can reduce runway incursions by allowing controllers to precisely know aircraft positions when visual conditions are poor. In the longer term, surveillance data can be supplied to all aircraft, not just to controllers. This knowledge of other aircraft positions and intents will enable many new operational procedures, possibly culminating in aircraft self-separation. Initially, aircraft could fly restricted visual procedures in IMC due to the ability to “see” other aircraft via the surveillance data. In addition, the aircraft can assume, under restricted conditions, certain merging and spacing functions that will reduce controller workload.
E. Required Air Traffic Management Performance Operational Changes
RATMP is defined as the set of criteria, expressed in the form of performance parameters, and values of these parameters, that the ATM system needs to meet with a given probability, in order to support the approved quality of service specified for a particular environment. The automation used by controllers plays a large role in RATMP,
including the ability to model and predict aircraft trajectories, determine future aircraft conflicts, allow for a flexible airspace with advanced procedures, and support the aircraft capabilities required by RCP, RNP and RSP.
RATMP will reduce delays by providing user preferred direct routes, issuing clearances in a timely manner, reducing aircraft separation, and allowing for increased use of simultaneous arrivals and departures. Controller costs can be reduced due to a lower communications workload, delegation of responsibilities to pilots, and the assumption of a flight monitoring, rather than controlling, role. Safety will be improved by providing increased situational awareness information to pilots along with weather and traffic information, and by allowing vertical guidance for approaches at additional airports.
F. Required Total System Performance
RTSP is the aggregate of criteria, expressed in the form of performance parameters (operational and technical), that the NAS needs to meet in order to deliver the approved quality of service specified for a particular environment.
G. PB NAS Impacts
An improved Performance-based NAS has the potential to deliver huge benefits to both users and the FAA. Safety will be enhanced through increased use of precision approaches, more extensive surface surveillance, and increased pilot situational awareness. Aircraft throughput (both capacity and efficiency) will increase because of RNP routes, ADS-B/CDTI procedures and data link capabilities linked to automation changes on the ground. FAA infrastructure costs will be reduced by decommissioning the majority of NDBs, VORs and ILSs while relying upon satellite navigation, and reducing the number of radars through the use of ADS-B Ground Broadcast Transceivers. Additionally, controller costs per flight hour will be reduced due to implementation of RNP routes, lessened aircraft communications, and limited delegation of responsibilities to the flight crew.
III. Implementation Timelines
A. Business-as-Usual Scenario
Using past operational changes, such as ADS-B (Alaska) and CPDLC (Miami), as examples, an implementation plan utilizing traditional practices was established. The plan assumed that aspects of an improved Performance-based NAS would first be tried in an isolated test area, such as Alaska, for a 3-4 year period. Next, a test case in a broader area, such as Gulf of Mexico enroute airspace, would be accomplished over 3-4 years. After acquiring experience from these trials, a more complicated domain, such as a terminal area, would then undergo a 3-4 year evaluation. The lessons learned in these three evaluations would allow for certification of the avionics to support the improved performance-based capabilities in the 2017 timeframe. This 10-12 year period is consistent with the development of other major technologies such as TCAS and GPWS.
Perf.
Based
NAS
FY 2005 08 11 14 17 20 23 26 29 32 35
Mixed
Equipage
100%TODAY
Avionics CertificationAvionics Certification Test Case: GOMEX Test Case: GOMEX Test Case: Terminal AreaTest Case: Terminal Area Test Case: Alaska Test Case: Alaska Operate Parallel Systems Operate Parallel Systems Decommission Previous System Decommission Previous System Deploy Ground Infrastructure Deploy Ground InfrastructureOnce the avionics are certified, users are able to begin to equip their aircraft. Because it is difficult to justify mandates for performance enhancements, it was assumed that equipage would be on a totally voluntary basis. Some users will perceive higher benefits than others and will be quick to equip, while some users will wait until there are well established services before equipping their aircraft. Thus, it is reasonable to project a 16 year mixed equipage period, before arriving at an improved Performance-based NAS in 2033.
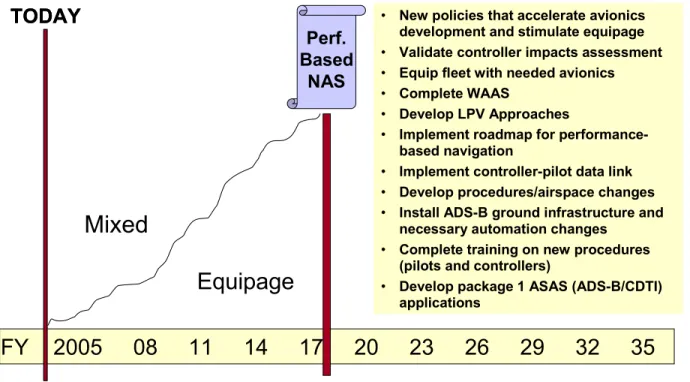
B. 2017 Accelerated Scenario
The supporting technologies that enable an improved Performance-based NAS have all been tested or proven already. LPV approaches have already been approved, but many more are needed. Stringent RNP approaches were approved in Juneau in 2003 and more are currently being developed in the lower 48 states. CPDLC was successfully demonstrated in Miami in 2003 and has been implemented in Maastricht. ADS-B broadcast surveillance has been implemented in Alaska and is planned to be implemented nationwide in Australia. Delegation of responsibilities to the flight crew has been demonstrated by UPS beginning in 2002 and there has been significant research in Europe since that time. Automation system specifications and new procedures have been developed in some cases to take advantage of these new aircraft capabilities.
The capabilities have been mostly developed, although ADS-B/CDTI airborne applications have not matured as rapidly as the data link, RNP, or air-to ground ADS-B applications. Achieving a 2017 accelerated scenario where all aircraft flying in the NAS meet the higher performance-based requirements necessitates a firm commitment from the government and the users. Increased investments by the government will be needed up front, and there will have to be policy changes to incentivize users to retrofit their aircraft or purchase new aircraft.
This paper presents two different analyses for the 2017 accelerated scenario. The first is called conservative and assumes the least risky but often more expensive ways of achieving the goal. The most important aspect is that a certified Electronic Flight Bag (EFB) is not considered applicable for ATM capabilities in the cockpit, meaning that new avionics must be built into and integrated with the aircraft when there are retrofits, thus increasing the cost significantly. Also, when there is a range of benefits to be achieved, or cost savings to be realized, the more conservative estimates are used. The second is called aggressive and assumes that higher risk but lower cost ways of implementing an improved Performance-based NAS are achievable. The benefits and cost savings are on the higher end of the current estimated range. Wide usage of EFBs and lower cost avionics in general aviation aircraft are necessary to achieve these estimates.
Perf.
Based
NAS
FY 2005 08 11 14 17 20 23 26 29 32 35
Mixed
Equipage
TODAY
TODAY
• New policies that accelerate avionicsdevelopment and stimulate equipage
• Validate controller impacts assessment
• Equip fleet with needed avionics
• Complete WAAS
• Develop LPV Approaches
• Implement roadmap for performance-based navigation
• Implement controller-pilot data link
• Develop procedures/airspace changes
• Install ADS-B ground infrastructure and necessary automation changes
• Complete training on new procedures (pilots and controllers)
• Develop package 1 ASAS (ADS-B/CDTI) applications
A question arises; why is it so important to achieve nearly full equipage to reap the benefits of an improved Performance-based NAS? The answer is that in most cases the benefits and costs savings are very limited if there is mixed equipage. This is particularly true of controller productivity benefits and infrastructure cost savings as results of equipment divestiture and replacing radars for ATC purposes with ADS-B.
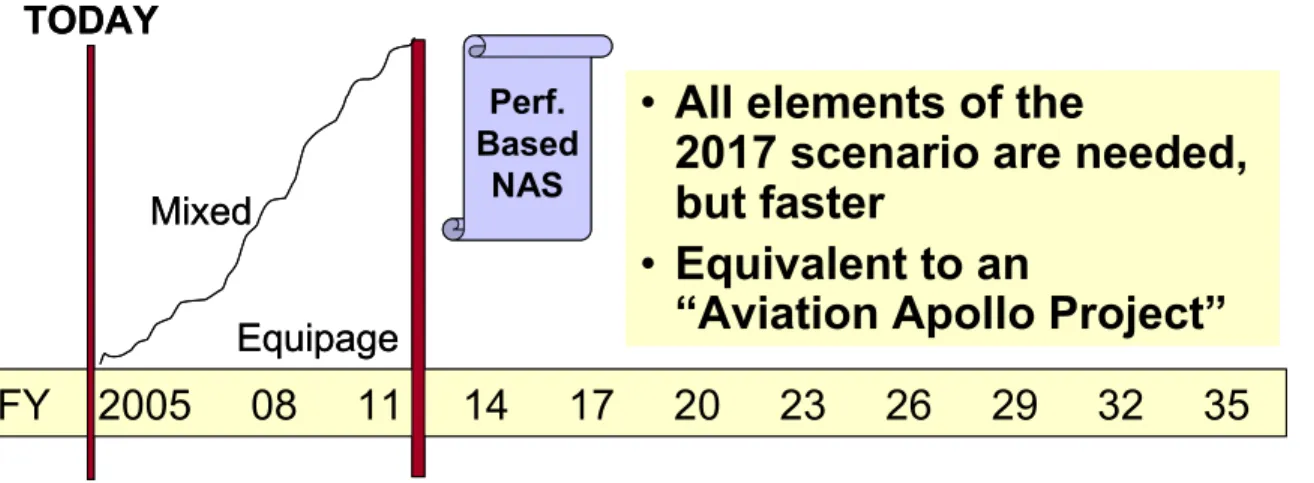
C. Best Case at 2011
In order to accelerate the expected benefits, the possibility of transitioning to an improved Performance-based NAS by 2011 was explored and found to be extremely unlikely. First, it was assumed that an equipage mandate would be required to force accomplishment at such an early date. Even a short period of only 3 years for aircraft avionics equipage would require that avionics be certified and a rule issued by 2008. Since the normal process of public input to the FAA on rulemaking normally takes 3 years in itself, that process would have to be abandoned. A major event, such as a Presidential Directive or a Congressional Decree would be required in 2006 in order to issue a final rule in 2008. This would be the equivalent of an “Aviation Apollo Project”. At this time, there does not appear to be a strong enough case to expect such an action.
From the technical perspective, in order to certify avionics for installation by 2008, trials would have to start in 2006, along with the associated changes to the ground infrastructure and automation. Again, there does not appear to be a large enough impetus to force such immediate action. The analysis is presented for this scenario in order to provide an upper bound to the cost/benefit story.
IV. Costs
A. FAA
Figures 4 and 5 present the authors’ estimates of the FAA costs associated with the four scenarios mentioned above. The graphics present all data using the 2033 business-as-usual scenario as the baseline. Thus, all scenarios are presented as relative to this 2033 scenario. As is evident from the graphics, the 2017 low and high risks scenarios and the 2011 accelerated scenario all have higher annual costs to the FAA in the initial phase. However in the 2011 to 2014 time frame the costs to the FAA on an annual basis are reduced. By 2033 the annual savings to the FAA are between .6 billion and 1.0 billion dollars.
Perf.
Based
NAS
FY 2005 08 11 14 17 20 23 26 29 32 35
Mixed
Equipage
TODAY
•
All elements of the
2017 scenario are needed,
but faster
•
Equivalent to an
“Aviation Apollo Project”
Perf.
Based
NAS
FY 2005 08 11 14 17 20 23 26 29 32 35
Mixed
Equipage
TODAY
•
All elements of the
2017 scenario are needed,
but faster
•
Equivalent to an
“Aviation Apollo Project”
What creates the added costs up front and what produces the significant savings in the out years? Savings come in basically two types for the FAA: the reduction in infrastructure maintenance costs and increased productivity associated with controllers as a result of new investments. The infrastructure cost savings are more firm and are based on relatively detailed analyses of radar and navigation costs. The controller productivity savings are more tentative but are based on numerous studies related to data link and to new functions associated with ADS-B which permit some of the current controller tasks to be handled by pilots. These are documented in numerous Eurocontrol and MITRE papers
With respect to infrastructure, there is a significant cost savings related to accelerating WAAS equipage for general aviation. It is assumed that without accelerated equipage, there will not be enough WAAS equipped aircraft to begin the NAVAID divestiture and that a full space-based WAAS system will coexist with a full NAVAID ground system until 2033. By 2033, it is assumed in the business-as-usual scenario that all general aviation aircraft that fly IFR will have a WAAS navigator box. In the conservative and aggressive scenarios different levels of ILS and VORs are divested and in the aggressive scenario no new ILS are built. This divestment occurs between 2011 and 2017, depending on the scenario. The savings range from .7 to 3.4 billion dollars between 2006 and 2033.
Annual FAA Costs by Scenario (Relative to Business-As-Usual)
-$1,200 -$1,000 -$800 -$600 -$400 -$200 $0 $200 $400 $600 2006 2007 2008 2009 2010 2011 2012 2013 2014 2015 2016 2017 2018 2019 2020 2021 2022 2023 2024 2025 2026 2027 2028 2029 2030 2031 2032 2033 Year M illlio n D o lla rs
Business-As-Usual 2017 Low Risk 2017 High Risk 2011 Best Case
Figure 4. Total FAA Costs Relative to the 2033 Business-as-Usual Scenario.
Cumulative FAA Costs (Relative to Business-As-Usual)
-$18,000 -$16,000 -$14,000 -$12,000 -$10,000 -$8,000 -$6,000 -$4,000 -$2,000 $0 $2,000 2006 2008 2010 2012 2014 2016 2018 2020 2022 2024 2026 2028 2030 2032 Year M illio n D o ll a rs Business-As-Usual 2017 Conservative 2017 Aggressive 2011 Best Case
It is assumed in the 2017 conservative and aggressive cases that all aircraft are equipped with ADS-B and that secondary radars can be decommissioned. Also, additional radars for both ASDE-X and for en route and terminal radars are not needed and are replaced by ADS-B. This results in a savings of 1-3 billion dollars between 2006 and 2033.
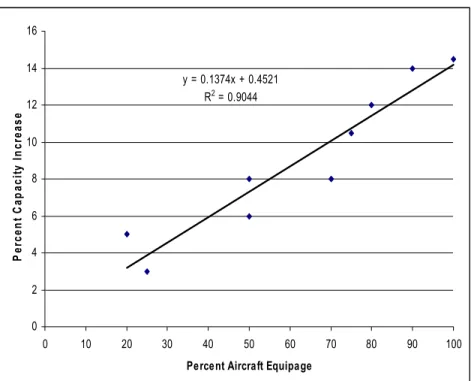
With respect to controller productivity, based on several Eurocontrol and MITRE studies, it was assumed that a 15% improvement in controller productivity for en route operations could be realized by spacing and merging applications that are being developed by Eurocontrol in their Package 1. With respect to data link, it was assumed that a 14% improvement for the R-controller can be realized using data link alone. These controller productivity estimates do not include additional benefits that could be realized by increased automation on the ground. These results were based on numerous studies and the results of the data link analysis are presented in Figure 6 (each data point is a separate study), with the ADS-B results presented in the References section.
Table 1 presents the combined cost estimates to the FAA using the business-as-usual scenario as a baseline. y = 0.1374x + 0.4521 R2 = 0.9044 0 2 4 6 8 10 12 14 16 0 10 20 30 40 50 60 70 80 90 100 Percent Aircraft Equipage
P er cen t C ap aci ty I n cr ea se
Figure 6. En Route Controller Capability to Handle More Traffic as a Percentage of Aircraft Equipped. (Source: MITRE Technical Report MTR 04W0000081 by Giles, Lowry, Steinbach and Shingledecker).
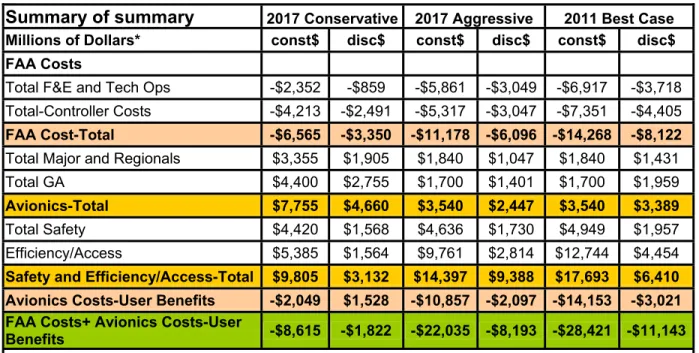
Table 1. FAA Cost Differential Between 2006 and 2033 Comparing 3 Scenarios to the Business-as- Usual Scenario.
Summary of summary
2017 Conservative 2017 Aggressive 2011 Best CaseMillions of Dollars* const$ disc$ const$ disc$ const$ disc$
FAA Costs
Total F&E and Tech Ops -$2,352 -$859 -$5,861 -$3,049 -$6,917 -$3,718
Total-Controller Costs -$4,213 -$2,491 -$5,317 -$3,047 -$7,351 -$4,405
FAA Cost-Total -$6,565 -$3,350 -$11,178 -$6,096 -$14,268 -$8,122 * 3% discount rate for FAA costs, 7% for user costs and benefits.
B. Users
In order to transition completely to an improved Performance-based NAS, it is necessary for 100% of aircraft in any given airspace to be capable of the specified performance-based operations. If non-capable aircraft are present, the resulting “work around” procedures often negate much of the benefits for the other capable aircraft. Therefore, avionics upgrades are necessary for aircraft that do not possess the necessary degree of performance-based capabilities.
The total certification and installation cost to the entire US aviation community was forecasted at $9 billion. The largest portion of this cost ($7B) is the installation of CDTI to enable new operational procedures. If the display function could be performed by an installed (Class 3) EFB, and General Aviation avionics could be reduced by 50%, then the total avionics cost could be reduced to $5 billion. The annual avionics costs are presented in Figure 7.
The avionics cost could also be reduced by aggressively implementing these technologies into newly manufactured aircraft. The cost to install these capabilities in an aircraft during manufacturing is a small fraction of the cost to perform a later retrofit. However, the aircraft operators and manufacturers need to be convinced that the forthcoming operational changes will take place on schedule before they will commit to extra costs, even during manufacturing.
In this analysis we assumed that the operational changes of the improved Performance-based NAS would be introduced over a large enough timeframe to allow for training of flightcrew at their regular recurrent training intervals. Therefore, no additional training costs were assumed.
V. Benefits
The user benefits are not fully known so they are incomplete in this analysis. The benefits that have been calculated are the safety benefits that are derived from both WAAS provided vertical landing guidance, and ADS-B/CDTI technology on general aviation aircraft. This technology provides for enhanced visual awareness of proximate aircraft, avoidance of terrain and weather information to the cockpit. Safety benefits mostly accrued to the landing phase of flight. The other major safety benefit that was calculated was an elimination of runway incursion accidents on the ground. It was assumed that every ten years a major runway incursion accident occurred between two commercial aircraft resulting in major loss of life and loss of aircraft. With improved situational awareness, it was concluded that these could be avoided. This conclusion was based on numerous NASA studies and the results of surface trials under Safe Flight 21.
Quantified congestion benefits were limited because there are not adequate studies to determine the efficiency benefits of ADS-B/CDTI and data link. Earlier data link benefits did include an efficiency benefit but did not account for similar benefits that result from reduced communication as a result of RNP and RNAV being
Avionics Costs Const $ (Relative to Business-As-Usual)
-$200
$0
$200
$400
$600
$800
$1,000
$1,200
$1,400
$1,600
20
06
20
09
20
12
20
15
20
18
20
21
20
24
20
27
20
30
20
33
Years M illio n $ Business-As-Usual 2017 Conservative 2017 Aggressive 2011 Best Caseimplemented. There is not definitive analysis of the efficiency benefits associated with ADS-B/CDTI for spacing and merging applications. However, there is considerable analysis of the CDTI/ADS-B Assisted Visual Approach (CAVS) applications that shortly should be approved for use by United Parcel Service. The CAVS capabilities were modeled at the major Operational Evolution Plan (OEP) airports and savings in reduced delays were calculated. The results of the benefits analysis are shown in Figure 8.
In comparing Figure 9 with Figure 5, it is clear that the payback period for the users is further in the future than for the FAA and that the uncertainty seems to be greater. This provides further evidence that government policy should be evaluated to see whether incentives can be provided to the users to reduce their risks and increase their return on investment.
Safety and Efficiency (Relative to Business-As-Usual)
$0 $100 $200 $300 $400 $500 $600 $700 $800 $900 $1,000 200 6 2007 2008 20092010 20112012 2013 201420152016 201720182019 2020 20212022 20232024 2025 202620272028 202920302031 203 2 203 3 Year M ill io n $
Business-As-Usual 2017 Conservative 2017 Aggressive 2011 Best Case
Figure 8: Calculated User Benefits.
Cumulative User Cost-Benefits (Relative to Business-As-Usual)
-$20,000 -$15,000 -$10,000 -$5,000 $0 $5,000 $10,000 2006 2007 2008 2009 2010 2011 2012 2013 2014 2015 2016 2017 2018 2019 2020 2021 2022 2023 2024 2025 2026 2027 2028 2029 2030 2031 2032 2033 Year M illio n $
Business-As-Usual 2017 Conserative 2017 Aggressive 2011 Best Case
VI. Conclusion
It is clear from this analysis that an improved Performance-based NAS accrues benefits to both the users and the FAA. The surprising conclusion is that the FAA may achieve larger benefits than the users, and that higher costs may be associated more with avionics investments than in extra FAA investments. Furthermore, the required payback period for the users is much shorter than for the FAA (see the discounted values in Table 2 for the FAA savings and user benefits). Thus, if the aviation community is ever to achieve the benefits of an improved Performance-based NAS within the 2017 timeframe, the aircraft must be considered a key element of the NAS and the government should find mechanisms to encourage equipage. The results may change as we better understand the user benefits of the Performance-based NAS applications. However, with a 7% user discount rate (which is very conservative), the likelihood of the results changing is not great. Table 2 presents the aggregate costs and benefits in constant and discounted dollars. These values are all presented as differences from the business-as-usual case. In the 2017 Low Risk scenario the user costs exceed their benefits (in discounted dollars), while the FAA cost savings are substantial. If the FAA can contribute to the cost of the avionics, thus improving the “business case” for the users, the probability of achieving the FAA cost savings is greatly increased.
VI. References
A. Navigation Cost Savings
• The MITRE Corporation, Navigation Evolution Plan (Draft),June 2004 (available from the FAA and MITRE)
• Navigation Costs data provided to MITRE/CAASD via FAA/ATO-W, (contact authors for more information)
B. Surveillance Cost Savings
• Data provided by FAA/ATO-P (via Paul Fontaine) for input to the JRC for ADS-B/broadcast services with input from MCR Corporation (contact authors for more information)
Table 2. Total NAS Cost Differential Between 2006 and 2033.
Summary of summary
2017 Conservative 2017 Aggressive 2011 Best CaseMillions of Dollars* const$ disc$ const$ disc$ const$ disc$
FAA Costs
Total F&E and Tech Ops -$2,352 -$859 -$5,861 -$3,049 -$6,917 -$3,718
Total-Controller Costs -$4,213 -$2,491 -$5,317 -$3,047 -$7,351 -$4,405
FAA Cost-Total -$6,565 -$3,350 -$11,178 -$6,096 -$14,268 -$8,122
Total Major and Regionals $3,355 $1,905 $1,840 $1,047 $1,840 $1,431
Total GA $4,400 $2,755 $1,700 $1,401 $1,700 $1,959
Avionics-Total $7,755 $4,660 $3,540 $2,447 $3,540 $3,389
Total Safety $4,420 $1,568 $4,636 $1,730 $4,949 $1,957
Efficiency/Access $5,385 $1,564 $9,761 $2,814 $12,744 $4,454
Safety and Efficiency/Access-Total $9,805 $3,132 $14,397 $9,388 $17,693 $6,410 Avionics Costs-User Benefits -$2,049 $1,528 -$10,857 -$2,097 -$14,153 -$3,021 FAA Costs+ Avionics Costs-User
Benefits -$8,615 -$1,822 -$22,035 -$8,193 -$28,421 -$11,143 * 3% discount rate for FAA costs, 7% for user costs and benefits.
C. Data Link Costs
• Giles, Lowry, Steinbach and Shingledecker, CPDLC Benefit-Cost Analysis Methodology, MITRE Technical Report MTR 04W0000081, September 2004
D. Baseline Controller Staffing
• FAA, A plan for the future: The Federal Aviation Administration’s 10-year strategy for Air Traffic Control Workforce 2005-2014, December 2004
• Salaries derived from pay at each ARTCC and only included benefits and did not include any other overhead expenses.
E. Controller Productivity from Data Link
• Giles, Lowry, Steinbach and Shingledecker, CPDLC Benefit-Cost Analysis Methodology, MITRE Technical Report MTR 04W0000081, September 2004
F. Controller Productivity from ADS-B
• #1 Simons, E., Hawkins, P., DeSenti, C., Mills, S., Controller-Assigned Airborne Separation (CAAS), Results of Initial Pairwise Study, AIAA/IEEE 23rd Annual Digital Avionics Systems Conference (DASC), Salt Lake City, Utah, October 2004
• #2 EUROCONTROL Experimental Centre CoSpace 2002 Flight Deck Experiments Assessing the Impact of Spacing Instructions From Cruise to Initial Approach, Volume I, 5.3 EUROCONTROL Agency, Brétigny-sur-Orge CEDEX, France, 2002.
• #3 Grimaud, I., E. Hoffman, L. Rognin, K. Zeghal. Towards the Use of Spacing Instructions for Sequencing Arrival Flows. Eurocontrol. OPLINKJ-P/WGA paper presented by Soren Dissing at Operational Datalink Panel (OPLINKP) Meeting of Working Group A. Annapolis, MD., 2003.
• #4 Grimaud, I., E. Hoffman, L. Rognin, K. Zeghal., Towards a New Task Distribution between Controller and Flight Crew to Manage Aircraft Spacing,. Eurocontrol article for “The Controller,” IFATCA, Volume 41, No. 2, 2002.
• #5 Hoffman, E, I. Grimaud, L. Rognin, K. Zeghal. Delegation of Crossing Operations to the Flight Crew: First Quantitative Results, Eurocontrol. Published by AIAA. AIAA-2001-4178, 2001.
• #6 Hoffman, E, I. Grimaud, L. Rognin, K. Zeghal., An Integrated Approach to Validate the CoSpace Concept, Eurocontrol. Bretigny, France, 2001.
• #7 Mackintosh, M., Dunbar, M., Lozito, S., Cashion, P., McGann, A., Dulchinos, V., Ruigrok, R., Hoekstra, J., van Gent, R., Self-Separation From the Air and Ground Perspective, 2nd USA/Europe Air Traffic Management R&D Seminar, Orlando, Florida, 1998.
• #8 Leiden, K., P. Kopardekar, Green, S., Controller Workload Analysis Methodology to Predict Increases in Airspace Capacity, Presented at AIAA’s 3rd Annual Aviation Technology, Integration, and Operations (ATIO) Tech. Denver, CO, 2003.
When Where What Study Operation Metric
1998 NASA NLR
Self-Separation From the Air and Ground Perspective (Ref #7)
Spacing 25%
42% 19% 35%
2002 EEC CoSpace(Ref #2) Spacing 70%
2002 ERC
EATMP
Spacing Instructions for
Arrival Flows(Ref #3) Spacing
35% Spacing & Merging 70% 10% w/ 33% 20% w/ 6%
Reduced Maneuvering Instructions
during approach
Reduced Aircraft Heading Changes
during pass-behind, high-alt. enroute Reduced Workload (mean TLX) with More Aircraft Controlled in 20min during medium traffic (12-15 in sector)
% Change
Reduced Heading Instructions
Reduced Speed Instructions
Reduced Maneuvering Instructions
during pass-behind, enroute Reduced Maneuvering Instructions
during sequencing for landing
Reduced Workload (mean TLX) with More Aircraft Controlled in 20min during high traffic (16-20 in sector)
2001 EEC Delegation of Crossing Operations to Flight Crew
(Ref #5)
Crossing
2004 CAASD Controller-AssigneAirborne Separation (CAAS)d
(Ref #1) Crossing
Reduced Controller Instructions
G. Safety Analysis
• Kirkman , W, Stock, T., Peed, D. “Broadcast Services Evolution Path: Preventing Fatal GA Accidents by Market or FAA Services”, MITRE/CAASD, July 15, 2002 (broadcast services)
• WAAS related accidents assume that IFR arrival accidents are cut by 50% and no other credit is given to WAAS for safety benefits
H. Efficiency and Capacity
• WAAS access calculation provide by MITRE/CAASD in currently unpublished document. It is calculated by determining the percentage of IFR GA flights that would not have access to airports without ILS between 250 and 350 feet. This is generally the difference between having a WAAS box and an LNAV landing minimum. This only addressed business oriented flights and a cancellation was valued at $920/ cancelled flight (see authors for more detail).
• ADS-B efficiency: FAA. Safe Flight 21 CDTI Enhanced Flight Rules (CEFR) Initial Benefit Analysis (Version 3), May 30, 2005.
I. Avionics Costs
• WAAS costs are based on vendor price of $12500 for new aircraft and $3000 for retrofit aircraft. It is assumed that 100,000 GA aircraft will utilize WAAS equipage and that 30,000 will be retrofit. (Vince Massamini, MITRE). For 2017 conservative and Business-as-usual case this was multiplied by 1.5.
• For ADS-B and data link avionics costs, the total quantities of aircraft matched the FAA forecasts ( ref.) and the avionics unit costs were obtained by contacting avionics manufacturers and airlines.
VII. Acknowledgments
The data presented in this paper is a compilation of numerous studies conducted by MITRE CAASD staff over the last several years. Some of this work has been published, but most has not. The authors acknowledge that the following individuals, among others, contributed greatly to the creation of this paper: Randy Bone, Frank Buck, Jim Chadwick, Les Crane, Steve Giles, Niamh Lowry, Kelly Markin, Jeff Mittelman, Jim Nickum, Doyle Peed, Walt Scales, Elliott Simons, Michele Steinbach, Todd Stock and Mel Zeltser.
Any reader who desires additional information should contact the authors directly at:
Kent Hollinger (703) 983-5573 [email protected] Marc Narkus-Kramer (703) 983-5363 [email protected]
The authors express their appreciation to Vanessa Fong, Dave Hamrick and Joe Sinnott for their review of the paper. Also, special recognition is given to Janet Harvey for her work with the technical format and editing.
NOTICE
This work was produced for the U.S. Government under Contract DTFA01-01-C-00001 and is subject to Federal Aviation Administration Acquisition Management System Clause 3.5-13, Rights In Data-General, Alt. III and Alt. IV (Oct. 1996).
The contents of this document reflect the views of the author and The MITRE Corporation and do not necessarily reflect the views of the FAA or the DOT. Neither the Federal Aviation Administration nor the Department of Transportation makes any warranty or guarantee, expressed or implied, concerning the content or accuracy of these views.