The
new england
journal
of
medicine
established in 1812 february 26, 2009 vol. 360 no. 9
Comparison of Weight-Loss Diets with Different Compositions
of Fat, Protein, and Carbohydrates
Frank M. Sacks, M.D., George A. Bray, M.D., Vincent J. Carey, Ph.D., Steven R. Smith, M.D., Donna H. Ryan, M.D., Stephen D. Anton, Ph.D., Katherine McManus, M.S., R.D., Catherine M. Champagne, Ph.D., Louise M. Bishop, M.S., R.D.,
Nancy Laranjo, B.A., Meryl S. Leboff, M.D., Jennifer C. Rood, Ph.D., Lilian de Jonge, Ph.D., Frank L. Greenway, M.D., Catherine M. Loria, Ph.D., Eva Obarzanek, Ph.D., and Donald A. Williamson, Ph.D.
Abs tr act
From the Department of Nutrition, Har-vard School of Public Health (F.M.S., L.M.B.); the Channing Laboratory (F.M.S., V.J.C., N.L.) and the Endocrine Division (M.S.L.), Department of Medi-cine, Brigham and Women’s Hospital and Harvard Medical School; and the De-partment of Nutrition, Brigham and Women’s Hospital (K.M.) — all in Bos-ton; Pennington Biomedical Research Center of the Louisiana State University System, Baton Rouge (G.A.B., S.R.S., D.H.R., S.D.A., C.M.C., J.C.R., L.J., F.L.G., D.A.W.); and the National Heart, Lung, and Blood Institute, Bethesda, MD (C.M.L., E.O.).
N Engl J Med 2009;360:859-73. Copyright © 2009 Massachusetts Medical Society. Background
The possible advantage for weight loss of a diet that emphasizes protein, fat, or car-bohydrates has not been established, and there are few studies that extend beyond 1 year.
Methods
We randomly assigned 811 overweight adults to one of four diets; the targeted per-centages of energy derived from fat, protein, and carbohydrates in the four diets were 20, 15, and 65%; 20, 25, and 55%; 40, 15, and 45%; and 40, 25, and 35%. The diets consisted of similar foods and met guidelines for cardiovascular health. The partici-pants were offered group and individual instructional sessions for 2 years. The pri-mary outcome was the change in body weight after 2 years in two-by-two factorial comparisons of low fat versus high fat and average protein versus high protein and in the comparison of highest and lowest carbohydrate content.
Results
At 6 months, participants assigned to each diet had lost an average of 6 kg, which represented 7% of their initial weight; they began to regain weight after 12 months. By 2 years, weight loss remained similar in those who were assigned to a diet with 15% protein and those assigned to a diet with 25% protein (3.0 and 3.6 kg, respec-tively); in those assigned to a diet with 20% fat and those assigned to a diet with 40% fat (3.3 kg for both groups); and in those assigned to a diet with 65% carbo-hydrates and those assigned to a diet with 35% carbocarbo-hydrates (2.9 and 3.4 kg, re-spectively) (P>0.20 for all comparisons). Among the 80% of participants who com-pleted the trial, the average weight loss was 4 kg; 14 to 15% of the participants had a reduction of at least 10% of their initial body weight. Satiety, hunger, satisfaction with the diet, and attendance at group sessions were similar for all diets; atten-dance was strongly associated with weight loss (0.2 kg per session attended). The diets improved lipid-related risk factors and fasting insulin levels.
Conclusions
Reduced-calorie diets result in clinically meaningful weight loss regardless of which macronutrients they emphasize. (ClinicalTrials.gov number, NCT00072995.)
T
here is intense debate about whattypes of diet are most effective for treating overweight — those that emphasize protein, those that emphasize carbohydrates, or those that emphasize fat.1-3 Several trials showed that
low-carbohydrate, high-protein diets resulted in more weight loss over the course of 3 to 6 months than conventional high-carbohydrate, low-fat diets,4-12
but other studies did not show this effect.13-17
A smaller group of studies that extended the fol-low-up to 1 year did not show that low-carbohy-drate, protein diets were superior to high-carbohydrate, low-fat diets.6,10,16,18-21 In contrast,
other researchers found that a very-high-carbohy-drate, very-low-fat vegetarian diet was superior to a conventional high-carbohydrate, low-fat diet.22-24
Among the few studies that extended beyond 1 year, one showed that a very-low-fat vegetarian diet was superior to a conventional low-fat diet,24
one showed that a low-fat diet was superior to a moderate-fat diet,25 two showed that a
moderate-fat, Mediterranean-style diet was superior to a low-fat diet,12,26 one showed that a low-carbohydrate
diet was superior to a low-fat diet,12 and another
showed no difference between high-protein and low-protein diets.10 Small samples,
underrepresen-tation of men, limited generalizability, a lack of blinded ascertainment of the outcome, a lack of data on adherence to assigned diets, and a large loss to follow-up limit the interpretation of many weight-loss trials.27 The novelty of the diet, media
attention, and the enthusiasm of the researchers could affect the adherence of participants to any type of diet. The crucial question is whether over-weight people have a better response in the long term to diets that emphasize a specific macronu-trient composition. Thus, we recognized the need for a large trial that would be designed to over-come the limitations of previous trials and that would compare the effects of three principal di-etary macronutrients. We studied weight change over the course of 2 years, since weight loss typi-cally is greatest 6 to 12 months after initiation of the diet, with steady regain of weight subse-quently.28
Methods
Study Design and Sites
We designed a randomized clinical trial to com-pare the effects on body weight of energy-reduced diets that differed in their targets for intake of macronutrients — low or high in fat, average or
high in protein, or low or high in carbohydrates — and otherwise followed recommendations for cardiovascular health.29 The trial was conducted
from October 2004 through December 2007. An expanded description of the methods is available in the Supplementary Appendix, available with the full text of this article at NEJM.org. The trial was conducted at two sites: the Harvard School of Pub-lic Health and Brigham and Women’s Hospital, Boston; and the Pennington Biomedical Research Center of the Louisiana State University System, Baton Rouge. The data coordinating center was at Brigham and Women’s Hospital. The project staff of the National Heart, Lung, and Blood Institute also participated in the development of the proto-col, monitoring of progress, interpretation of re-sults, and critical review of the manuscript.
Participants
Our goal was to recruit 800 overweight and obese subjects (400 at each site), of whom about 40% would be men. Participants had to be 30 to 70 years of age and have a body-mass index (the weight in kilograms divided by the square of the height in meters) of 25 to 40. Major criteria for exclusion were the presence of diabetes or unstable cardio-vascular disease, the use of medications that affect body weight, and insufficient motivation as as-sessed by interview and questionnaire. The study was approved by the human subjects committee at each institution and by a data and safety monitor-ing board appointed by the National Heart, Lung, and Blood Institute. All participants gave written informed consent. They were informed that the study would be comparing diets with different fat, protein, and carbohydrate contents and that they would be assigned a diet at random. Mass mailings were the primary means of recruitment; names were identified with the use of lists of registered voters or drivers. Random assignments to one of four diet groups were generated by the data manager at the coordinating center on request of a study dietitian, after eligibility of a participant was confirmed.
Weight-Loss Intervention
The nutrient goals for the four diet groups were: 20% fat, 15% protein, and 65% carbohydrates (low-fat, average-protein); 20% (low-fat, 25% protein, and 55% carbohydrates (low-fat, high-protein); 40% fat, 15% protein, and 45% carbohydrates (high-fat, av-erage-protein); and 40% fat, 25% protein, and 35% carbohydrates (high-fat, high-protein). Thus, two diets were low-fat and two were high-fat, and two
were average-protein and two were high-protein, constituting a two-by-two factorial design. The four diets also allowed for a dose–response test of car-bohydrate intake that ranged from 35 to 65% of energy. Other goals for all groups were that the diets should include 8% or less of saturated fat, at least 20 g of dietary fiber per day, and 150 mg or less of cholesterol per 1000 kcal. Carbohydrate-rich foods with a low glycemic index were recom-mended in each diet. Each participant’s caloric pre-scription represented a deficit of 750 kcal per day from baseline, as calculated from the person’s rest-ing energy expenditure and activity level.
Blinding was maintained by the use of similar foods for each diet. Staff and participants were taught that each diet adhered to principles of a healthful diet29 and that each had been
recom-mended for long-term weight loss, thereby estab-lishing equipoise.1,2,26 Investigators and staff who
measured outcomes were unaware of the diet as-signment of the participants.
Group sessions were held once a week, 3 of every 4 weeks during the first 6 months and 2 of every 4 weeks from 6 months to 2 years; individu-al sessions were held every 8 weeks for the entire 2 years. Daily meal plans in 2-week blocks were provided (see the Supplementary Appendix). Par-ticipants were instructed to record their food and beverage intake in a daily food diary and in a Web-based self-monitoring tool that provided informa-tion on how closely their daily food intake met the goals for macronutrients and energy. Behavioral counseling was integrated into the group and individual sessions to promote adherence to the assigned diets. Contact among the groups was avoided.
The goal for physical activity was 90 minutes of moderate exercise per week. Participation in exercise was monitored by questionnaire30 and by
the online self-monitoring tool.
Measurements
Body weight and waist circumference were mea-sured in the morning before breakfast on 2 days at baseline, 6 months, and 2 years, and on a single day at 12 and 18 months. Dietary intake was as-sessed in a random sample of 50% of the par-ticipants, by a review of the 5-day diet record at baseline and by 24-hour recall during a telephone interview on 3 nonconsecutive days at 6 months and at 2 years.31 Questionnaires that asked for
in-formation on satiety, food craving, eating behav-ior, and satisfaction with the diet32,33 were
admin-istered at baseline (except for diet satisfaction) and at 6 months and 2 years. Fasting blood samples, 24-hour urine samples, and measurement of rest-ing metabolic rate were obtained on 1 day, and blood-pressure measurement on 2 days, at base-line, 6 months, and 2 years. Levels of serum lip-ids, glucose, insulin, and glycated hemoglobin were measured at the clinical laboratory at the Penning-ton Biomedical Research Center. Blood pressure was measured with the use of an automated de-vice (HEM-907XL, Omron). The participants were evaluated for the presence of the metabolic syn-drome, which was defined by the presence of at least three of the following five criteria: waist cir-cumference of more than 102 cm in men or more than 88 cm in women, a triglyceride level of 150 mg per deciliter (1.69 mmol per liter) or more, a high-density lipoprotein (HDL) cholesterol level of less than 40 mg per deciliter (1.03 mmol per liter) in men or less than 50 mg per deciliter (1.29 mmol per liter) in women, a blood pressure of 130/85 mm Hg or more, and a fasting glucose level of 110 mg per deciliter (6.1 mmol per liter) or more.
Statistical Analysis
The primary outcome of the study was the change in body weight over a period of 2 years, and the secondary outcome was the change in waist cir-cumference. Data were pooled from the diets for the two factorial comparisons: low fat versus high fat and average protein versus high protein. The analysis also included a comparison of two of the four diets, the diet with the lowest carbohydrate content and the diet with the highest carbohydrate content, and included a test for trend across the four levels of carbohydrates. The effects of protein, fat, and carbohydrate levels were evaluated inde-pendently with the use of two-sample t-tests at a two-sided significance level of 0.05. Exploratory post hoc analyses were performed with threshold amounts of weight loss as outcomes, with Bonfer-roni’s adjustment for multiple comparisons. As-sociations between adherence to the fat and pro-tein goals and weight loss were also explored in post hoc analyses (see Methods in the Supplemen-tary Appendix).
We performed an intention-to-treat analysis in which long-term weight loss for persons who with-drew from the study early (after at least 6 months of participation) was imputed on the basis of a rate of 0.3 kg per month of regained weight34 and a
rate of 0.3 cm per month of regained waist circum-ference after withdrawal (see Methods in the
Sup-plementary Appendix). Risk factors for cardiovas-cular disease and diabetes were also analyzed according to the intention-to-treat principle, with zero change from baseline imputed for missing
data. The study was powered to detect a 1.67-kg weight loss as an effect of the level of protein or fat in the diet over the 2-year period, assuming a withdrawal rate of 40%.
Table 1. Baseline Characteristics of the Study Participants.*
Characteristic Low-Fat, Average- Protein Group (N = 204) Low-Fat, High-Protein Group (N = 202) High-Fat, Average- Protein Group (N = 204) High-Fat, High-Protein Group (N = 201) All Participants (N = 811) Participants Who Completed the Study (N = 645) Age — yr 51±9 50±10 52±9 51±9 51±9 52±9 Sex — no. (%) Female 126 (62) 135 (67) 125 (61) 129 (64) 515 (64) 397 (62) Male 78 (38) 67 (33) 79 (39) 72 (36) 296 (36) 248 (38) Race or ethnic group — no. (%)†
White 159 (78) 158 (78) 165 (81) 161 (80) 643 (79) 525 (81) Black 33 (16) 33 (16) 28 (14) 33 (16) 127 (16) 88 (14) Asian 1 (<1) 1 (<1) 1 (<1) 2 (1) 5 (1) 3 (<1) Hispanic 8 (4) 7 (3) 9 (4) 5 (2) 29 (4) 23 (4) Other 3 (1) 3 (1) 1 (<1) 0 7 (1) 6 (1) Height — m 1.69±0.09 1.67±0.08 1.68±0.09 1.68±0.09 1.68±0.09 1.68±0.09 Weight — kg 94±16 92±13 92±17 94±16 93±16 93±16 Body-mass index‡ Mean 33±4 33±4 32±4 33±4 33±4 33±4 25.0–29.9 — no. (%) 51 (25) 54 (27) 60 (29) 58 (29) 223 (27) 183 (28) ≥30.0 — no. (%) 153 (75) 148 (73) 144 (71) 143 (71) 588 (73) 462 (72) Waist circumference — cm 104±13 102±12 103±14 104±13 103±13 104±13 Hypertension — no. (%) 70 (34) 70 (35) 67 (33) 80 (40) 287 (35) 233 (36) Use of medication — no. (%)
Antihypertensive agents 54 (26) 58 (29) 55 (27) 61 (30) 228 (28) 192 (30) Lipid-lowering agents 32 (16) 48 (24) 40 (20) 31 (15) 151 (19) 128 (20) Smoking status — no. (%)
Current smoker 8 (4) 5 (2) 8 (4) 10 (5) 31 (4) 24 (4) Former smoker 84 (41) 59 (29) 80 (39) 75 (37) 298 (37) 241 (37) Never smoked 112 (55) 138 (68) 116 (57) 116 (58) 482 (59) 380 (59) Educational level — no. (%)
High school or less 23 (11) 15 (7) 19 (9) 19 (9) 76 (9) 65 (10) Some college 47 (23) 47 (23) 45 (22) 41 (20) 180 (22) 132 (20) College graduate or beyond 134 (66) 140 (69) 140 (69) 141 (70) 555 (68) 448 (69) Marital status — no. (%)
Married 132 (65) 146 (72) 144 (71) 143 (71) 565 (70) 448 (69) Divorced or separated 36 (18) 24 (12) 33 (16) 29 (14) 122 (15) 94 (15) Widowed 8 (4) 4 (2) 4 (2) 2 (1) 18 (2) 16 (2) Never married 28 (14) 28 (14) 23 (11) 27 (13) 106 (13) 87 (13)
R esults
Participants
Of 1638 participants who were screened, 811 (50%) were randomly assigned to a diet, and 645 (80%
of those assigned) completed the study (i.e., pro-vided a body-weight measurement at 2 years) (Fig. 1 in the Supplementary Appendix). Baseline charac-teristics were similar among participants assigned to the four diets and between those who were
as-Table 1. (Continued.) Characteristic Low-Fat, Average- Protein Group (N = 204) Low-Fat, High-Protein Group (N = 202) High-Fat, Average- Protein Group (N = 204) High-Fat, High-Protein Group (N = 201) All Participants (N = 811) Participants Who Completed the Study (N = 645)
Household income — no. (%)
<$50,000 56 (27) 45 (22) 48 (24) 46 (23) 195 (24) 153 (24) $50,000 to <$100,000 79 (39) 82 (41) 78 (38) 84 (42) 323 (40) 260 (40) $100,000 to $150,000 46 (23) 43 (21) 43 (21) 32 (16) 164 (20) 123 (19) >$150,000 21 (10) 30 (15) 33 (16) 36 (18) 120 (15) 100 (16) Information not provided 2 (1) 2 (1) 2 (1) 3 (1) 9 (1) 9 (1) Risk factors Blood pressure — mm Hg Systolic 118±13 120±13 120±13 120±15 119±13 119±14 Diastolic 75±9 75±9 76±9 76±10 75±9 75±9 Glucose — mg/dl 93±12 92±17 92±12 92±13 92±14 92±12 Insulin — μU/ml 12±7 12±8 12±7.5 12±8 12±8 12±7 HOMA 2.8±1.9 2.8±2.2 2.9±1.9 2.8±1.9 2.8±2 2.8±1.9 Cholesterol — mg/dl Total 199±38 203±36 203±37 204±35 202±37 202±37 LDL 124±33 126±32 128±32 126±31 126±32 125±32 HDL 49±15 49±13 48±12 51±16 49±14 49±15 Triglycerides — mg/dl 135±82 144±79 147±93 141±85 142±85 144±87 Dietary intake per day§
No. of participants who
provid-ed information 103 106 105 102 416 330 Energy — kcal 2015±505 1862±566 2012±597 1979±599 1966±570 1978±563 Carbohydrate — % 44±8 46±8 45±8 44±7 45±8 45±8 Fat — % 38±6 36±6 37±5 38±6 37±6 37±6 Saturated fat — % 12±3 12±3 12±3 12±2 12±3 12±3 Protein — % 18±4 18±4 18±3 18±3 18±3 18±3 Dietary fiber — g 18±7 17±7 18±6 17±6 17±7 18±7 Cholesterol — mg 303±121 278±120 306±135 305±134 298±128 298±128 Alcohol — g 6±8 4±7 6±9 6±9 5±8 5±8 Respiratory quotient 0.84±0.04 0.84±0.04 0.85±0.05 0.84±0.04 0.84±0.04 0.84±0.04 * Plus–minus values are means ±SD. To convert the values for glucose to millimoles per liter, multiply by 0.05551. To convert the values for
cholesterol to millimoles per liter, multiply by 0.02586. To convert the values for triglycerides to millimoles per liter, multiply by 0.01129. HDL denotes high-density lipoprotein, HOMA homeostasis model assessment of insulin sensitivity, and LDL low-density lipoprotein. † Race or ethnic group was reported by the participants.
‡ The body-mass index is the weight in kilograms divided by the square of the height in meters. § Data are from a 50% random sample.
signed to a diet and those who completed the study (Table 1).
Weight Loss
The amount of weight loss after 2 years was sim-ilar in participants assigned to a diet with 25% protein and those assigned to a diet with 15% protein (3.6 and 3.0 kg, respectively; P = 0.22) and among those who completed each of those diets (4.5 and 3.6 kg, respectively; P = 0.11) (Fig. 1). Weight
loss was the same in those assigned to a diet with 40% fat and those assigned to a diet with 20% fat (3.3 kg, P = 0.94) and was similar among those who completed each of those diets (3.9 and 4.1 kg, re-spectively; P = 0.76). There was no effect on weight loss of carbohydrate level through the target range of 35 to 65% (Fig. 1 and 2). The change in waist circumference did not differ significantly among the diet groups (Fig. 1 and 2).
Most of the weight loss occurred in the first 36p6 0.0 Change in Weight (kg) −1.0 −0.5 −1.5 −2.0 −3.0 −3.5 −4.5 −2.5 −4.0 −5.0
Protein Fat Carbohydrate
A All Participants B Participants Who Completed the Study
Difference, −0.6 (95% CI, −1.6 to 0.4) P=0.22 Difference, 0.6 (95% CI, −0.8 to 1.9) P=0.42 AUTHOR: FIGURE: JOB: 4-C H/T RETAKE SIZE ICM CASE EMail Line H/T Combo Revised
AUTHOR, PLEASE NOTE:
Figure has been redrawn and type has been reset. Please check carefully.
REG F Enon 1st 2nd 3rd Sacks 1 of 4 02-26-09 ARTIST: ts 36009 ISSUE: 0.0 Change in Weight (kg) −1.0 −0.5 −1.5 −2.0 −3.0 −3.5 −4.5 −2.5 −4.0 −5.0
Protein Fat Carbohydrate
Difference, −0.9 (95% CI, −2.1 to 0.2) P=0.11 Difference, 0.7 (95% CI, −0.9 to 2.3) P=0.37
Change in Waist Circumference (cm)
Protein Fat Carbohydrate
C All Participants D Participants Who Completed the Study
Difference, −0.7 (95% CI, −1.7 to 0.4) P=0.22 Difference, 0.7 (95% CI, −0.8 to 2.1) P=0.39 0
Change in Waist Circumference (cm)
−2 −1 −3 −4 −6 −5 −7 0 −2 −1 −3 −4 −6 −5 −7
Protein Fat Carbohydrate
Difference, −1.1 (95% CI, −2.3 to 0.2) P=0.10 Difference, 1.0 (95% CI, −0.7 to 2.8) P=0.24 High protein, fat, or carbohydrate Low or average protein, fat, or carbohydrate
Difference, 0.04 (95% CI, −0.9 to 1.0) P=0.94 Difference, 0.2 (95% CI, −1.0 to 1.3) P=0.76 Difference, 0.0 (95% CI, −1.0 to 1.0) P=0.99 Difference, 0.0 (95% CI, −1.3 to 1.2) P=0.95
Figure 1. Mean Change in Body Weight and Waist Circumference from Baseline to 2 Years According to Dietary Macronutrient Content.
Solid bars represent high-protein, high-fat, or highest-carbohydrate diets. Open bars represent average-protein, low-fat, or lowest-carbo-hydrate diets. T bars indicate standard errors. Panels A and C show the change in body weight and the change in waist circumference, respectively, for all participants who were randomly assigned to a diet (a total of 811); missing data were imputed. A total of 403 partici-pants were assigned to a high-protein diet and 408 to an average-protein diet, 405 were assigned to a high-fat diet and 406 to a low-fat diet, and 204 were assigned to the highest-carbohydrate diet and 201 to the lowest-carbohydrate diet. Panel B shows the change in body weight for the 645 participants who provided measurements at 2 years. Of these participants, 325 were assigned to a high-protein diet and 320 to an average-protein diet, 319 were assigned to a high-fat diet and 326 to a low-fat diet, and 169 were assigned to the highest-carbohydrate diet and 168 to the lowest-highest-carbohydrate diet. Panel D shows the change in waist circumference for the 599 participants who provided measurements at 2 years. Of these participants, 303 were assigned to a high-protein diet and 296 to an average-protein diet, 292 were assigned to a high-fat diet and 307 to a low-fat diet, and 159 were assigned to the highest-carbohydrate diet and 155 to the lowest-carbohydrate diet.
6 months. Changes from baseline differed among the diet groups by less than 0.5 kg of body weight and 0.5 cm of waist circumference (Fig. 2). After 12 months, all groups, on average, slowly regained body weight. A total of 185 of the participants (23%) continued to lose weight from 6 months to 2 years; the mean (±SD) additional weight loss was 3.6±3.5 kg, for a mean total loss from baseline of 9.3±8.2 kg, with no significant differences among the diet groups. At 2 years, 31 to 37% of the par-ticipants had lost at least 5% of their initial body weight, 14 to 15% of the participants in each diet group had lost at least 10% of their initial weight,
and 2 to 4% had lost 20 kg or more (P>0.20 for the comparisons between diets).
Risk Factors for Cardiovascular Disease and Diabetes
All the diets reduced risk factors for cardiovascu-lar disease and diabetes at 6 months and 2 years (Table 2). At 2 years, the two low-fat diets and the highest-carbohydrate diet decreased low-density lipoprotein cholesterol levels more than did the high-fat diets or the lowest-carbohydrate diet (low-fat vs. high-(low-fat, 5% vs. 1% [P = 0.001]; highest-carbohydrate vs. lowest-highest-carbohydrate, 6% vs. 1%
36p6
Change in Weight from Baseline (kg)
A All Participants B Participants Who Provided Measurements at Various Time Points
AUTHOR: FIGURE: JOB: 4-C H/T RETAKE SIZE ICM CASE EMail Line H/T Combo Revised
AUTHOR, PLEASE NOTE: Figure has been redrawn and type has been reset.
Please check carefully.
REG F Enon 1st 2nd 3rd Sacks 2 of 4 02-26-09 ARTIST: ts 36009 ISSUE:
Change in Weight from Baseline (kg)
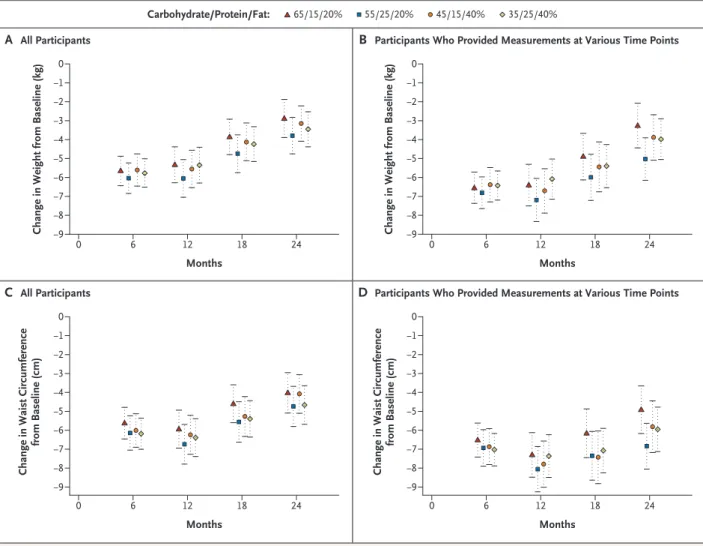
C All Participants D Participants Who Provided Measurements at Various Time Points 0 −2 −1 −3 −4 −7 −5 −9 0 −2 −1 −3 −4 −7 −5 −9 −6 −8 −6 −8 0 6 12 18 24 0 6 12 18 24 Months Months Months Carbohydrate/Protein/Fat: 65/15/20% 55/25/20% 45/15/40% 35/25/40%
Change in Waist Circumference
from Baseline (cm) 0 −2 −1 −3 −4 −7 −5 −9 −6 −8 0 6 12 18 24 Months 0
Change in Waist Circumference
from Baseline (cm) −2 −1 −3 −4 −7 −5 −9 −6 −8 0 6 12 18 24
Figure 2. Mean Changes in Body Weight and Waist Circumference at Various Time Points.
Panels A and C show the mean changes in body weight and waist circumference, respectively, for all participants who were assigned to a diet (a total of 811 at every time point); missing data were imputed. Panel B shows the change in body weight for participants who pro-vided measurements at various time points: 176 to 180 participants at 6 months, 157 to 167 at 12 months, 140 to 152 at 18 months, and 151 to 168 at 2 years. Panel D shows the change in waist circumference for participants who provided measurements at various time-points: 176 to 179 at 6 months, 154 to 166 at 12 months, 135 to 148 at 18 months, and 137 to 159 at 2 years. I bars in all panels indicate standard errors.
[P = 0.01]). The lowest-carbohydrate diet increased HDL cholesterol levels more than the highest-car-bohydrate diet (9% vs. 6%, P = 0.02). All the diets decreased triglyceride levels similarly, by 12 to 17%. All the diets except the one with the highest car-bohydrate content decreased fasting serum insu-lin levels by 6 to 12%; the decrease was larger with the high-protein diet than with the average-protein diet (10% vs. 4%, P = 0.07). Blood pressure de-creased from baseline by 1 to 2 mm Hg, with no significant differences among the groups (P>0.59 for all comparisons). These changes in risk factors in the intention-to-treat population were about 30 to 40% smaller than the changes seen among
participants who provided data at 2 years, reflect-ing the effect of the imputation of missreflect-ing values (Table 1 in the Supplementary Appendix). The metabolic syndrome35 was present in 32% of the
participants at baseline, and the percentage was lower at 2 years, ranging from 19 to 22% in the four diet groups (P = 0.81 for the four-way com-parison).
Adherence, Diet Acceptability, Satiety, and Satisfaction
Mean reported intakes at 6 months and 2 years did not reach the target levels for macronutrients (Table 2). The reported intakes represented
differ-Table 2. Risk Factors, Nutrient Intake, and Biomarkers of Adherence, According to Diet, at 6 Months and 2 Years.*
Variable Low Fat, Average Protein Low Fat, High Protein
6-Mo Value
Change from
Baseline Value2-Yr
Change from
Baseline 6-Mo Value
Change from
Baseline Value2-Yr
Change from Baseline Risk factors† Cholesterol (mg/dl) Total 188±36 –5.9 192±37 –3.7 193±39 –4.9 197±40 –2.9 LDL 116±29 –6.6 117±31 –5.9 120±33 –4.8 121±33 –3.9 HDL 49±13 –0.4 51±15 5.6 51±13 2.7 53±15 6.5 Triglycerides (mg/dl) 116±73 –14.2 120±83 –11.5 114±63 –20.4 120±67 –16.6 Blood pressure (mm Hg) Systolic 116±12 –1.2 117±12 –0.8 117±12 –2.6 118±13 –1.7 Diastolic 74±9 –1.4 74±9 –0.8 73±9 –3.1 74±9 –1.3 Glucose (mg/dl) 90±11 –3.0 94±12 1.1 90±16 –2.6 93±17 1.0 Insulin (μU/ml) 10±7 –16.2 12±10 –2.4 10±6 –19.9 11±8 –11.5 HOMA 2.3±1.6 –18.7 2.8±2.3 –1.4 2.2±1.6 –22.7 2.5±2.2 –10.4 Nutrient intake per day
Energy (kcal) 1636±484 –477 1531±480 –554 1572±568 –353 1560±461 –402 Carbohydrate (%) 57.5±11.1 12.8 53.2±11 9.3 53.4±8.5 7.4 51.3±9.2 6.8 Protein (%) 17.6±3.4 0.2 19.6±3.9 2.1 21.8±3.8 3.9 20.8±4 2.5 Fat (%) 26.2±8 –11.8 26.5±8 –12.0 25.9±6.8 –10.1 28.4±8.1 –8.4 Saturated fat (%) 7.5±3.2 –4.9 8±3.1 –4.3 7.9±2.7 –3.9 8.9±3.8 –3.1 Biomarkers of adherence Urinary nitrogen (g)‡ 11.1±4.1 –11.5 11.8±4.6 –9.1 11.9±4.3 –2.5 11.8±3.9 –2.8 Respiratory quotient§ 0.84±0.04 0.58 0.83±0.04 –0.48 0.84±0.04 0.16 0.84±0.04 –0.84 * Plus–minus values are means ±SD. Change from baseline is percent change in the case of risk factors and biomarkers of adherence and
ac-tual change in the case of nutrient intake per day. Nutrient intake was determined by three 24-hour recalls. To convert the values for choles-terol to millimoles per liter, multiply by 0.02586. To convert the values for triglycerides to millimoles per liter, multiply by 0.01129. To con-vert the values for glucose to millimoles per liter, multiply by 0.05551. HDL denotes high-density lipoprotein, HOMA homeostasis model assessment of insulin sensitivity, and LDL low-density lipoprotein.
† Data were included for 201 participants per group; missing values were imputed.
‡ Data were included for 200 to 204 participants per group at baseline, 139 to 153 at 6 months, and 88 to 109 at 2 years. § Data were included for 201 to 204 participants per group at baseline, 157 to 164 at 6 months, and 113 to 132 at 2 years.
ences from target levels of fat, protein, and car-bohydrate intake of 8.0, 4.2, and 14.4 percentage points, respectively, at 6 months and 6.7, 1.4, and 10.2 percentage points, respectively, at 2 years. Re-ported energy intakes and physical activity were similar among the diet groups. The participants who completed the study had a mean weight loss of 6.5 kg at 6 months, which corresponds to a reduction in daily energy intake of approximately 225 kcal.
There was a larger increase from baseline in the HDL cholesterol level, a biomarker for dietary car-bohydrate, in the lowest-carbohydrate group than in the highest-carbohydrate group (a difference in the change of 2 mg per deciliter at 2 years) (Ta-ble 1 in the Supplementary Appendix); this dif-ference corresponds to a predicted difdif-ference in carbohydrate intake of 6%.36 There was a larger
decrease in urinary nitrogen excretion from base-line in the average-protein group than in the
high-protein group (a difference in the change of 1.6 g at 6 months and 0.8 g at 2 years) (Table 3); these differences correspond to a difference in dietary protein of 10 g per day and 5 g per day, respec-tively. The respiratory quotient was 0.84 at baseline in both the high-fat and low-fat groups, and the between-group difference in the change at 2 years (the value in the high-fat group minus the value in the low-fat group) was −0.02 (P = 0.002) (Ta-ble 3). Thus, changes in biomarkers confirmed that differences among the groups in macronu-trient intake were consistent with those recorded in the dietary reports and that participants modi-fied their intake of macronutrients in the direc-tion of the goals, although the targets were not fully achieved.
Craving, fullness, and hunger and diet-satisfac-tion scores were similar at 6 months and at 2 years among the diets (Table 2 in the Supplementary Appendix).
High Fat, Average Protein High Fat, High Protein
6-Mo Value
Change from
Baseline Value2-Yr
Change from
Baseline 6-Mo Value
Change from
Baseline Value2-Yr
Change from Baseline 195±39 –3.7 202±39 –0.3 199±35 –2.3 202±38 –0.8 123±33 –3.2 127±33 –0.2 124±31 –1.1 124±31 –1.3 49±13 2.9 51±13 6.3 53±15 4.0 55±17 8.8 120±88 –18.1 129±89 –12.4 114±71 –19.5 118±71 –16.7 118±12 –1.5 118±12 –1.3 119±12 –1.7 120±14 –0.7 74±9 –2.3 75±9 –1.5 74±9 –1.8 76±9 –0.3 90±12 –1.9 93±13 1.6 91±12 –1.2 94±15 2.8 10±7 –18.2 12±8 –6.4 10±9 –14.4 11±7 –9.2 2.4±1.8 –18.6 2.8±2.1 –3.5 2.4±2.9 –13.4 2.6±1.9 –6.3 1607±499 –456 1521±530 –434 1624±484 –385 1413±427 –389 49.1±8.6 5.0 48.6±10 2.4 43±6.7 –0.2 42.9±8.3 –0.4 18.4±4.5 0.5 19.6±5.2 2.1 22.6±4.4 4.3 21.2±5.2 3.4 33.9±6.7 –3.8 33.3±8.2 –3.5 34.3±7.8 –3.7 35.1±7 –3.4 9±2.5 –3.0 9.8±3.3 –2.1 9±2.6 –3.7 10.5±2.7 –1.7 10.3±4.4 –17.3 11.2±3.8 –8.8 12.6±4.7 0.7 12.5±5.3 –1.9 0.84±0.04 –1.58 0.83±0.04 –3.16 0.84±0.04 –0.52 0.83±0.04 –1.92
Table 3. Factorial-Design Estimates of Effect of Diet Type on Mean Changes from Baseline in Risk Factors, Nutrient Intake, and Biomarkers of Adherence.* Variable Change with High Fat minus Change with Low Fat Change with High Protein minus Change with Average Protein Change with Highest Carbohydrate minus Change with Lowest Carbohydrate At 6 Mo P Value At 2 Yr P Value At 6 Mo P Value At 2 Yr P Value At 6 Mo P Value At 2 Yr P Value Risk factors† Cholesterol (mg/dl) Total 4.7±1.8 0.01 5.6±1.9 0.003 2.3±1.8 0.20 0.2±1.9 0.92 –7.0±2.6 0.007 –5.8±2.6 0.02 LDL 4.4±1.6 0.005 5.1±1.6 0.001 2.4±1.6 0.13 0.5±1.6 0.74 –6.8±2.3 0.003 –5.7±2.2 0.01 HDL 1.1±0.5 0.01 0.7±0.5 0.12 1.1±0.5 0.02 0.9±0.5 0.05 –2.2±0.6 0.001 –1.7±0.7 0.01 Triglycerides (mg/dl) –2.8±4.3 0.52 –1.2±4.0 0.76 –5.4±4.3 0.21 –6.7±4.0 0.10 8.1±5.0 0.10 7.9±6.0 0.19 Blood pressure (mm Hg) Systolic 0.4±0.7 0.59 0.3±0.7 0.64 –1.0±0.7 0.14 –0.2±0.7 0.77 0.6±0.9 0.51 –0.1±0.9 0.89 Diastolic 0.1±0.5 0.77 0.1±0.5 0.85 –0.5±0.5 0.32 0.2±0.5 0.59 0.3±0.7 0.62 –0.3±0.7 0.61 Glucose (mg/dl) 1.2±0.6 0.04 1.1±0.5 0.05 0.5±0.6 0.38 0.5±0.6 0.34 –1.7±0.9 0.04 –1.6±0.8 0.06 Insulin (μU/ml) 0.2±0.4 0.68 –0.1±0.4 0.77 0.0±0.4 0.91 –0.7±0.4 0.07 –0.2±0.7 0.74 0.8±0.6 0.19 HOMA 0.13±0.13 0.31 0.03±0.10 0.78 0.03±0.13 0.84 –0.16±0.10 0.12 –0.15±0.21 0.46 0.13±0.16 0.42 Nutrient intake per day Energy (kcal) 11.4±53.9 0.83 –75.6±70.9 0.29 –23.2±53.9 0.67 –35.5±71.0 0.62 11.1±71.8 0.88 118.1±96.6 0.23 Carbohydrate (%) –9.5±1.0 <0.001 –6.4±1.5 <0.001 –5.2±1.1 <0.001 –3.6±1.5 0.02 14.4±1.4 <0.001 10.2±2.1 <0.001 Protein (%) 0.9±0.5 0.06 0.2±0.7 0.77 4.2±0.4 <0.001 1.4±0.7 0.05 –5.0±0.6 <0.001 –1.6±1.0 0.10 Fat (%) 8.0±0.8 <0.001 6.7±1.2 <0.001 0.2±0.9 0.82 1.8±1.3 0.15 –8.1±1.2 <0.001 –8.6±1.6 <0.001 Saturated fat (%) 1.3±0.3 <0.001 1.7±0.5 <0.001 0.2±0.3 0.43 0.8±0.5 0.12 –1.5±0.4 0.001 –2.5±0.6 <0.001 Biomarkers of adherence Urinary nitrogen (g)‡ –0.11±0.39 0.77 0.08±0.42 0.84 1.64±0.38 <0.001 0.81±0.42 0.06 –1.50±0.55 0.006 –0.89±0.65 0.18 Respiratory quotient§ –0.01±0.00 0.005 –0.02±0.00 0.002 0.00±0.00 0.52 0.00±0.00 0.51 0.01±0.01 0.13 0.01±0.01 0.07 * Plus–minus values are means ±SE. Nutrient intake was determined by three 24-hour recalls. To convert the values for cholesterol to millimoles per liter, multiply by 0.02586. To convert the values for triglycerides to millimoles per liter, multiply by 0.01129. To convert the values for glucose to millimoles per liter, multiply by 0.05551. HDL denotes high-density lipopro -tein, HOMA homeostasis model assessment of insulin sensitivity, and LDL low-density lipoprotein. † Data were included for 201 participants per group; missing values were imputed. ‡ Data were included for 200 to 204 participants per group at baseline, 139 to 153 at 6 months, and 88 to 109 at 2 years. § Data were included for 201 to 204 participants per group at baseline, 157 to 164 at 6 months, and 113 to 132 at 2 years.
Weight Change According to Attendance at Group Sessions and Dietary Adherence
Attendance at group sessions strongly predicted weight loss at 2 years (0.2 kg for every session attended) and was similar among the diet groups (P = 0.22 for a test of difference in slopes) (Fig. 3). Adherence to the goal for protein intake was as-sociated with more weight loss only in the high-protein groups, and adherence to the goal for fat intake was associated with more weight loss only in the low-fat groups (P<0.001) (Fig. 4). The rang-es of protein and fat intakrang-es overlapped substan-tially in the diet groups. Thus, a low-fat intake of 25% was associated with increased weight loss in the low-fat groups but not in the high-fat groups, and a high-protein intake of 24 to 25% was associ-ated with increased weight loss in the high-pro-tein groups but not in the average-prohigh-pro-tein groups. Attendance at group sessions was associated with adherence to the fat and protein goals only in the high-protein and low-fat groups (Fig. 4).
Adverse Effects
Serious adverse events were reported by 57 par-ticipants (7%); there were no significant differences in the rates among diets. The ratio of urinary mi-croalbumin to creatinine was more than 30 in five participants in the average-protein group and in five participants in the high-protein group at 6 months and in seven participants, all in the av-erage-protein groups, at 2 years.
Discussion
In this population-based trial, participants were assigned to and taught about diets that emphasized different contents of carbohydrates, fat, and pro-tein and were given reinforcement for 2 years through group and individual sessions. The prin-cipal finding is that the diets were equally suc-cessful in promoting clinically meaningful weight loss and the maintenance of weight loss over the course of 2 years. Satiety, hunger, satisfaction with the diet, and attendance at group sessions were similar for all diets. The diets improved lipid risk factors and fasting insulin levels in the directions that would be expected on the basis of macronu-trient content. The study had a large sample, a high rate of retention, and the sensitivity to detect small changes in weight. The population was diverse with respect to age, income, and geography and includ-ed a large percentage of men. The participants were
eager to lose weight and to attempt whatever type of diet they were assigned, and they did well in screening interviews and questionnaires that eval-uated their motivation. Thus, the findings should be directly applicable to both clinicians’ recom-mendations for weight loss in individual patients and the development of population-wide recom-mendations by public health officials.
Despite the intensive behavioral counseling in our study, participants had difficulty achieving the goals for macronutrient intake of their assigned group. The mean differences among the groups in fat, carbohydrate, or protein intake at 6 months were nevertheless often greater than those in several previous trials comparing diets for weight loss.11,12,19,21,26 Substantially diminished
adher-ence after the first few months is typical in weight-loss trials5,6,8,10-12,19,21,24,26 and occurred between
6 months and 2 years in our trial. Only two trials have reported dietary intake beyond 1 year,12,26
and one of them provided foods to the partici-pants.12 In addition, trials of low-carbohydrate
di-ets have reported a very low incidence of urinary ketosis after 6 months,6,8,12 suggesting that in
most overweight people, it is futile to sustain a low intake of carbohydrates. Overall, these find-ings with respect to adherence to macronutrient goals suggest that participants in weight-loss pro-grams revert to their customary macronutrient in-takes over time but may nonetheless be able to maintain weight loss.
We explored the association of achieved nutri-ent intakes with weight loss. We caution that these post hoc analyses do not have the strong validity of the main analysis of this controlled trial, which compared randomized groups. Protein and fat in-takes overlapped among the groups. A high-pro-tein intake was associated with weight loss only in the high-protein groups, and a low-fat intake was associated with weight loss only in the low-fat groups. The protein and low-fat contents of the participants’ usual diet were closer to the goals for the average-protein and high-fat diets than to those for the high-protein and low-fat diets. Thus, the participants assigned to an average-protein or high-fat diet did not have to change their custom-ary level of dietcustom-ary protein and fat very much and could focus more on reducing dietary intake. In contrast, the participants in the high-protein or low-fat groups had more challenging dietary goals. It is therefore not surprising that attendance at group sessions was strongly related to adherence
to high-protein or low-fat goals but not to the goals in the average-protein or high-fat groups. However, attendance had a strong association with weight loss, and the association was similar across diet groups. We view attendance at counseling ses-sions as a proxy for commitment to achieving weight loss and for engagement in the program. Study participants who attended two thirds of the sessions over the course of 2 years lost about 9 kg
of weight. Regain after 6 to 12 months was about 20% of the regain reported in earlier trials.28
Sev-eral recent trials have also shown that continued contact with participants after weight loss is as-sociated with less regain.12,24,37,38 These findings
together point to behavioral factors rather than macronutrient metabolism as the main influences on weight loss.
Conformity to cultural norms, scientific nov-36p6
Change in Weight from Baseline to 2 Yr (kg) Change in Weight from Baseline to 2 Yr (kg)
Change in Weight from Baseline to 2 Yr (kg) Change in Weight from Baseline to 2 Yr (kg)
A Low-Fat, Average-Protein B Low-Fat, High-Protein
AUTHOR: FIGURE: JOB: 4-C H/T RETAKE SIZE ICM CASE EMail Line H/T Combo Revised
AUTHOR, PLEASE NOTE:
Figure has been redrawn and type has been reset. Please check carefully.
REG F Enon 1st 2nd 3rd Sacks 3 of 4 02-26-09 ARTIST: ts 36009 ISSUE:
C High-Fat, Average-Protein D High-Fat, High-Protein 20 10 −20 0 −40 −10 −30 20 10 −20 0 −40 −10 −30 20 10 −20 0 −40 −10 −30 20 10 −20 0 −40 −10 −30 0 10 20 30 40 50 60 0 10 20 30 40 50 60 0 10 20 30 40 50 60 0 10 20 30 40 50 60
No. of Sessions Attended No. of Sessions Attended
No. of Sessions Attended No. of Sessions Attended N=169 Slope=−0.179 N=151 Slope=−0.252 N=157 Slope=−0.191 N=168 Slope=−0.217
Figure 3. Change in Body Weight from Baseline to 2 Years According to Attendance at Counseling Sessions for Weight Loss, among the 645 Participants Who Completed the Study.
Panel A shows data for the low-fat, protein group; Panel B, for the low-fat, high-protein group; Panel C, for the high-fat, average-protein group; and Panel D, for the high-fat, high-average-protein group. There were no significant differences among the regression coefficients (P>0.2 for all comparisons; R2 = 0.2 for total cohort).
elty, and media attention are nonbiologic reasons for the success of specific diets. We used a generic approach to developing each diet and the instruc-tions for following it, in order to minimize such influences. No diet was considered to be a control diet, and the dietary counseling and the attention that we provided were the same for all diet groups throughout the study period. We did not confirm previous findings that low-carbohydrate or high-protein diets caused increased weight loss at 6 months3-12 and that the advantage of these diets
usually eroded by 12 months, with weight loss that was nearly or fully equivalent to that with low-fat diets6,11,18 or other diets.12 Other studies
showed increased weight loss at 1 to 2 years with diets that were high in unsaturated fat12,21,26 or
with low-fat, high-carbohydrate vegetarian di-ets.22,24 These divergent results suggest that any
type of diet, when taught for the purpose of weight loss with enthusiasm and persistence, can be ef-fective. When nonnutritional influences are min-imized, as they were in our study, the specific macronutrient content is of minor importance, as was suggested many years ago.39
In conclusion, diets that are successful in caus-ing weight loss can emphasize a range of fat, protein, and carbohydrate compositions that have beneficial effects on risk factors for cardiovascular disease and diabetes.29,40 Such diets can also be
tailored to individual patients on the basis of their personal and cultural preferences and may there-fore have the best chance for long-term success.
Supported by grants from the National Heart, Lung, and Blood Institute (HL073286) and the General Clinical Research Center, National Institutes of Health (RR-02635).
Dr. Greenway reports receiving consulting fees from or serv-ing on a paid advisory board for Anian, Bristol-Myers Squibb, Clarus Health, Encore Pharmaceutical, Leptos Biomedical, MDRNA, Novo Nordisk, General Nutrition Corporation, Cata-lyst, Jenny Craig, Orexigen, Lithera, and Basic Research, receiv-ing lecture fees from BAROnova, Lazard, and Biologene, and owning equity in Lithera. No other potential conflict of interest relevant to this article was reported. Dr. Ryan is chairperson of the Obesity Committee of the National Heart, Lung, and Blood Institute’s Clinical Guidelines for Cardiovascular Risk Reduc-tion Expert Panel; Dr. Loria is a member of that committee; and Dr. Sacks is a member of the Lifestyle Working Group of the Expert Panel that interacts with the Obesity Committee. Dr. Sacks is also vice-chair of the Nutrition Committee of the American Heart Association, which advises the Association on nu-trition topics, including those related to overweight and obesity.
We thank the participants in the trial for their dedication and contribution to the research; the following research staff
mem-36p6
Weight Loss (kg)
A High Fat B Low Fat
AUTHOR: FIGURE: JOB: 4-C H/T RETAKE SIZE ICM CASE EMail Line H/T Combo Revised
AUTHOR, PLEASE NOTE:
Figure has been redrawn and type has been reset. Please check carefully.
REG F Enon 1st 2nd 3rd Sacks 4 of 4 02-26-09 ARTIST: ts 36009 ISSUE:
C High Protein D Average Protein
0 −5 −10 Fat Intake (% kcal)
Sessions Attended (%) 24.354.5 31.253.1 35.254.9 39.647.3 45.548.7
Weight Loss (kg)
0 −5 −10 Fat Intake (% kcal)
Sessions Attended (%) 19.461.6 25.161.4 28.755.2 34.548.8 41.540.7
Weight Loss (kg)
0 −5 −10 Protein Intake (% kcal)
Sessions Attended (%) 15.341.6 18.248.5 20.355.0 22.058.4 25.659.3
Weight Loss (kg)
0 −5 −10 Protein Intake (% kcal)
Sessions Attended (%) 14.554.0 16.847.8 18.456.0 20.357.1 24.148.7 Figure 4. Weight Loss at 2 Years According to Adherence to Dietary Fat and Protein Goals.
Intake was determined from three 24-hour diet recalls. Quintiles of fat and protein intakes are shown for the combined high-fat groups (Panel A), low-fat groups (Panel B), high-protein groups (Panel C), and average-protein groups (Panel D); there were 45 to 51 partici-pants per quintile. Rates of attendance at group sessions (percent of total sessions attended over the 2-year period) are shown for the quintiles of fat and protein intake. I bars indicate 95% confidence intervals. P values for a trend in weight loss across quintiles are as fol-lows: P<0.001 for fat intake in low-fat groups, P<0.001 for protein intake in high-protein groups, P = 0.36 for fat intake in high-fat groups, and P = 0.83 for protein intake in average-protein groups. The results were similar when determined within each of the four diet groups (data not shown).
Clinical Directions: Vote and comment on this article at NEJM.org
bers for their assistance in conducting the trial: Jungnam Joo, Ph.D., and Charlotte A. Pratt, Ph.D., at the National Heart, Lung, and Blood Institute; Patricia Copeland, M.S., R.D., at Harvard School of Public Health; Cassandra Carrington, Jacqueline Gal-lagher, Clota Heazel, Megan Reddy, Alison Barr, M.S., R.D., Mary Dinehart, M.S., R.D., Marit Pywell, R.D., Dawn Quintino, M.S., R.D., Audrey Shweky, M.S., R.D., Benjamin Harshfield, and Melissa McEnery-Stonelake at Brigham and Women’s Hos-pital; and Julia St. Amant, Elizabeth Tucker, Heidi K. Millet, Marisa M. Smith, Sara J. Schoen, R.D., L.D.N., Betsy B. Bern-hard, Courtney Brock, R.D., Laura DeCuir Moran, R.D.,
Kather-ine Lastor, R.D., Erma Levy, M.P.H., R.D., Lisa Miller, R.D., Gina Pennington, R.D., Dana Vieselmeyer, M.P.H., R.D., Mar-lene Afton, Lindsay Coates, Dawn Turner, Richard Dale Achord, Bridget Conner, Margaret Graves, Doris Hoffpauir, Carla Kim-mel, Steve Lee, Kelli Melancon, Sandra Richard, Stacey Roussel, Elizabeth Soroe, Denise Stein, Jamie Tuminello, and Connie Murla at Pennington Biomedical Research Center; and the mem-bers of the data and safety monitoring board: Barbara V. How-ard, Ph.D. (chair), Phyllis E. Bowen, Ph.D., Daniel W. Jones, M.D., Michael G. Perri, Ph.D., David M. Reboussin, Ph.D., and Marcia L. Stefanick, Ph.D.
References
Jéquier E, Bray GA. Low-fat diets are
1.
preferred. Am J Med 2002;113:Suppl:41S-46S.
Willett WC, Leibel RL. Dietary fat is
2.
not a major determinant of body fat. Am J Med 2002;113:Suppl:47S-59S.
Freedman MR, King J, Kennedy E.
Pop-3.
ular diets: a scientific review. Obes Res 2001;9:Suppl:1S-40S.
Skov AR, Toubro S, Rønn B, Holm L,
4.
Astrup A. Randomized trial of protein vs carbohydrate in ad libitum fat reduced diet for the treatment of obesity. Int J Obes Relat Metab Disord 1999;23:528-36.
Brehm BJ, Seeley RJ, Daniels SR,
5.
D’Alessio DA. A randomized trial com-paring a very low carbohydrate diet and a calorie-restricted low fat diet on body weight and cardiovascular risk factors in healthy women. J Clin Endocrinol Metab 2003;88:1617-23.
Foster GD, Wyatt HR, Hill JO, et al.
6.
A randomized trial of a low-carbohydrate diet for obesity. N Engl J Med 2003;348: 2082-90.
Samaha FF, Iqbal N, Seshadri P, et al.
7.
A low-carbohydrate as compared with a low-fat diet in severe obesity. N Engl J Med 2003;348:2074-81.
Yancy WS Jr, Olsen MK, Guyton JR,
8.
Bakst RP, Westman EC. A low-carbohy-drate ketogenic diet versus a low-fat diet to treat obesity and hyperlipidemia: a ran-domized, controlled trial. Ann Intern Med 2004;140:769-77.
Volek J, Sharman M, Gómez A, et al.
9.
Comparison of energy-restricted very low-carbohydrate and low-fat diets on weight loss and body composition in overweight men and women. Nutr Metab (Lond) 2004;1:13.
Due A, Toubro S, Skov AR, Astrup A.
10.
Effect of normal-fat diets, either medium or high in protein, on body weight in over-weight subjects: a randomised 1-year trial. Int J Obes Relat Metab Disord 2004;28: 1283-90.
Gardner CD, Kiazand A, Alhassan S,
11.
et al. Comparison of the Atkins, Zone, Or-nish, and LEARN diets for change in weight and related risk factors among overweight premenopausal women: the A to Z Weight Loss Study: a randomized trial. JAMA 2007;297:969-77. [Erratum, JAMA 2007;298: 178.]
Shai I, Schwarzfuchs D, Henkin Y, et
12.
al. Weight loss with a low-carbohydrate, Mediterranean, or low-fat diet. N Engl J Med 2008;359:229-41.
Noakes M, Keough JB, Foster PR,
Clif-13.
ton PM. Effect of an energy-restricted, high-protein, low-fat diet relative to a con-ventional low-fat, high-carbohydrate diet on weight loss, body composition, nutri-tional status, and markers of cardiovascu-lar health in obese women. Am J Clin Nutr 2005;81:1298-306.
McLaughlin T, Carter S, Lamendola C,
14.
et al. Effects of moderate variations in macronutrient composition on weight loss and reduction in cardiovascular disease risk in obese, insulin-resistant adults. Am J Clin Nutr 2006;84:813-21.
McMillan-Price J, Petocz P, Atkinson
15.
F, et al. Comparison of 4 diets of varying glycemic load on weight loss and cardio-vascular risk reduction in overweight and obese young adults: a randomized con-trolled trial. Arch Intern Med 2006;166: 1466-75.
Das SK, Gilhooly CH, Golden JK, et al.
16.
Long-term effects of 2 energy-restricted diets differing in glycemic load on dietary adherence, body composition, and metab-olism in CALERIE: a 1-y randomized con-trolled trial. Am J Clin Nutr 2007;85:1023-30.
Lecheminant JD, Gibson CA, Sullivan
17.
DK, et al. Comparison of a low carbohy-drate and low fat diet for weight mainte-nance in overweight or obese adults en-rolled in a clinical weight management program. Nutr J 2007;6:36.
Stern L, Iqbal N, Seshadri P, et al. The
18.
effects of low-carbohydrate versus con-ventional weight loss diets in severely obese adults: one-year follow-up of a ran-domized trial. Ann Intern Med 2004;140: 778-85.
Dansinger ML, Gleason JA, Griffith
19.
JL, Selker JP, Schaefer EJ. Comparison of the Atkins, Ornish, Weight Watchers, and Zone diets for weight loss and heart dis-ease risk reduction: a randomized trial. JAMA 2005;293:43-53.
Luscombe-Marsh ND, Noakes M,
Wit-20.
tert GA, Keough JB, Foster P, Clifton PM. Carbohydrate restricted diets high in ei-ther monounsaturated fat or protein are equally effective in promoting fat loss and
improving blood lipids. Am J Clin Nutr 2005;81:762-72.
Keogh JB, Luscombe-Marsh ND,
21.
Noakes M, Wittert GA, Clifton PM. Long-term weight maintenance and cardiovas-cular risk factors are not different follow-ing weight loss on carbohydrate-restricted diets high in either monounsaturated fat or protein in obese hyperinsulinemic men and women. Br J Nutr 2007;97: 405-10.
Ornish D, Scherwitz LW, Billings JH,
22.
et al. Intensive lifestyle changes for rever-sal of coronary heart disease. JAMA 1998; 280:2001-7. [Erratum, JAMA 1999;281: 1380.]
Barnard ND, Cohen J, Jenkins DJ, et
23.
al. A low-fat vegan diet improves glycemic control and cardiovascular risk factors in a randomized clinical trial in individuals with type 2 diabetes. Diabetes Care 2006; 29:1777-83.
Turner-McGrievy GM, Barnard ND,
24.
Scialli AR. A two-year randomized weight loss trial comparing a vegan diet to a more moderate low-fat diet. Obesity (Silver Spring) 2007;15:2276-81.
Toubro S, Astrup A. Randomized
com-25.
parison of diets for maintaining obese subjects’ weight after major weight loss: ad lib, low fat, high carbohydrate diet v fixed energy intake. BMJ 1997;314:29-34.
McManus K, Antinoro L, Sacks F.
26.
A randomized controlled trial of a moder-ate-fat, low-energy diet compared with a low fat, low-energy diet for weight loss in overweight adults. Int J Obes Relat Metab Disord 2001;25:1503-11.
Simons-Morton DG, Obarzanek E,
27.
Cutler JA. Obesity research — limitations of methods, measurements, and medica-tions. JAMA 2006;295:826-8.
Dansinger ML, Tatsioni A, Wong JB,
28.
Chung M, Balk EM. Meta-analysis: the ef-fect of dietary counseling for weight loss. Ann Intern Med 2007;147:41-50.
Lichtenstein AH, Appel LJ, Brands M,
29.
et al. Diet and lifestyle recommendations revision 2006: a scientific statement from the American Heart Association Nutri-tion Committee. CirculaNutri-tion 2006;114: 82-96. [Errata, Circulation 2006;114(1): e27, 114(23):e629.]
Baecke JA, Burema J, Frijters JE. A short
30.
ha-bitual physical activity in epidemiological studies. Am J Clin Nutr 1982;36:936-42.
Champagne CM, Bogle ML, McGee
31.
BB, et al. Dietary intake in the lower Mis-sissippi delta region: results from the Foods of Our Delta Study. J Am Diet Assoc 2004;104:199-207.
Flint A, Raben A, Blundell JE, Astrup
32.
A. Reproducibility, power and validity of visual analogue scales in assessment of ap-petite sensations in single test meal stud-ies. Int J Obes Relat Metab Disord 2000; 24:38-48.
Urban N, White E, Anderson GL,
Cur-33.
ry S, Kristal AR. Correlates of mainte-nance of a low-fat diet among women in the Women’s Health Trial. Prev Med 1992; 21:279-91.
Wadden TA, Berkowitz RI, Sarwer DB,
34.
Prus-Wisniewski R, Steinberg C. Benefits
of lifestyle modification in the pharmaco-logic treatment of obesity: a randomized trial. Arch Intern Med 2001;161:218-27.
Third report of the National
Choles-35.
terol Education Program (NCEP) Expert Panel on Detection, Evaluation, and Treat-ment of High Blood Cholesterol in Adults (Adult Treatment Panel III). Bethesda, MD: National Cholesterol Education Pro-gram, National Heart, Lung, and Blood Institute, National Institutes of Health, 2002. (NIH publication no. 02-5215.)
Mensink RP, Zock PL, Kester AD,
Ka-36.
tan MB. Effect of dietary fatty acids and carbohydrates on the ratio of serum total to HDL cholesterol and on serum lipids and apolipoproteins: a meta-analysis of 60 controlled trials. Am J Clin Nutr 2003; 77:1146-55.
Wing RR, Tate DF, Gorin AA, Raynor
37.
HA, Fava JL. A self-regulation program for maintenance of weight loss. N Engl J Med 2006;355:1563-71.
Svetkey LP, Stevens VJ, Brantley PJ, et
38.
al. Comparison of strategies for sustain-ing weight loss: the Weight Loss Mainte-nance randomized controlled trial. JAMA 2008;299:1139-48.
Kinsell LW, Gunning B, Michaels GD,
39.
Richardson J, Cox SE, Lemon C. Calories do count. Metabolism 1964;13:195-204.
de Souza RJ, Swain JF, Appel LJ, Sacks
40.
FM. Alternatives for macronutrient intake and chronic disease: a comparison of the OmniHeart diets with popular diets and with dietary recommendations. Am J Clin Nutr 2008;88:1-11.
Copyright © 2009 Massachusetts Medical Society.
electronicaccesstothejournal’scumulativeindex At the Journal’s site on the World Wide Web (NEJM.org), you can search an index of all articles published since January 1975 (abstracts 1975–1992, full text 1993–present). You can search by author, key word, title, type of article, and date. The results will include the citations
for the articles plus links to the full text of articles published since 1993. For nonsubscribers, time-limited access to single articles and 24-hour site