[Washington University in St Louis] On: 12 July 2007
Access Details: [subscription number 768222507] Publisher: Psychology Press
Informa Ltd Registered in England and Wales Registered Number: 1072954 Registered office: Mortimer House, 37-41 Mortimer Street, London W1T 3JH, UK
The Clinical Neuropsychologist
Publication details, including instructions for authors and subscription information: http://www.informaworld.com/smpp/title~content=t713721659
The TCN/AACN 2005 "Salary Survey": Professional
Practices, Beliefs, and Incomes of U.S.
Neuropsychologists
Jerry J. Sweetab; Nathaniel W. Nelsonab; Paul J. Mobergc
aEvanston Northwestern Healthcare. Evanston, IL. USA
bNorthwestern University, Feinberg School of Medicine. Chicago, IL. USA cUniversity of Pennsylvania School of Medicine. Philadelphia, PA. USA
Online Publication Date: 01 September 2006
To cite this Article: Sweet, Jerry J., Nelson, Nathaniel W. and Moberg, Paul J. , (2006) 'The TCN/AACN 2005 "Salary Survey": Professional Practices, Beliefs, and Incomes of U.S. Neuropsychologists', The Clinical Neuropsychologist, 20:3, 325 -364
To link to this article: DOI: 10.1080/13854040600760488 URL:http://dx.doi.org/10.1080/13854040600760488
PLEASE SCROLL DOWN FOR ARTICLE
Full terms and conditions of use:http://www.informaworld.com/terms-and-conditions-of-access.pdf
This article maybe used for research, teaching and private study purposes. Any substantial or systematic reproduction, re-distribution, re-selling, loan or sub-licensing, systematic supply or distribution in any form to anyone is expressly forbidden.
The publisher does not give any warranty express or implied or make any representation that the contents will be complete or accurate or up to date. The accuracy of any instructions, formulae and drug doses should be independently verified with primary sources. The publisher shall not be liable for any loss, actions, claims, proceedings, demand or costs or damages whatsoever or howsoever caused arising directly or indirectly in connection with or arising out of the use of this material.
Downloaded By: [Washington University in St Louis] At: 00:47 12 July 2007
THE TCN/AACN 2005 ‘‘SALARY SURVEY’’:
PROFESSIONAL PRACTICES, BELIEFS, AND
INCOMES OF U.S. NEUROPSYCHOLOGISTS
Jerry J. Sweet
1, Nathaniel W. Nelson
1, and Paul J. Moberg
21
Evanston Northwestern Healthcare, Evanston, IL, USA, and Northwestern University, Feinberg School of Medicine, Chicago, IL, USA, and2University of Pennsylvania School of Medicine, Philadelphia, PA, USA
Doctoral-level members of Division 40 (Clinical Neuropsychology) of the American Psychological Association and other neuropsychologists were invited to participate in a web-based survey in early 2005. Response rate was estimated to be between 28.5 and 31.3%. The range of years postdoctorate was 1–51. Demonstrating the substantial proportional change in gender taking place in the field, 7 of 10 postdoctoral residents were women. Whereas the median age of APA members has been over 50 since the early 1990s, the current median age of clinical neuropsychologists is 47 and has essentially remained unchanged since 1994, indicating substantial entrance of young psychologists into the field. Use of testing assistants remains commonplace. The ‘‘flexible battery’’ approach has increased in popularity and predominates, whereas endorsement of the ‘‘standardized bat-tery’’ approach continues to decline. More than 90% of respondents are engaged in full-time or full-time plus part-time employment. Incomes from 2004 vary considerably by years of clinical practice, work setting, amount of forensic practice, and region of country. Job sat-isfaction has little relationship to income and is comparable across most variables (e.g., work setting, professional identity, amount of forensic activity), whereas income satisfaction has a stronger relationship to actual income, at least at the higher income levels. Job satisfaction of neuropsychologists in general is higher than reported for other U.S. jobs. Fewer than one in five respondents is considering changing job position and very few individuals are considering leaving neuropsychology or psychology for a different field. More than 8 of 10 respondents experienced an income increase in the last five years, whereas fewer than 1 in 10 experienced a decrease. While higher than reported by other types of psychologists, neuropsychology incomes have lagged behind inflation when compared to 1992 data. Numerous breakdowns related to income and professional activities are provided.
INTRODUCTION
Surveys of clinical neuropsychologists have provided interesting information regarding the characteristics of practice, teaching, research, and incomes within the field. The first and only true ‘‘salary surveys’’ were conducted in the 1980s and early 1990s (Putnam, 1989; Putnam & Anderson, 1994; Putnam & DeLuca,
Address correspondence to: Jerry J. Sweet, Ph.D., ENH Medical Group, Psychiatry & Behavioral Sciences, 909 Davis Street, Suite 160, Evanston, IL 60201. Tel.: 847-425-6407. Fax: 847-425-6408. E-mail: j-sweet@
northwestern.edu
Accepted for publication: April 11, 2006.
325
Copyright#Taylor and Francis Group, LLC ISSN: 1385-4046 print=1744-4144 online DOI: 10.1080/13854040600760488
Downloaded By: [Washington University in St Louis] At: 00:47 12 July 2007
1990a, 1990b; Putnam, DeLuca, & Anderson, 1994), with the most recent of these describing income data from 1992. Although income data were obtained in the 2000 professional practice survey co-sponsored by Division 40 (Clinical Neuropsychol-ogy) of the American Psychological Association (APA) and the National Academy of Neuropsychology (NAN), specific information pertaining to breakdowns of such parameters as academic rank, department affiliation, and type of institution, as well as whether in private practice one was an owner, employee, or contractor was not gathered (Sweet, Peck, Abramowitz, & Etzweiler, 2003). Therefore, as detailed breakdowns of incomes by very specific practice setting parameters had not been gathered since the last ‘‘TCN Salary Survey’’ performed in 1992, we sought to res-urrect this type of survey.
In keeping with the current status of TCN as the official journal of the American Academy of Clinical Neuropsychology (AACN), in 2004 we proposed a joint TCN=AACN income and professional practice survey to the AACN Board of Directors. The Board agreed to fund a primarily web-based survey that would include income and professional practice content and that would repeat the survey content used initially in 1989 (Sweet & Moberg, 1990) and repeated in 1994 (Sweet, Moberg, & Westergaard, 1996) and 1999 (Sweet, Moberg, & Suchy, 2000a, 2000b).
METHOD
Various electronic and web-based approaches were considered. Ultimately, the commercial web-based survey company PsychData (http:==psychdata.com=) was selected. This company allows survey researchers to use their site to construct and completely control item content and structure. Data entered online at the PsychData website is downloaded directly to SPSS files, thus precluding any data entry errors.
Prior survey experience had demonstrated a very large overlap between neu-ropsychology membership organizations, with the largest number of U.S. clinical neuropsychologists belonging to Division 40 of APA, and thus this organization was selected. Initially, the desire to calculate an exact rate of return led to using a postcard invitation to alert individuals to the survey. Inasmuch as there was no desire to exclude non-Division 40 members, and in fact we desired to include as many U.S. clinical neuropsychologists as possible, we invited interested individuals who were not members of Division 40 to contact the third author to receive instruc-tions on how to complete the survey. This method was chosen to allow the survey team to keep track of the number of individuals completing the survey who were in addition to those originally contacted by postcard.
Initial postcards to all 3471 Division 40 doctoral-level members were mailed in February 2005. Reminder postcards were mailed approximately four weeks later. The postcard instructions included information relevant to completion of the survey on the website or, if preferred, how to obtain a paper-and-pencil version. Due to postcard delivery problems apparently associated with non-profit bulk mail rates, which caused long delays and non-delivery in many cases, numerous e-mail listserv announcements were made beginning on May 1. All completed surveys received by the evening of May 31 were examined for usability.
Downloaded By: [Washington University in St Louis] At: 00:47 12 July 2007
RESULTS
Response Rates
From the initial mailing, 37 postcards were undeliverable, 3 members were determined to be deceased, and 3 were returned with notations that the individuals were retired from the field and not interested. There were also 15 individuals who were not Division 40 members who completed the survey. On May 1, considering the preceding information, the response rate was 731=3444, or 21.2%. Because of the problem of many potential respondents not receiving the postcards, e-mail list-serv announcements were distributed broadly on May 1. At the May 31 cutoff for completion of the survey, 1081 individuals had completed the survey. Of these, two were determined to be master’s-level practitioners and one survey contained no responses. Thus, the actual return rate at that time was 1078=3444, or 31.3%. Inasmuch as we had broadened the invitations to include more than Division 40 members, the final tally of respondents surely included an unknown number of indi-viduals being added to the denominator used to compute the return rate. Estimating that perhaps 10%of the 347 individuals who completed the survey between May 1 and May 31 were not Division 40 members, the overall return rate for the survey would be 31%.
General Sample Demographics and Characteristics
For 1068 respondents who provided their age, mean age was 45.8 (SD¼10.2), with a range of 26–82. Table 1 shows that the current sample primarily holds a Ph.D, with the largest number having clinical psychology as their doctoral field of study.
Table 1 Characteristics of general sample of respondentsa
Demographics Frequency Precent
Degree
Ph.D. 944 88.6
Psy.D. 107 10.0
Ed.D. 9 .8
More than one 2 .2
Other 6 .6
Gender
Male 463 49.7
Female 469 50.3
Ethnicity
African American=Black 15 1.4
American Indian=Alaskan Native 3 .3
Asian or Pacific Islander 17 1.6
Hispanic=Latino 30 2.8
Caucasian=White 974 92.3
Chose not to disclose 16 1.5
Field of doctoral study
Clinical psychology 746 70.0
Neuropsychology 108 10.1
Downloaded By: [Washington University in St Louis] At: 00:47 12 July 2007
Table 1 Continued
Demographics Frequency Precent
Counseling psychology 80 7.5
School psychology 32 3.0
General=experimental psychology 22 2.1
Educational psychology 18 1.7
Neurosciences 12 1.1
Physiological psychology 9 .8
Clinical=health psychology 7 .7
Rehabilitation 4 .4
Other 27 2.5
Work status
Full time 899 85.3
Part time 70 6.6
Combined (full timeþpart time) 73 6.9
Retired 9 .9
Unemployed 3 .3
Employment setting
Institution only 402 41.5
Private practice only 225 23.2
Institutionandprivate practice 246 25.4
Postdoctoral residency 96 9.9
‘‘Do you use a technician=psychometrician to collect test data from patients?’’bc
Yes 497 53.4
Paid paraprofessionals 387 21.3
Paid doctoral level staff 68 13.7
Paid postdoctoral residents or fellows 167 33.9
Paid predoctoral trainees 207 41.7
Unpaid postdoctoral residents or fellows 18 3.7
Unpaid trainees 143 29.0
No 434 46.6
Professional identityc
Adult neuropsychologist only 458 51.0
Pediatric neuropsychologist only 121 13.5
Both adult=pediatric neuropsychologist 253 28.2
Not a clinical neuropsychologist 66 7.3
Board certification of any kindc 301 30.7 (of 981)
ABPP (of any kind) 273 90.7 (of 301)
ABPP-CN 243 80.7 (of 301)
ABPP-CN only (without other ABPP or ABPN) 208 69.1 (of 301)
ABPP-CN (without other ABPP) plus ABPN 15 5.0 (of 301)
ABPP-CN (plus other ABPP without ABPN) 12 3.9 (of 301)
ABPP-CN (plus other ABPP) plus ABPN 3 .9 (of 301)
ABPP (not CN) without ABPN 24 8.0 (of 301)
ABPN 51 16.7 (of 301)
ABPN only (without any ABPP) 28 9.2 (of 301)
Note. UseableN¼1078. a
Includes all licensed and non-licensed respondents. b
As respondents were allowed to check multiple types of technicians, sums of technicians will not be equal to the total number who use technicians (497).
c
Postdoctoral residents were excluded from analyses pertaining to testing assistants, board certification, and professional identity. See Tables 5 and 6 for more information pertaining to residents.
Downloaded By: [Washington University in St Louis] At: 00:47 12 July 2007
The sample is evenly divided into half men and half women. The vast majority are Caucasian, with the next largest subset being Hispanic=Latino at only 2.8%. The majority (85.3%) of the sample works full time, whereas 6.6% work part time, and 6.9% have both full-time and part-time positions. Employment settings were 41.5% in institutions, 23.2% in private practice, and 25.4% in both settings. Approximately 10%of respondents were postdoctoral residents.
A few general questions were asked of the entire sample. As shown in Table 1, excluding postdoctoral residents from consideration, when self-identifying pro-fessional identity, 51% viewed themselves as adult neuropsychologists, 13.5% as pediatric neuropsychologists, and 28.2%as having a combined adult and pediatric identity. Interestingly, 7.3%of the sample did not view themselves as clinical neu-ropsychologists. A greater number of respondents reported using testing assistants, with 53.4%indicating such usage when conducting evaluations. Board certification was well represented in the sample, with 30.7%holding some form of board certifi-cation, the largest proportion of which was the ABCN diplomate, at 80.7%.
Table 2 lists the state of licensure and primary employment of the respondents. The top ten states on the list account for 55.7%of the sample, whereas the bottom 20 account for less than 10%of the sample.
Table 2 Respondent state of licensure and primary employment
State n % Cum.% California 88 9.5 9.5 New York 70 7.5 17.0 Florida 60 6.5 23.4 Texas 60 6.5 29.9 Illinois 47 5.1 34.9 Pennsylvania 44 4.7 39.7 Massachusetts 40 4.3 44.0 Michigan 40 4.3 48.3 Wisconsin 39 4.2 52.5 Ohio 30 3.2 55.7 Minnesota 27 2.9 58.6 Virginia 27 2.9 61.5 Washington 27 2.9 64.4 Maryland 24 2.6 67.0 North Carolina 22 2.4 69.4 Missouri 19 2.0 71.4 Arizona 17 1.8 73.2 Colorado 17 1.8 75.1 Connecticut 17 1.8 76.9 New Jersey 17 1.8 78.7 Georgia 16 1.7 80.4 Tennessee 13 1.4 81.8 Utah 13 1.4 83.2 Alabama 12 1.3 84.5 Indiana 12 1.3 85.8 Louisiana 10 1.1 86.9 New Hampshire 10 1.1 88.0 (Continued)
Downloaded By: [Washington University in St Louis] At: 00:47 12 July 2007
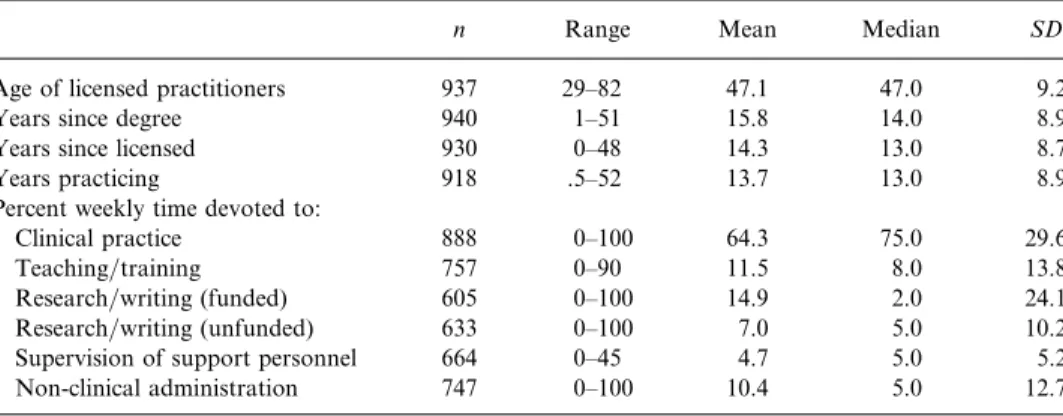
As shown in Table 3, the present sample, on average, completed their doctoral degree approximately 16 years ago and been practicing approximately 14 years. The most common weekly professional activities, in descending order, are clinical prac-tice, research=writing (funded), teaching=training, and non-clinical administration. Clinical practice is by far the most frequent weekly activity, comprising an average
Table 2 Continued State n % Cum.% New Mexico 9 1.0 88.9 Rhode Island 9 1.0 89.9 Iowa 8 .9 90.8 West Virginia 8 .9 91.6 Arkansas 7 .8 92.4 Maine 7 .8 93.1 Oregon 7 .8 93.9 District of Columbia 6 .6 94.5 Nebraska 6 .6 95.2 South Carolina 6 .6 95.8 Kansas 5 .5 96.3 Hawaii 4 .4 97.3 Montana 4 .4 97.7 North Dakota 4 .4 98.2 Oklahoma 4 .4 98.6 Mississippi 3 .3 98.9 Vermont 3 .3 99.2 Alaska 2 .2 99.5 Nevada 2 .2 99.7 Delaware 1 .1 99.8 Puerto Rico 1 .1 99.9 Wyoming 1 .1 100.0
Note. If licensed in more than one state, respondents were asked to provide state of primary employment. Of 1078 respondents, 930 provided this information.
Table 3 Age of licensed practitioners, years since doctoral degree obtained, and years since licenseda
n Range Mean Median SD
Age of licensed practitioners 937 29–82 47.1 47.0 9.2
Years since degree 940 1–51 15.8 14.0 8.9
Years since licensed 930 0–48 14.3 13.0 8.7
Years practicing 918 .5–52 13.7 13.0 8.9
Percent weekly time devoted to:
Clinical practice 888 0–100 64.3 75.0 29.6
Teaching=training 757 0–90 11.5 8.0 13.8
Research=writing (funded) 605 0–100 14.9 2.0 24.1
Research=writing (unfunded) 633 0–100 7.0 5.0 10.2
Supervision of support personnel 664 0–45 4.7 5.0 5.2
Non-clinical administration 747 0–100 10.4 5.0 12.7
Downloaded By: [Washington University in St Louis] At: 00:47 12 July 2007
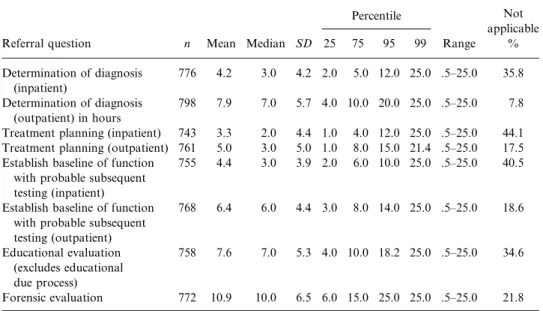
of 64.3%and median of 75%of weekly activities. Table 4 depicts hours required to complete evaluations that differ by referral question or context. As is evident, the specific referral question and referral context greatly impact the number of hours needed to complete an evaluation. Subsequent analyses of time required for evalua-tions will appear in additional tables to follow. The results of these time-based analy-ses vary depending upon the variable of interest, such as the relationship to use of testing assistants and the particular sample responding to given survey items. In gen-eral, present results are consistent with past surveys in showing a very wide range of times per evaluation. These broad ranges can in some instances be due to the influence of an individual patient’s clinical condition, fatigue, cooperation, etc.—variables that are not under the control of the examiner.
Postdoctoral Residents
Comparison of clinical neuropsychologists in the field with current postdoctoral residents allows a view of possible changes within the profession. In Table 5 it seems that a slightly higher percentage of residents have a Psy.D., though still a minority. More substantial is the very high proportion of women, at 70.7%. Even though 45.8% were beyond their first year of residency, only 29.2% of residents were licensed. As might be expected, the vast majority of residencies are found within institutions. Professional identity as a pediatric neuropsychologist is much higher among residents compared to neuropsychologists in the field, and not surprisingly the percent of residents self-identifying as an adult and pediatric
Table 4 Hours needed to complete evaluations related to referral questions and referral context
Percentile Not
applicable
Referral question n Mean Median SD 25 75 95 99 Range %
Determination of diagnosis (inpatient) 776 4.2 3.0 4.2 2.0 5.0 12.0 25.0 .5–25.0 35.8 Determination of diagnosis (outpatient) in hours 798 7.9 7.0 5.7 4.0 10.0 20.0 25.0 .5–25.0 7.8
Treatment planning (inpatient) 743 3.3 2.0 4.4 1.0 4.0 12.0 25.0 .5–25.0 44.1
Treatment planning (outpatient) 761 5.0 3.0 5.0 1.0 8.0 15.0 21.4 .5–25.0 17.5
Establish baseline of function with probable subsequent testing (inpatient)
755 4.4 3.0 3.9 2.0 6.0 10.0 25.0 .5–25.0 40.5
Establish baseline of function with probable subsequent testing (outpatient) 768 6.4 6.0 4.4 3.0 8.0 14.0 25.0 .5–25.0 18.6 Educational evaluation (excludes educational due process) 758 7.6 7.0 5.3 4.0 10.0 18.2 25.0 .5–25.0 34.6 Forensic evaluation 772 10.9 10.0 6.5 6.0 15.0 25.0 25.0 .5–25.0 21.8
Note. Excludes postdoctoral residents. The maximum allowable number of hours for any referral question was 25 hours.
Downloaded By: [Washington University in St Louis] At: 00:47 12 July 2007
neuropsychologist is lower. Very few residents had not yet developed this type of professional identity. Resident salaries, shown in Table 6, are wide ranging, especially in the second year, but with means and medians within the low $30,000 range for years one and two.
Table 5 Demographics of postdoctoral residentsa Demographics Age Mean 31.3 SD 3.4 Range 26–48 Frequency Percent Degree Ph.D 81 84.4 Psy.D 14 14.6 Other 1 1.0 Gender Male 27 29.3 Female 65 70.7
Year of postdoctoral residency
1 52 54.2 2 41 42.7 >2 3 3.1 Licensure status Licensed 28 29.2 Non-licensed 68 70.8 Work status Full time 90 95.7 Part time 2 2.1
Combined (full-time=part-time) 2 2.1
Setting
Institutional only 85 93.4
Private practice only 2 2.2
Combined (institutional=private practice) 4 4.4
Professional identity
Adult neuropsychology only 50 54.9
Pediatric neuropsychology only 21 23.1
Adult and pediatric neuropsychology 17 18.7
None 3 3.3
an ¼96.
Table 6 Salaries of postdoctoral residents by year of residencya Percentile
n Mean Median SD 25 75 95 99 Range
Year of residency
1 38 30.5 31.5 8.6 25.6 35.6 44.0 44.4 0–44.4
2 35 33.3 32.0 10.7 29.0 37.5 50.8 74.0 0–74.0
Combined 73 31.8 32.0 9.7 28.0 36.5 44.1 74.0 0–74.0
aIncludes postdoctoral residents working full time or more within institutional settings only. Salaries are in thousands of dollars.
Downloaded By: [Washington University in St Louis] At: 00:47 12 July 2007
Philosophical Approach toward Test Selection
Figure 1 demonstrates the historical and current viewpoint of clinical neuro-psychologists regarding their approach toward test selection. Quite apparent in the chronological survey data is the trend from 1989 to 2005 for more individuals to align with the flexible battery approach, to the point that 3 of 4 currently identify with this philosophical position. In contrast, proponents of the standardized battery approach have continued to decrease proportionally, currently accounting for only 7%of clinical neuropsychologists.
Income from Neuropsychological Activities
Correlates of income. Some significant correlates of income are presented in Table 7. Involvement in forensic work, years in clinical practice, and board certifi-cation have moderate relationships to income. Note that job satisfaction has a statistically significant, but weak, relationship to income. Throughout the remainder of the article we will continue to present variables in a way that elucidates whether they appear to be related to income.
Testing assistants. The broad impact of using testing assistants is shown in Table 8. Clinical neuropsychologists who use testing assistants invest significantly briefer evaluations, have greater incomes, charge higher hourly fees, have greater
Figure 1 Primary philosophical approach toward test selection.Note. ‘‘Flexible Battery’’¼variable but routine groups of tests for different types of patients, such as head injury, alcoholism, elderly, etc.; ‘‘Flexible’’¼based upon the needs of an individual case, not uniform across patients; ‘‘Standardized Battery’’¼routine group of tests uniform across patients such as the Halstead-Reitan, Luria-Nebraska, Benton, or other standard battery.
Downloaded By: [Washington University in St Louis] At: 00:47 12 July 2007
income satisfaction and greater job satisfaction, and spend fewer hours in clinical activities per week. As with other estimates of time needed to complete evaluations, estimates related to use of testing assistants are wide ranging. Again, such estimates are undoubtedly influenced by numerous patient variables and also the purpose of the evaluation (the effects of which are shown in Table 4).
Starting salaries. Table 9 shows the mean annual incomes in the first few years of practice. While the means and medians provide reasonable guidance in terms of offering salaries to recent graduates, there is considerable variability, even with outliers removed.
Table 8 Effects of utilizing a testing assistant
‘‘Do you use a technician=psychometrist or other assistant to collect test data from your patients?’’
Yes No
n Mean SD Range n Mean SD Range t
Number of hours for a single evaluationb
482 8.7 4.6 0–25 421 10.3 5.7 0–25 4.9
Estimated gross psychology incomea
328 118.5 70.7 30–500 264 98.9 54.2 32–465 3.7
Hourly clinical feea 280 191.9 60.1 31–500 216 172.1 69.5 50–600 3.4
Income satisfactionb 455 70.4 23.8 0–100 397 65.8 26.6 0–100 2.7
Job satisfactionb 454 78.7 19.6 0–100 395 74.7 23.7 0–100 2.7
Number of weekly clinical hours
326 30.3 14.6 0–60 262 33.4 14.0 0–60 2.6
Note. Comparison with Table 4 shows different estimates of required evaluation time, likely related to varying purposes of evaluations.
aIncludes all licensed clinicians who work full time or more in either institutional, private practice, or combined institutional=private practices. Excludes postdoctoral residents and income outliers (<$30,000). Incomes are in thousands of dollars.
bExcludes postdoctoral residents only.
p<.01,p<.001.
Table 7 Significant correlates of income
Variable n r
Hours of forensic practice each week 589 .43
Years in clinical practice 582 .40
Percentage of forensic practice 590 .37
Any form of board certification 588 .30
Note. Includes licensed clinicians who work full-time or more; excludes postdoctoral residents and income outliers (<$30,000). Non-significant income correlates were observed for percentage of time in clinical practice, percentage of professional time devoted to research=writing, percentage of supervision of clinical=support personnel, percentage of non-clinical adminis-tration, and type of doctoral degree.
Downloaded By: [Washington University in St Louis] At: 00:47 12 July 2007
Years in clinical practice. Table 10 shows years of clinical practice and incomes. The data suggest a large increase between the averages for the first 5 years and second 5 years of practice, and again after 15 years of practice. Across all years of practice, the average income of clinical neuropsychologists is $109,800 (SD¼64,700). It appears that after 15 years in practice, the majority of clinical neu-ropsychologists earned between $100,000 and $200,000 in 2004.
Income satisfaction. Respondents were asked to identify satisfaction with their incomes on a 0 to 100 scale (with 0 being completely dissatisfied and 100 being completely satisfied), as well as on a six-point categorical scale that ranged from being completely satisfied to being completely dissatisfied. Table 11 shows a mean income satisfaction of 67.6 (SD¼25.2) and a median income satisfaction of 75. Categorically, 39.2% were ‘‘mostly satisfied’’ and 9.3% were ‘‘completely satisfied.’’ Combining all relevant categories, a total of 67.4% endorsed some degree of satisfaction with their incomes. Table 12 shows that the correlation
Table 9 Mean annual Incomes in initial years of clinical practicea Percentile
Years in practice n Mean Median SD 25 75 95 99 Range
<1 13 64.5 67.0 18.6 47.5 73.0 105.0 105.0 37.0–105.0
1 15 64.3 65.5 14.5 55.0 68.0 94.0 94.0 36.0–94.0
2 20 74.7 69.3 20.6 60.5 80.0 129.5 130.0 54.0–130.0
3 39 73.5 71.0 20.2 58.0 87.5 115.0 115.0 31.5–115.0
<1–3 87 70.8 68.0 19.4 58.0 80.0 111.0 130.0 31.5–130.0
aIncludes licensed clinicians who work full-time or more, excluding post-doctoral residents and those earning <$30,000 annually. Included 56 institutional, 14 private practice, and 17 combined institution=
private practice respondents. Amounts are in thousands of dollars. Two outliers, one reporting an income of $150,000 in the<1 year of clinical practice category and another reporting $180,000 from the 2 years of clinical practice category, were excluded.
Table 10 Income at varying intervals of years in clinical practicea Percentile
Years in practice n Mean Median SD 25 75 95 99 Range
<1–5 143 76.2 70.0 25.4 62.0 87.0 124.0 182.8 31.5–185.0 6–10 115 103.4 90.0 42.7 76.0 120.0 200.0 271.0 45.0–275.0 11–15 125 104.5 90.0 50.2 76.0 122.5 200.0 317.7 35.0–320.0 16–20 82 130.5 101.5 73.2 85.0 142.0 308.3 465.0 30.0–465.0 21–25 69 143.6 110.0 98.6 85.0 150.0 430.0 500.0 40.0–500.0 >25 48 155.0 126.5 85.7 100.8 196.3 355.5 450.0 40.0–450.0 All years 582 109.8 90.0 64.7 72.0 125.0 246.8 408.5 30.0–500.0
aIncludes licensed clinicians who work full time or more, excluding postdoctoral residents and those earning<$30,000 annually. Included 272 institutional, 147 private practice, and 163 institutional=private practice respondents.
Downloaded By: [Washington University in St Louis] At: 00:47 12 July 2007 between income satisfaction and actual income is modest. Table 13 shows a
higher correspondence between highest mean incomes and categorical income satisfaction and a more linear relationship between median income and income satisfaction.
Table 14 shows categorical income satisfaction broken down by gender, work status, and specific work setting. The percentages of men and women who are to some degree dissatisfied with income are comparable, whereas it appears that men are more highly represented in the highest categories of income satisfaction. There do not appear to be any trends regarding work status and income satisfaction. Given the widely varying percentages of individuals employed in specific work settings, no differences in income satisfaction appear related to this variable.
Table 11 Overall job and income satisfaction
Continuous satisfaction variable n Mean Median SD
Income satisfaction (0–100)a 585 67.6 75.0 25.2
Job satisfaction (0–100) 938 76.7 85.0 21.6
Categorical satisfaction variable n Percent
Income satisfactiona Completely dissatisfied 22 3.8 Mostly dissatisfied 59 10.0 Somewhat dissatisfied 109 18.7 Somewhat satisfied 110 18.9 Mostly satisfied 228 39.2 Completely satisfied 54 9.3
Interest in leaving current position
Not interested; will stay in present position 455 55.2
Ambivalent; unclear given both positive and negative feeling 174 21.1
Somewhat interested; will at least seek information from other position
139 16.9
Very interested; will actively seek a new position 56 6.8
aIncludes licensed clinicians who work full time or more; excludes postdoctoral residents and income outliers (<$30,000).
Table 12 Correlations of years licensed, psychology income, income satisfaction, and job satisfaction
Variable Years licensed Income satisfaction Job satisfaction
Income satisfaction .09 (n) (584) Job satisfaction .05 .60 (n) (581) (582) Psychology income .39 .37 .19 (n) (591) (585) (582)
Note. Includes licensed clinicians who work full time or more; excludes postdoc-toral residents and income outliers (<$30,000).
Downloaded By: [Washington University in St Louis] At: 00:47 12 July 2007
The amount of money needed to create complete income satisfaction is shown in Table 15. Across all general work settings, nearly $40,000 is reported as the amount of income increase that would result in complete income satisfaction. There are significant differences by general work setting, with those working in institutions needing much less than those in private practice, and those in combined institution= private practice positions in between.
Table 13 Gross psychology incomes and income satisfaction
Estimated gross psychology income in dollars
n Mean Median SD Completely dissatisfied 22 96,205 65,250 81,292 Mostly dissatisfied 59 79,824 76,752 28,800 Somewhat dissatisfied 109 92,299 78,000 53,941 Somewhat satisfied 110 98,358 86,000 47,504 Mostly satisfied 228 115,798 100,000 52,878 Completely satisfied 54 184,204 162,500 111,006
Note. Excludes postdoctoral residents. Includes licensed clinicians that work full time or more and earn more than $30,000.
Table 14 Categorical income satisfaction by gender, work status, and specific work setting Income satisfaction Completely dissatisfied Mostly dissatisfied Somewhat dissatisfied Somewhat satisfied Mostly satisfied Completely satisfied Variable n % n % n % n % n % n % n % Gender Male 390 53.1 12 3.1 40 10.3 64 16.4 59 15.1 175 44.9 40 10.3 Female 345 46.9 14 4.1 40 11.6 70 20.3 78 22.6 117 33.9 26 7.5 Work status Full time 713 84.7 26 3.6 71 10.0 132 18.5 135 18.9 275 38.6 74 10.4 Part time 59 7.0 1 1.7 7 11.9 10 16.9 12 20.3 24 40.7 5 8.5
Fullþpart time 64 7.6 1 1.6 12 18.8 6 9.4 12 18.8 30 46.9 3 4.7
Retired 4 .5 0 0.0 0 0.0 0 0.0 0 0.0 2 50.0 2 50.0 Unemployed 2 .2 1 50.0 1 50.0 0 0.0 0 0.0 0 0.0 0 0.0 Specific work settinga Medical 310 37.2 8 2.6 34 11.0 60 19.4 57 18.4 118 38.1 33 10.6 Private=group practice 269 32.3 10 3.7 32 11.9 35 13.0 45 16.7 113 42.0 34 12.6 Psychiatric 36 4.3 2 5.6 3 8.3 11 30.6 3 8.3 16 44.4 1 2.8 Rehabilitation 110 13.2 5 4.5 11 10.0 19 17.3 26 23.6 43 39.1 6 5.5 College=university 57 6.8 3 5.3 4 7.0 12 21.1 12 21.1 21 36.8 5 8.8 Other 52 6.2 1 1.9 6 11.5 11 21.2 12 23.1 16 30.8 6 11.5
Note.Excludes post doctoral residents.
Downloaded By: [Washington University in St Louis] At: 00:47 12 July 2007
Job satisfaction. Respondents were asked to identify their satisfactions with their present employment positions on a 0 to 100 scale (with 0 being completely dis-satisfied and 100 being completely dis-satisfied), and also by expressing degree of interest in leaving their present positions. Table 11 shows a mean job satisfaction of 76.7 (SD¼21.6) and only 6.8% very interested in leaving their present position and actively seeking a new position. An additional 16.9%expressed some interest in leav-ing their position and were open to examinleav-ing information on a new position. More than half were not at all interested in leaving their current positions. Table 12 shows that the correlation between job satisfaction and income satisfaction is high (r¼.60), whereas job satisfaction is not correlated with years in practice.
Board certification. Respondents board certified by the American Board of Clinical Neuropsychology (ABCN) are compared to those not board certified by ABCN in Table 16. Psychology income, job satisfaction, and income satisfaction are all significantly greater in those board certified by ABCN. Though a variety of variables affect income, board certification appears to be one of the few variables associated with a meaningful difference in both job and income satisfaction.
At the time of the present survey, there were 515 AACN members, with 243, or 47%, of the total group completing the present survey. In addition to the infor-mation in Table 16, athumbnail sketchof clinical neuropsychologists board certified
Table 15 Amount of added income that would result in complete income satisfactiona
n Mean Median SD F
Work setting 7.0
Institution only 255 33.1 20.0 49.5
Private practice only 127 51.5 40.0 50.0
Institutionþprivate practice 150 41.3 35.0 33.4
Total 532 39.8 25.0 46.1
a
Includes licensed clinicians who work full time or more; excludes post doctoral residents and income outliers (<$30,000).
Table 16 Mean differences of income, income satisfaction, and job satisfaction for ABCN and non-ABCN respondents
ABCN status
ABCN certified Not ABCN certified
Variable n Mean SD n Mean SD t
Gross psychology incomea 155 134.7 78.3 437 100.9 56.4 16.0
Income satisfaction (0–100)b 225 74.7 22.5 627 65.9 25.8 4.5
Job satisfaction (0–100)b 224 80.9 19.3 625 75.4 22.3 3.3
aIncludes licensed clinicians who work full time or more; excludes post doctoral residents and income outliers (<$30,000).
bExcludes post-doctoral residents only.
Downloaded By: [Washington University in St Louis] At: 00:47 12 July 2007
as of 2005 by ABCN would include the following: mean age¼48.7; gender¼35%
women; doctoral degree of Ph.D. held by 93%; mean years in clinical practice¼17.3; working either full time or full time plus part time¼95%; working in institutions¼
44%, in private practice¼21%, and in both settings simultaneously¼34%; professional identity of adult neuropsychologist ¼56%, pediatric neuro-psychologist¼13%, and both adult and pediatric¼ 31%; and, finally, related to incomes and not shown in Table 18, range of income¼$40,000–$500,000 with median income¼$110,000. Interestingly, of 243 individuals with ABCN board certification, 6.2%are also board certified by ABPP in one or more additional specialties. Because the proportion of board-certified neuropsychologists in the present sample is slightly higher than in the population, readers should be mindful of the related slightly heavier weighting of certain characteristics described above that are associated with board certification.
Region of United States. Using the official composition of states into regions as judged by the federal government for census purposes, Table 17 shows psychology income by region in which respondents were licensed and practicing. Additionally, seeking to correct for known differences in cost of living, Table 17 also includes cost of living adjustment figures, as derived by Friar and Leonard (1997). With and without adjusting for cost of living, the Pacific region has the highest reported psychology incomes.
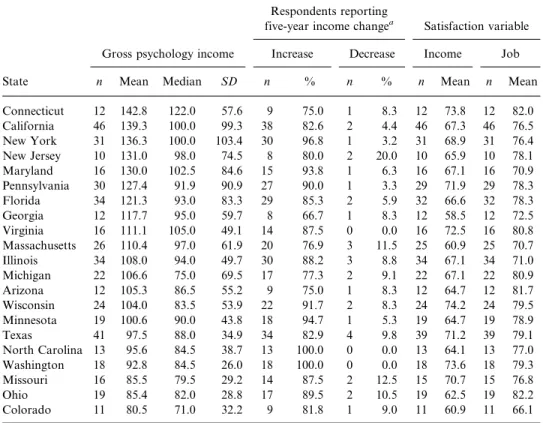
State of licensure and practice. Because regions can have very different incomes in neighboring states, individual states and associated incomes are reported in Table 18. This table also shows income and job satisfaction by state, as well as increases and decreases in income compared to five years earlier. Note that Connecticut and Ohio are far apart in reported incomes and though differing in reported income satisfaction, report nearly identical levels of job satisfaction. Also, all states reported a much greater percentage of five-year income increase compared to those who experienced a decrease.
Professional identity. Respondents were asked to self-identify as adult neu-ropsychologist, pediatric neuneu-ropsychologist, adultand pediatric neuropsychologist,
Table 17 Income by region of United Statesa
Region n Mean Median SD Adjusted incomeb
Pacific 71 $127,652 97,000 85,101 125,409 Mountain 38 90,453 76,500 45,763 91,372 West N Cent 55 98,227 87,000 48,266 104,467 East N Cent 105 101,662 85,000 51,648 104,652 Mid Atlantic 71 131,771 98,000 93,444 119,910 New England 62 108,260 91,000 55,189 97,197 West S Cent 56 101,200 89,500 36,899 110,531 East S Cent 21 100,059 80,000 42,278 108,261 S Atlantic 102 113,593 90,500 67,762 121,196 a
Includes licensed clinicians working full time or more; excludes post doctoral residents and income outliers (individuals earning<$30,000).
Downloaded By: [Washington University in St Louis] At: 00:47 12 July 2007
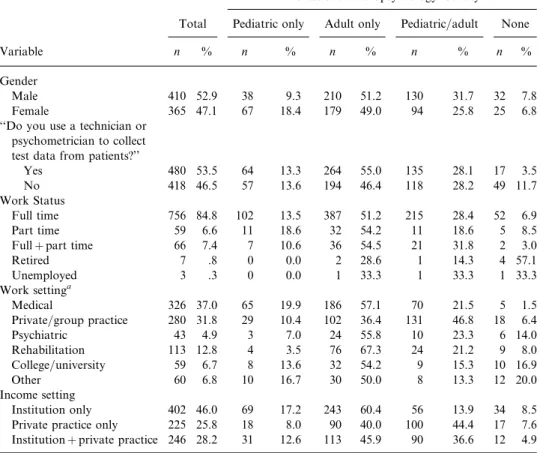
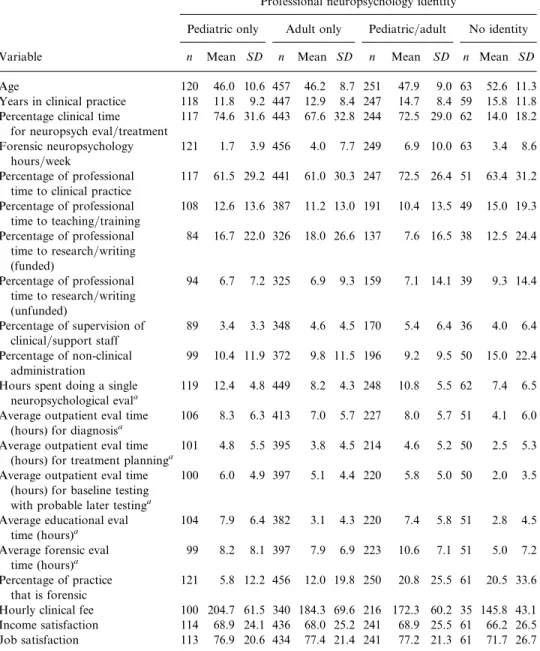
or no identity. Results of this categorization of professional identity are shown in Table 19, as a function of gender, use of testing assistants, work status, specific work setting, and general work setting. Approximately half are adult neuropsychologists, who are more likely to work in institutional settings. Among the much smaller number of pediatric neuropsychologists, women outnumber men two to one, and part-time work is overrepresented. A surprisingly high number, slightly more than one fourth, consider themselves pediatric and adult neuropsychologists. This latter group has a higher presence in private practice and is less likely to use a testing assistant. Additional information pertaining to professional identity can be seen in Table 20, which shows age, years in practice, amounts of time engaged in various professional activities, fees, and income and job satisfaction. The group with no identity is older and appears to engage in much less neuropsychological evaluation and treatment time per week, though they are frequently engaged in other clinical work. The pediatric-only and adult-only identities appear associated with fewer years in practice. Pediatric neuropsychologists are much less involved in forensic activities per week, invest considerably more hours in a single evaluation, and charge a higher hourly fee. Regarding time per evaluation, as the note for Table 20 indi-cates, there was again a wide range, reflecting the fact that numerous variables affect
Table 18 Incomes, income changes, income satisfactions and job satisfactions by state of licensure and primary employment
Gross psychology income
Respondents reporting
five-year income changea Satisfaction variable
Increase Decrease Income Job
State n Mean Median SD n % n % n Mean n Mean
Connecticut 12 142.8 122.0 57.6 9 75.0 1 8.3 12 73.8 12 82.0 California 46 139.3 100.0 99.3 38 82.6 2 4.4 46 67.3 46 76.5 New York 31 136.3 100.0 103.4 30 96.8 1 3.2 31 68.9 31 76.4 New Jersey 10 131.0 98.0 74.5 8 80.0 2 20.0 10 65.9 10 78.1 Maryland 16 130.0 102.5 84.6 15 93.8 1 6.3 16 67.1 16 70.9 Pennsylvania 30 127.4 91.9 90.9 27 90.0 1 3.3 29 71.9 29 78.3 Florida 34 121.3 93.0 83.3 29 85.3 2 5.9 32 66.6 32 78.3 Georgia 12 117.7 95.0 59.7 8 66.7 1 8.3 12 58.5 12 72.5 Virginia 16 111.1 105.0 49.1 14 87.5 0 0.0 16 72.5 16 80.8 Massachusetts 26 110.4 97.0 61.9 20 76.9 3 11.5 25 60.9 25 70.7 Illinois 34 108.0 94.0 49.7 30 88.2 3 8.8 34 67.1 34 71.0 Michigan 22 106.6 75.0 69.5 17 77.3 2 9.1 22 67.1 22 80.9 Arizona 12 105.3 86.5 55.2 9 75.0 1 8.3 12 64.7 12 81.7 Wisconsin 24 104.0 83.5 53.9 22 91.7 2 8.3 24 74.2 24 79.5 Minnesota 19 100.6 90.0 43.8 18 94.7 1 5.3 19 64.7 19 78.9 Texas 41 97.5 88.0 34.9 34 82.9 4 9.8 39 71.2 39 79.1 North Carolina 13 95.6 84.5 38.7 13 100.0 0 0.0 13 64.1 13 77.0 Washington 18 92.8 84.5 26.0 18 100.0 0 0.0 18 73.6 18 79.3 Missouri 16 85.5 79.5 29.2 14 87.5 2 12.5 15 70.7 15 76.8 Ohio 19 85.4 82.0 28.8 17 89.5 2 10.5 19 62.5 19 82.2 Colorado 11 80.5 71.0 32.2 9 81.8 1 9.0 11 60.9 11 66.1
Note. States with<10 respondents are not reported.
Downloaded By: [Washington University in St Louis] At: 00:47 12 July 2007
such information. Also note that in Table 20, the sample sizes are quite different than in Tables 4 and 8, which also show time-based information, due to the requirement that a greater amount of information from multiple survey items had to have been completed by all respondents in Table 20. Income satisfaction is very comparable across types of professional identity, as is job satisfaction, except for the no-identity group, which is lower in job satisfaction.
Table 21 shows a breakdown of age groupings of patients as a function of pro-fessional identity. Interestingly, substantial numbers of the adult-only identity group work with young children and adolescents, though these percentages are much lower than the pediatric-only and the combined pediatric=adult group.
Finally, with regard to professional identity, Table 22 shows associated incomes. The combined pediatric=adult identity reported much higher incomes than the other identities, with the pediatric identity reporting the lowest mean income.
General work settings. Gender, use of testing assistants, and work status across general work settings are depicted in Table 23. Substantially fewer women
Table 19 Professional neuropsychology identity by gender, use of technicians, work status, work setting, and income setting
Professional neuropsychology identity
Total Pediatric only Adult only Pediatric=adult None
Variable n % n % n % n % n %
Gender
Male 410 52.9 38 9.3 210 51.2 130 31.7 32 7.8
Female 365 47.1 67 18.4 179 49.0 94 25.8 25 6.8
‘‘Do you use a technician or psychometrician to collect test data from patients?’’
Yes 480 53.5 64 13.3 264 55.0 135 28.1 17 3.5
No 418 46.5 57 13.6 194 46.4 118 28.2 49 11.7
Work Status
Full time 756 84.8 102 13.5 387 51.2 215 28.4 52 6.9
Part time 59 6.6 11 18.6 32 54.2 11 18.6 5 8.5
Fullþpart time 66 7.4 7 10.6 36 54.5 21 31.8 2 3.0
Retired 7 .8 0 0.0 2 28.6 1 14.3 4 57.1
Unemployed 3 .3 0 0.0 1 33.3 1 33.3 1 33.3
Work settinga
Medical 326 37.0 65 19.9 186 57.1 70 21.5 5 1.5
Private=group practice 280 31.8 29 10.4 102 36.4 131 46.8 18 6.4
Psychiatric 43 4.9 3 7.0 24 55.8 10 23.3 6 14.0 Rehabilitation 113 12.8 4 3.5 76 67.3 24 21.2 9 8.0 College=university 59 6.7 8 13.6 32 54.2 9 15.3 10 16.9 Other 60 6.8 10 16.7 30 50.0 8 13.3 12 20.0 Income setting Institution only 402 46.0 69 17.2 243 60.4 56 13.9 34 8.5
Private practice only 225 25.8 18 8.0 90 40.0 100 44.4 17 7.6
Institutionþprivate practice 246 28.2 31 12.6 113 45.9 90 36.6 12 4.9
a
Downloaded By: [Washington University in St Louis] At: 00:47 12 July 2007
work in a private practice setting, whereas a majority of women work in institutional settings, where they slightly outnumber men. Use of testing assistants is much more common in institutions than in private practice. Part time work appears slightly more often in private practice.
Table 20 Professional neuropsychology identity basic demographics and time spent in professional activity
Professional neuropsychology identity
Pediatric only Adult only Pediatric=adult No identity
Variable n Mean SD n Mean SD n Mean SD n Mean SD
Age 120 46.0 10.6 457 46.2 8.7 251 47.9 9.0 63 52.6 11.3
Years in clinical practice 118 11.8 9.2 447 12.9 8.4 247 14.7 8.4 59 15.8 11.8
Percentage clinical time for neuropsych eval=treatment
117 74.6 31.6 443 67.6 32.8 244 72.5 29.0 62 14.0 18.2
Forensic neuropsychology hours=week
121 1.7 3.9 456 4.0 7.7 249 6.9 10.0 63 3.4 8.6
Percentage of professional time to clinical practice
117 61.5 29.2 441 61.0 30.3 247 72.5 26.4 51 63.4 31.2
Percentage of professional time to teaching=training
108 12.6 13.6 387 11.2 13.0 191 10.4 13.5 49 15.0 19.3
Percentage of professional time to research=writing (funded)
84 16.7 22.0 326 18.0 26.6 137 7.6 16.5 38 12.5 24.4
Percentage of professional time to research=writing (unfunded)
94 6.7 7.2 325 6.9 9.3 159 7.1 14.1 39 9.3 14.4
Percentage of supervision of clinical=support staff
89 3.4 3.3 348 4.6 4.5 170 5.4 6.4 36 4.0 6.4
Percentage of non-clinical administration
99 10.4 11.9 372 9.8 11.5 196 9.2 9.5 50 15.0 22.4
Hours spent doing a single neuropsychological evala
119 12.4 4.8 449 8.2 4.3 248 10.8 5.5 62 7.4 6.5
Average outpatient eval time (hours) for diagnosisa
106 8.3 6.3 413 7.0 5.7 227 8.0 5.7 51 4.1 6.0
Average outpatient eval time (hours) for treatment planninga
101 4.8 5.5 395 3.8 4.5 214 4.6 5.2 50 2.5 5.3
Average outpatient eval time (hours) for baseline testing with probable later testinga
100 6.0 4.9 397 5.1 4.4 220 5.8 5.0 50 2.0 3.5
Average educational eval time (hours)a
104 7.9 6.4 382 3.1 4.3 220 7.4 5.8 51 2.8 4.5
Average forensic eval time (hours)a
99 8.2 8.1 397 7.9 6.9 223 10.6 7.1 51 5.0 7.2
Percentage of practice that is forensic
121 5.8 12.2 456 12.0 19.8 250 20.8 25.5 61 20.5 33.6
Hourly clinical fee 100 204.7 61.5 340 184.3 69.6 216 172.3 60.2 35 145.8 43.1
Income satisfaction 114 68.9 24.1 436 68.0 25.2 241 68.9 25.5 61 66.2 26.5
Job satisfaction 113 76.9 20.6 434 77.4 21.4 241 77.2 21.3 61 71.7 26.7
aTime estimates will vary from Tables 4 and 8 due to numerous patient variables and evaluation purposes, as well as a smaller number of and different respondents to the items above. The wide range of time estimates is exemplified by the large standard deviations for time estimates.
Downloaded By: [Washington University in St Louis] At: 00:47 12 July 2007
Table 21 Professional neuropsychology identity by percentage of time spent with various age cohorts Professional neuropsychology identity
Total Pediatric only Adult only Pediatric=adult None
Percent of time spent with: n % n % n % n % n %
Children (ages 6–11) 0% 370 48.5 1 .3 321 86.8 16 4.3 32 62.7 1–25% 202 26.5 9 4.5 32 15.8 151 74.8 10 5.0 26–50% 102 13.4 41 40.2 2 2.0 50 49.0 9 8.8 51–75% 76 10.0 57 75.0 0 0.0 19 25.0 0 0.0 76–100% 13 1.7 12 92.3 0 0.0 1 7.7 0 0.0 Adolescents (ages 12–18) 0% 212 27.0 1 .5 181 85.4 5 2.4 25 11.8 1–25% 420 53.5 40 9.5 185 44.0 177 42.1 18 4.3 26–50% 135 17.2 65 48.1 4 3.0 59 43.7 7 5.2 51–75% 14 1.8 9 64.3 0 0.0 5 35.7 0 0.0 76–100% 4 .5 4 100.0 0 0.0 0 0.0 0 0.0
Young adults (ages 19–39)
0% 72 8.6 24 33.3 33 45.8 4 5.6 11 15.3 1–25% 433 51.9 65 15.0 216 49.9 125 28.9 27 6.2 26–50% 282 33.8 2 .7 169 59.9 100 35.5 11 3.9 51–75% 45 5.4 0 0.0 27 60.0 13 28.9 5 11.1 76–100% 3 .4 0 0.0 2 66.7 0 0.0 1 33.3 Older adults (40–65) 0% 100 12.2 59 59.0 17 17.0 10 10.0 14 14.0 1–25% 272 33.2 10 3.7 115 42.3 125 46.0 22 8.1 26–50% 369 45.0 0 0.0 266 72.1 88 23.8 15 4.1 51–75% 74 9.0 0 0.0 50 67.6 17 23.0 7 9.5 76–100% 5 .6 0 0.0 4 80.0 1 20.0 0 0.0 Geriatrics (>65) 0% 145 18.4 65 44.8 26 17.9 33 22.8 21 14.5 1–25% 304 38.6 3 1.0 149 49.0 132 43.4 20 6.6 26–50% 199 25.3 0 0.0 149 74.9 44 22.1 6 3.0 51–75% 97 12.3 0 0.0 79 81.4 12 12.4 6 6.2 76–100% 42 5.3 0 0.0 39 92.9 1 2.4 2 4.8
Table 22 Mean annual incomes by professional neuropsychology identitya Percentile
Neuropsychology identity n Mean Median SD 25 75 95 99 Range
No identity 30 101.7 80.0 51.5 71.5 114.8 241.8 250.0 38.0–250.0
Pediatric only 79 92.7 85.0 34.2 68.0 115.0 180.0 190.0 36.0–190.0
Adult only 321 103.7 88.0 54.9 72.5 119.0 212.7 339.0 30.0–00.0
Pediatric=adult 162 131.6 100.0 86.9 76.6 150.0 319.3 462.5 40.0–465.0
aIncludes licensed clinicians who work full time or more, excluding postdoctoral residents and those earning<$30,000 annually. Incomes are expressed in thousands of dollars.
Downloaded By: [Washington University in St Louis] At: 00:47 12 July 2007 Mean and median annual incomes vary by general work setting, as shown
in Table 24. Median incomes are highest for those working in both institutions and private practice. Those working in institutions only show much lower mean and median incomes, with a much smaller standard deviation. The top range of incomes is more than double that of institutions in the other two general work settings.
The combined influences of general work setting and years in clinical practice are shown in Table 25. Incomes within institutions nearly asymptote after 15 years, whereas in the other general work settings considerable gains are achieved after 15 years. Specific work settings. Table 26 shows the frequency of employment in specific institutional work settings. Nearly half of those working in institutions are employed in primary university hospital and medical centers or academically affiliated hospitals and medical centers. Slightly more than half of department affiliations within institutions are in either psychology departments or psychiatry
Table 23 Gender, use of technicians, and work status across employment settingsa Employment setting Total Institution only Private practice only Institutionþprivate practice Variable n % n % n % n % Gender Male 398 52.7 164 46.6 119 61.0 115 55.3 Female 357 47.3 188 53.4 76 39.0 93 44.7
‘‘Do you use a technician or psychometrician to collect test data from patients?’’
Yes 465 53.3 250 62.2 86 38.2 129 52.4
No 408 46.7 152 37.8 139 61.8 117 47.6
Work status
Full time 734 84.1 361 90.9 197 87.9 176 71.8
Part time 59 6.8 22 5.5 23 10.3 14 5.7
Fullþpart time 65 7.4 11 2.8 3 1.3 51 20.8
Retired 6 .7 1 .3 1 .4 4 1.6
Unemployed 2 .2 2 .5 0 0.0 0 0.0
aExcludes postdoctoral residents.
Table 24 Mean annual incomes by work settinga Percentile
Work setting n Mean Median SD 25 75 95 99 Range
Institution only 281 87.2 82.0 27.9 69.3 95.0 146.8 195.3 37.0–200.0
Private practice only 147 130.0 100.0 89.2 73.0 150.0 338.0 463.1 30.0–465.0
Institution=private practice 164 130.2 110.0 70.5 88.3 150.0 275.0 467.5 36.0–500.0
aIncludes licensed clinicians who work full time or more, excluding postdoctoral residents and those earning<$30,000 annually.
Downloaded By: [Washington University in St Louis] At: 00:47 12 July 2007
Table 25 Mean and median incomes by general work setting and years in clinical practicea General work setting
Institution Priv practice Institution=PP All settings
Mean Median Mean Median Mean Median Mean Median
<1–5 71,672 69,000 82,683 74,000 84,875 82,000 76,198 70,000 (n) 89 30 24 143 6–10 83,486 80,000 108,129 110,000 129,453 117,500 103,389 90,000 (n) 55 22 38 115 11–15 93,584 85,000 119,829 90,000 109,386 100,000 104,500 90,000 (n) 58 29 38 125 16–20 102,170 95,000 159,809 130,000 142,035 125,000 130,544 101,500 (n) 33 21 28 82 21–25 102,053 91,750 170,156 128,000 157,707 132,500 143,582 110,000 (n) 24 29 16 69 >25 108,346 107,000 156,688 125,000 185,368 160,000 154,948 126,500 (n) 13 16 19 48 All years 6,867 81,000 130,149 100,000 129,755 110,000 109,776 90,000 (n) 272 147 162 581 a
Includes licensed clinicians who work full time or more, excluding postdoctoral residents and those earning<30,000$ annually.
Table 26 Breakdown of specific settings, departments, academic ranks, and position titlesa within institutions
Frequency Percent
Institutional setting
Primary university hospital=med center 272 38.0
Academic affiliate hospital=med center 83 11.6
Public general hospital (non-academic) 29 4.1
Private general hospital (non-academic) 37 5.2
Public specialty hospital 25 3.5
Private specialty hospital 61 8.5
Outpatient free-standing general clinic 13 1.8
Outpatient free-standing specialty clinic 20 2.8
VA hospital=med center (academic affiliated) 29 4.1
VA hospital=med center (non-academic affiliated) 16 2.2
Military hospital 7 1.0
Military service (outside of hospital) 3 .4
Governmental=municipal hospital=clinic 9 1.3
College, 2-year, (non-medical) 2 .3
College=university, 4-year, no doctoral program 10 1.4
College=university, 4-year, with doctoral program 43 6.0
Professional school of psychology 5 .7
Research foundation (non-hospital) 5 .7
Federal prison 2 .3
Other 45 6.3
Institutional department
Psychology 193 27.0
Downloaded By: [Washington University in St Louis] At: 00:47 12 July 2007
departments, with approximately one fourth in either rehabilitation or neurology departments. Academic rank was most frequent at the assistant and associate professor levels in institutions, with approximately one in ten at the rank of full pro-fessor. Academic rank was not applicable to 44.4% of respondents who answered this question. The most common position title is staff neuropsychologist= psychologist. Neuropsychologists also serve as program directors, division heads, vice and associate chairs, and department chairs.
Incomes associated with specific institutional settings, departments, academ-ic ranks, and position titles are presented in Tables 27–30, respectively. The highest mean incomes are associated with employment in VA hospital and medical centers and neuroscience departments, and associated with the academic rank of full professor, and holding divisional or departmental administrative responsibility.
Incomes related to specific roles in private practice settings are presented in Table 31. Sole proprietors represent 66%of private practitioners and report the highest mean incomes, with the exception of the ‘‘other’’ category, which has a very large standard deviation for incomes. Median incomes are highest in the ‘‘other’’ category. Seventeen percent of those in private practice are employees of a practice, but nevertheless have mean and median income of over $90,000 annually.
Table 26 Continued
Frequency Percent
Psychiatry 177 24.8
Rehabilitation=physiatry=physical medicine 99 13.9
Neurology 88 12.3
Neuropsychology 71 6.6
Pediatrics 18 2.5
Neuroscience 15 2.1
Primary care=family medicine=internal medicine 5 .7
Neurosurgery 4 .6
Not applicable 4 .6
Other 40 5.6
Institutional academic rank
Lecturer=instructor 49 6.9 Assistant professor 154 21.8 Associate professor 120 17.0 Professor 67 9.5 Emeritus 3 .4 Not applicable 314 44.4
Institutional position title
Staff neuropsychologist=psychologist 344 49.8
Clinical program director 89 12.9
Research program director 25 3.6
Clinical training director 22 3.2
Division head 41 5.9
Vice or associate or assistant chair 5 .7
Department chair 19 2.7
Other 146 21.7
Downloaded By: [Washington University in St Louis] At: 00:47 12 July 2007 Table 28 Mean annual incomes by institutional departmenta
Institutional department n Mean Median SD Range
Neuroscience 13 122.5 100.0 60.8 54.0–275.0 Neurology 42 109.5 89.5 49.0 54.0–250.0 Neuropsychology 41 91.1 90.0 36.4 37.0–225.0 Pediatrics 11 95.7 85.0 29.9 70.0–165.3 Psychiatry 101 107.1 93.0 59.8 40.0–500.0 Psychology 132 103.3 89.5 50.9 38.0–315.0
Rehabilitation=physiatry=physical medicine 67 98.2 85.0 53.7 54.0–450.0
Other 22 87.1 81.5 26.1 53.0–160.0
a
Includes all licensed clinicians who work full time or more in either institutional or combined institu-tional=private practices. Excludes postdoctoral residents and income outliers (<$30,000). Incomes are in thousands of dollars.
Table 27 Mean annual incomes by specific institutional settinga
Institutional setting n Mean Median SD Range
VA hospital or medical center (with or without academic affiliation)
32 119.6 99.5 56.2 50.0–315.0
Outpatient free-standing clinic (general or specialty)
24 112.1 93.3 48.2 38.0–248.0
Four-year university=college (with or without doctoral psychology program)
30 105.7 77.5 65.6 47.0–350.0
Primary university hospital or medical center
151 104.1 86.0 60.5 40.0–500.0
Academic affiliate hospital or medical center
47 101.8 85.0 43.7 58.0–240.0
Private general hospital (non-academic)
28 98.8 89.5 42.1 45.0–275.0
Private specialty hospital 43 97.9 90.0 47.5 37.0–311.0
Public general hospital (non-academic)
21 85.4 82.0 17.0 67.0–140.0
Public specialty hospital 16 84.3 77.5 29.0 56.0–174.0
Other 28 102.7 88.0 48.9 54.0–275.0
aIncludes all licensed clinicians who work full-time or more in either institutional or combined institu-tional=private practices. Excludes postdoctoral residents and income outliers (<$30,000). Incomes are in thousands of dollars.
Table 29 Mean annual incomes by institutional academic ranka
Institutional academic rank n Mean Median SD Range
Lecturer=instructor 24 98.4 76.9 66.9 37.0–350.0
Assistant professor 114 87.9 80.0 35.4 47.0–311.0
Associate professor 85 108.1 91.0 43.3 40.0–275.0
Professor 41 159.4 134.0 89.5 65.0–500.0
Not applicable 168 99.5 89.5 43.8 38.0–315.0
aIncludes all licensed clinicians who work full time or more in either institutional or combined institu-tional=private practices. Excludes postdoctoral residents and income outliers (<$30,000). Incomes are in thousands of dollars.
Downloaded By: [Washington University in St Louis] At: 00:47 12 July 2007
As we have seen from earlier tables, those working in combined institutionaland private practice settings appear to be quite successful in terms of income and may have unique characteristics. Table 32 shows weekly clinical hours and incomes of individuals who have combined employment, with different portions of their work week spent in institutions. The greater the time spent in institutions (and therefore the less in private
Table 30 Mean annual incomes by institutional position titlea
Institutional position title n Mean Median SD Range
Staff neuropsychologist=psychologist 242 87.6 83.0 40.5 38.0–315.0
Clinical program director 57 109.7 90.0 66.3 37.0–463.0
Research program director 14 118.5 109.5 55.1 65.0–280.0
Clinical training director 18 98.9 83.5 41.6 67.0–240.0
Division head 33 135.6 114.0 52.3 65.0–275.0
Department chair 15 130.8 120.0 46.8 63.5–225.0
Other 42 102.8 90.0 50.3 47.0–275.0
a
Includes all licensed clinicians who work full time or more in either institutional or combined institu-tional=private practices. Excludes postdoctoral residents and income outliers (<$30,000). Incomes are in thousands of dollars.
Table 31 Psychology incomes and private practice roles
Gross psychology income
Private practice role na % Cum% nb % Mean Median SD
Sole proprietor 144 65.8 65.8 106 63.1 127.3 91.5 94.8 Partner 24 11.0 76.7 21 12.5 114.7 95.0 88.9 Employee 37 16.9 93.6 29 17.3 95.2 80.0 75.8 Outside contractor 7 3.2 96.8 6 3.6 91.0 92.5 35.5 Other 7 3.2 100.0 6 3.6 158.0 103.0 151.7 Total 219 100.0 168 100.0 120.0 90.0 92.3
aExcludes postdoctoral residents; includes licensed clinicians.
bIncludes licensed clinicians who work full time or more; excludes postdoctoral residents and income outliers (<$30,000).
Table 32 Weekly clinical hours and psychology income for respondents working in institution and private practice
Weekly percentage of combined job time spent in institution
1 to 30% 31 to 75% 76 to 99%
n Mean SD n Mean SD n Mean SD F
Number of weekly clinical hoursb 37 36.9 15.9 55 29.7 12.3 138 26.9 15.4 6.7
Psychology incomea 24 155.6 101.0 37 140.5 69.8 96 118.2 47.7 4.1
aIncludes all licensed clinicians who work full time or more in combined institutional
=private practices. Excludes postdoctoral residents and income outliers (<$30,000). Incomes are in thousands of dollars.
bExcludes postdoctoral residents only.
Downloaded By: [Washington University in St Louis] At: 00:47 12 July 2007
practice), the lower the reported incomes and the fewer number of clinical hours per week. Table 33 shows a breakdown of clinical and forensic practice times in the two different settings for neuropsychologists who work simultaneously in institutions andprivate practice. The modal individual in combined employment spends the greater amount of practice time in the institution and earns more practice income there.
Forensic practice. As described above, forensic practice involvement is positively correlated with income. Tables 34–36 provide additional information
Table 33 Incomes for respondents working in combined institution=private practicea Work setting
Institution Private practice
Income activity n Mean Median SD n Mean Median SD
Clinical practice income (excludes forensic) 103 66.0 75.0 29.3 98 44.6 24.5 53.7
Forensic practice income (excludes clinical) 16 42.6 46.5 30.3 98 36.5 20.0 44.0
Percent of total practice time spent 161 70.4 80.0 29.3 159 29.6 20.0 29.2
aIncludes all licensed clinicians who work full time or more in combined institutional
=private practices. Excludes postdoctoral residents and income outliers (<$30,000). Incomes are in thousands of dollars. Breakdowns of income for administration, teaching, research, honoraria, royalties, and publishing were not reported because of limited frequencies.
Table 34 Demographic variables and percentage of forensic practicea Percentage of forensic practice
n Mean Median SD F
Gender 27.4
Male 430 16.8 5.0 23.6
Female 391 9.1 2.0 17.6
General employment setting 67.1
Institution only 399 5.5 1.0 12.5
Private practice only 222 23.5 10.0 26.7
Institution=private practice 243 20.7 10.0 26.0
Specific employment setting 19.6
Medical 343 8.5 3.0 15.7
Private or group practice 278 23.9 10.0 26.6
Psychiatric 47 18.6 5.0 30.4 Rehabilitation 114 7.6 5.0 11.9 College=university 59 9.8 1.0 18.1 Other 35 19.0 .5 35.7 Neuropsychology identity 16.8 Pediatric only 121 5.8 2.0 12.3 Adult only 456 12.0 5.0 19.8
Both pediatric=adult 250 20.8 10.0 25.5
No identity 61 20.5 2.0 33.6
aExcludes postdoctoral residents.
Downloaded By: [Washington University in St Louis] At: 00:47 12 July 2007
regarding gender, work settings, professional identities, incomes, and job and income satisfaction as these variables pertain to involvement in forensic practice. Forensic involvement varies by gender, general and specific work setting, neuropsychology identity, and years in clinical practice. Mean and median incomes are highest in the group whose forensic practice represents 60–79%of their professional activities. For the entire sample, forensic involvement is a mean of 4.5 hours per week (median¼1; SD¼8.4) and a mean practice percentage of 14.3 (median¼5; SD¼22.6). Having zero versus ‘‘some’’ forensic involvement doesnothave a signifi-cant impact on job satisfaction or income satisfaction.
Table 35 Incomes and frequencies at various levels of forensic activity Gross psychology income
Forensic activity (%) na % Cum% nb % Mean Median SD
0 208 21.8 21.8 108 18.3 83.8 78.0 27.4 .01–.99 68 7.1 28.9 41 6.9 86.9 80.0 21.8 1–19 460 48.2 77.1 315 53.4 105.8 91.0 50.4 20–39 97 10.2 87.2 60 10.2 125.7 100.0 63.1 40–59 51 5.3 92.6 25 4.2 157.8 125.0 110.5 60–79 33 3.5 96.0 19 3.2 193.4 150.0 132.8 80–100 38 4.0 100.0 22 3.7 166.8 99.0 127.7 Total 955 100.0 590 100.0 109.8 90.0 115.0 a
Excludes postdoctoral residents. b
Includes licensed clinicians who work full time or more; excludes postdoctoral residents and income outliers (<$30,000).
Table 36 Forensic activity: Extent, years in clinical practice, job satisfaction, income satisfaction, and income
n Mean Median SD
Percentage of forensic practicea 955 14.3 5.0 22.6
Forensic hours=weeka 921 4.5 1.0 8.4
Years in clinical practicea
Zero forensic involvement 199 9.8 8.0 8.6
Some forensic involvement 732 14.6 13.0 8.8
Job satisfactiona
Zero forensic involvement 179 75.2 81.0 23.4
Some forensic involvement 662 77.5 85.0 21.0
Income satisfactiona
Zero forensic involvement 179 65.7 75.0 25.8
Some forensic involvement 666 68.9 77.0 25.0
Incomeb
Zero forensic involvement 108 83.8 78.0 27.4
Some forensic involvement 482 115.6 93.0 69.0
aExcludes postdoctoral residents.
bIncludes licensed clinicians who work full time or more; excludes postdoctoral residents and income outliers (<$30,000).
Downloaded By: [Washington University in St Louis] At: 00:47 12 July 2007
Clinical productivity expectations. Increasingly, incomes of healthcare practitioners are being judged and sometimes altered by productivity standards. As shown in Table 37, of 336 individuals who responded to this question, exactly half indicated that their incomes were based on a quota or productivity indicator. Mean and median incomes of those who responded ‘‘yes’’ and ‘‘no’’ to this question were very similar. Smaller numbers of individuals indicated that their incomes could be increased or decreased contingent upon productivity. These individuals reported substantially higher incomes than those with no contingencies in effect. Mean and median hourly fees were higher in those working under quotas or productivity expec-tations. Income satisfaction and job satisfaction appeared unrelated to presence or absence of quotas or contingencies.
Table 38 shows categorical income satisfaction for individuals experiencing five-year increase, decrease, or no change in income, as well as presence or absence of productivity standards and ability to positively or negatively influence income through productivity. Those experiencing increased income in the last five years are much more likely to be ‘‘mostly’’ or ‘‘completely’’ satisfied. There is not an obvious effect of presence or absence of productivity expectations on categorical income satisfaction, nor is there a consistent effect of negative or positive productivity contingencies on categorical income satisfaction.
Interest in leaving present position. A different perspective on comfort and satisfaction with one’s job position comes from considering one’s degree of
Table 37 Institutional income, income satisfaction, job satisfaction, and hourly fee by level of clinical productivity
Gross psychology
incomea Hourly fee
Income satisfaction
Job satisfaction
Productivity n Mean Median SD n Mean Median SD n Mean SD n Mean SD
‘‘Is your income based on a quota or clinical productivity expectation?’’
Yes 168 104.0 89.5 45.0 151 202.1 200.0 67.4 167 68.1 24.5 166 73.9 22.0
No 168 100.1 87.0 58.1 130 187.9 180.0 65.3 168 67.5 24.8 168 77.6 19.0
Total 336 102.0 88.5 51.9 281 195.9 200.0 66.7 335 67.8 24.6 334 75.8 20.6
‘‘Does your clinical productivity allow you toincreaseincome?’’
Yes 99 112.0 94.0 63.0 93 195.6 200.0 73.1 98 68.6 24.1 98 7.5 18.8
No 237 97.9 87.0 46.1 188 195.5 200.0 63.5 237 67.4 24.8 236 75.0 21.3
Total 336 102.0 88.5 51.9 281 195.5 200.0 66.7 335 67.8 24.6 334 75.8 20.6
‘‘Could your clinical productivity result in adecreasein income?’’ Yes 82 113.0 95.0 64.3 75 200.9 200.0 76.8 82 67.4 24.9 82 74.1 20.1 No 254 98.5 87.0 46.9 206 193.6 197.5 62.7 254 67.9 24.5 252 76.3 20.8 Total 336 102.0 88.5 51.9 281 195.5 200.0 66.7 336 67.8 24.6 334 75.8 20.6 a
Incomes are in thousands of dollars. Included institutional and institutional=private practice respondents only.
Downloaded By: [Washington University in St Louis] At: 00:47 12 July 2007
interest in leaving the position. Table 39 shows varying levels of interest in leaving current position, broken down by the type of setting within which the respondents work. Interestingly, those who were only able to describe their work setting as
Table 38 Categorical income satisfaction by 5-year income comparison and clinical productivity Income satisfaction Completely dissatisfied Mostly dissatisfied Somewhat dissatisfied Somewhat satisfied Mostly satisfied Completely satisfied Variable n % n % n % n % n % n % n %
Five-year income change
Increase 696 82.3 14 2.0 59 8.5 104 14.9 137 19.7 303 43.5 79 11.4
Decrease 76 9.0 9 11.8 21 27.6 24 31.6 11 14.5 9 11.8 2 2.6
No change 74 8.7 6 8.1 11 14.9 21 28.4 11 14.9 20 27.0 5 6.8
‘‘Is your income based on a quota or clinical productivity expectation?’’
Yes 219 48.1 4 1.8 32 14.6 41 18.7 49 22.4 69 31.5 24 11.0
No 236 51.9 7 3.0 20 8.5 46 19.5 39 16.5 108 45.8 16 6.8
‘‘Does your clinical productivity allow you toincreaseincome?’’
Yes 142 31.2 1 .7 19 13.4 25 17.6 26 18.3 53 37.3 18 12.7
No 313 68.8 10 3.2 33 10.5 62 19.8 62 19.8 124 39.6 22 7.0
‘‘Could your clinical productivity result in adecreasein income?’’
Yes 112 24.6 1 .9 18 16.1 23 20.5 23 20.5 33 29.5 14 12.5
No 343 75.4 10 2.9 34 9.9 64 18.7 65 19.0 144 42.0 26 7.6
Table 39 Interest in leaving present position by work setting Interest in leaving present position
Not interested; will stay in present
position
Ambivalent; unclear given both
positive and negative feeling
Somewhat interested; will at least seek info from other position
Very interested; will stay in will actively seek a new position n % n % n % n % n % Work settinga Medical 289 39.1 150 51.9 62 21.5 58 20.1 19 6.6 Private=group practice 217 29.3 152 70.0 36 16.6 22 10.1 7 3.2 Psychiatric 34 4.6 14 41.2 10 29.4 8 23.5 2 5.9 Rehabilitation 99 13.4 52 52.5 28 28.3 13 13.1 6 6.1 College=university 54 7.3 28 51.9 13 24.1 10 18.5 3 5.6 Other 47 6.4 19 40.4 14 29.8 8 17.0 6 12.8