Genetic Epidemiology of Age-Related Macular Degeneration (AMD): The Role of the Complement Component 2 (C2) and Complement Factor B (CFB) Genes in Determining AMD Subphenotypes
295
0
0
Full text
(2) Declaration I declare that this thesis is my own account of my research and contains as its main content work which has not previously been submitted for a degree at any tertiary institution.. Brooke Allison Cattell Longville. 2.
(3) Abstract Age-related macular degeneration (AMD) is the most common cause of irreversible blindness in people over the age of 50 in the developed world. Inflammation has a central role in the pathobiology of AMD; complement pathway dysfunction is thought to induce significant damage to macular cells, leading to atrophy, degeneration and the elaboration of choroidal neovascular membranes. The complement component 2 (C2) and complement factor B (CFB) genes are among several loci implicated though basic biology and genetic association studies in playing a significant role in determining susceptibility to AMD. The precise manner by which these genes affect AMD risk is unclear and largely theoretical. The purpose of this study was to examine the potential role of C2/CFB polymorphic genetic loci in determining the clinical severity of AMD and the manifestation of different AMD subphenotypes. Specifically, it was hypothesised that the C2/CFB genes are associated with AMD severity, independent of known AMD risk factors such as the complement factor H (CFH) Y402H polymorphism, smoking, and other plausible covariates. This research forms part of, and contributed greatly to, the WA Macular Degeneration Study (WAMDS); a cross-sectional clinic-based case series of 1013 AMD cases comprising 675 choroidal neovascularisation (CNV) patients, 71 geographic atrophy patients, and 267 “early” (Age-Related Eye Disease Study [AREDS] grades 1-3) patients. Case-control analyses of subphenotypes utilised either or both of the geographic atrophy and early AMD subsets as „controls‟. All participants were existing patients of the Lions Eye Institute Elsie Gadd Eye Clinic in Nedlands, Western Australia. 3.
(4) DNA samples were genotyped for C2/CFB using a haplotype-tagging set of 19 single nucleotide polymorphisms (SNPs) to capture 78% of the common variation in these genes. Additionally, the DNA samples were also genotyped for the CFH Y402H variant. AMD severity was graded according to the AREDS scale by ophthalmologists upon review of fundus photographs. Smoking and other relevant environmental/medical histories were collected via a comprehensive questionnaire. The multivariate associations of tagging SNPs and AMD phenotypes were tested. Significant associations between C2/CFB genetic variants and AMD subphenotypes were observed. The rs7746553 (P = 0.04), rs3020644 (P = 0.008) and rs4151657 (P = 0.02) variants were associated with neovascular AMD; rs7746553 was also associated with legal blindness (P = 0.04). The rs2072633 (P = 0.002), rs1048709 (P = 0.005) and rs537160 (P = 0.002) variants were associated with neovascular lesion composition. Models were adjusted for appropriate covariates and CFH Y402H, and all P values were adjusted for multiple testing. These results support the hypothesis, suggesting that C2/CFB genetic variants are associated with altered/compromised functioning of the alternative complement pathway and with a concomitant increased risk of developing more severe AMD independent of the CFH Y402H variant. Additionally, in establishing this study, I and my collaborators have created a comprehensive and useful resource for current and future AMD research.. 4.
(5) Contents Declaration ..................................................................................................... 2 Abstract ..............................................................................................3 List of Tables ...................................................................................11 List of Figures ..................................................................................15 Abbreviations ..................................................................................18 Glossary............................................................................................22 Acknowledgements .........................................................................26 CHAPTER 1: INTRODUCTION .................................................31 CHAPTER 2: LITERATURE REVIEW .....................................33 2.1 The Macula ................................................................................33 2.2 General Physiology and Biochemistry ....................................35 Differential Gene Expression in the Macula .................................................... 39 Differential Physiology of the Macula ............................................................. 39. 2.3 Visual disturbances ...................................................................40 2.4 Classification and Nomenclature .............................................42 2.5 AMD Subphenotypes ................................................................45 2.5.1 Early AMD .............................................................................................. 45 2.5.2 Atrophic AMD ........................................................................................ 47 2.5.3 Neovascular AMD................................................................................... 49 5.
(6) 2.5.4 Bilateralism ............................................................................................. 50. 2.6 Current Treatments for AMD .................................................51 2.7 Incidence and Prevalence of AMD ..........................................55 2.8 Impact of AMD .........................................................................58 2.9 Causes of AMD ..........................................................................60 2.9.1 Genetic Risk Factors ..............................................................61 Genetic Epidemiology...................................................................................... 61 Complex Diseases ............................................................................................ 62 Gene Discovery Techniques ............................................................................ 63. 2.10 Proposed Pathogenesis of AMD .............................................69 2.10.1 Inflammation and the Complement System ..................................... 70 Complement regulatory proteins .................................................................................. 72. 2.10.2 The Genetic Aetiology of AMD .......................................................... 74 Complement Component 2 and Complement Factor B ............................................... 81 Complement factor H ................................................................................................... 81 ARMS2 (aka LOC387715) and HTRA1 (HtrA serine peptidase 1) .............................. 83. 2.11 Research Aims and Hypotheses .............................................85 CHAPTER 3: METHODS .............................................................87 3.1: Study Design .............................................................................87 3.2: Study Subjects ..........................................................................87 3.3: Data Collection .........................................................................89 3.3.1: Visual Acuity ......................................................................................... 90 3.3.2: Venous Blood ......................................................................................... 90 6.
(7) 3.3.3: AMD Grading and Phenotyping ............................................................ 90 3.3.4: Questionnaire Data................................................................................. 92. 3.4: SNP Selection ...........................................................................93 3.5: Laboratory Methods .............................................................100 3.5.1: Blood sample processing ..................................................................... 100 3.5.2: DNA Preparation ................................................................................. 100 3.5.3: Genotyping ........................................................................................... 101. 3.6: Statistical Methods ................................................................107 3.6.1: Definition of Study Variables ........................................................... 107 Clinical Variables ....................................................................................................... 108 Genetic Variables ....................................................................................................... 109 Other Variables .......................................................................................................... 109. 3.6.2: Descriptive Analyses .......................................................................... 111 Descriptive statistics of study variables ..................................................................... 111 Descriptive statistics of genotype data ....................................................................... 112. 3.6.3: Hypothesis Testing ............................................................................. 113 3.6.4 Association Analyses ........................................................................... 114 Phenotypic analysis .................................................................................................... 114 Genotypic analyses..................................................................................................... 115. 3.6.5: Statistical Power Calculation ............................................................ 120 3.6.6: Multiple Testing ................................................................................. 121 3.6.7: Sensitivity Testing .............................................................................. 122. CHAPTER 4: RESULTS .............................................................123 4.1: Descriptive Statistics .............................................................123 4.1.1: Phenotypic Data ................................................................................... 123 7.
(8) 4.1.2: Genotypic Data .................................................................................... 128. 4.2: Phenotypic Analysis...............................................................132 4.2.1: Univariate Analysis .............................................................................. 132 4.2.2: Multivariate Analysis ........................................................................... 133 Late AMD .................................................................................................................. 133 CNV (Choroidal Neovascularisation/Neovascular AMD)......................................... 134 GA (Geographic Atrophy / Atrophic AMD) .............................................................. 137 Legal Blindness .......................................................................................................... 138 Low Vision ................................................................................................................. 139 Serious Complications and Manifestations ................................................................ 141 Age at Diagnosis ........................................................................................................ 143. 4.3: Genotypic Analysis ................................................................143 4.3.1: Univariate Analysis ..................................................................143 Late AMD .................................................................................................................. 143 Neovascular AMD ..................................................................................................... 144 Atrophic AMD ........................................................................................................... 148 Retinal Scarring in Neovascular AMD ...................................................................... 149 Retinal Detachment in Neovascular AMD ................................................................ 149 Retinal Haemorrhage in Neovascular AMD .............................................................. 150 Legal Blindness .......................................................................................................... 151 Low Vision ................................................................................................................. 153 Visual Acuity ............................................................................................................. 154. 4.3.2: Multivariate Analysis ........................................................................ 155 Late AMD .................................................................................................................. 155 CNV (Choroidal Neovascularisation/Neovascular AMD)......................................... 155 CNV Lesion Composition .......................................................................................... 164 CNV Lesion Size ....................................................................................................... 167 GA (Geographic Atrophy / Atrophic AMD).............................................................. 171 8.
(9) Legal Blindness .......................................................................................................... 174 Low Vision ................................................................................................................. 177 Retinal detachment ..................................................................................................... 178 Retinal Scar ................................................................................................................ 178 Age at Diagnosis ........................................................................................................ 179. 4.3.4 Evidence of Interaction with CFH Y402H Variant ........................ 181 4.3.4 Power Analysis .................................................................................... 184 4.3.5 Sensitivity Testing ............................................................................... 196 4.4 SUMMARY OF RESULTS ..........................................................198. CHAPTER 5: DISCUSSION .......................................................200 5.1: Summary and Interpretation of Results .............................202 5.1.1: Population Characteristics ................................................................... 203 5.1.2: Allele and Genotype Frequencies ........................................................ 208 5.1.3 Linkage Disequilibrium analyses .......................................................... 211 5.1.4 Genetic association analyses ................................................................. 211 Review of C2/CFB genetic variants studied .............................................................. 211 Details of Associations ............................................................................................... 215. 5.2 Strengths of Study ...................................................................217 5.3 Potential Limitations ..............................................................218 5.3.1 Aetiological loci versus linkage disquilibrium ..................................... 219 5.3.3 Statistical Power .................................................................................... 219 5.3.4 Population Stratification ....................................................................... 219 5.3.5 Multiple Testing .................................................................................... 220 5.3.6 Additional Limitations .......................................................................... 220. 5.4 Future Directions ....................................................................221 9.
(10) 5.5 Conclusion................................................................................223 Appendices .....................................................................................225 List of Appendices ........................................................................................ 225 Appendix A- Consent Form ........................................................................... 227 Appendix B- Diagnostic Questionnaire ......................................................... 228 Appendix C- Patient Questionnaire ............................................................... 230 Appendix D- Haploview plot of C2/CFB gene coverage .............................. 250 Appendix E: Univariate Results ..................................................................... 251 Appendix F: Multivariate Results .................................................................. 258. References ......................................................................................276. 10.
(11) List of Tables Table 3. 1: Definitions of AREDS AMD grades in WAMDS ............................................. 91 Table 3. 2: List of tag SNPs genotyped, and alleles captured. ............................................. 95 Table 3. 3: Details of all captured C2/CFB SNPs. Tag SNPs are in bold. (Continued on next page) ..................................................................................................................................... 96 Table 3. 4: Master mix recipe for a 3µL TaqMan assay .................................................... 103 Table 3. 5: TaqMan tag SNP assays sequences ................................................................. 105 Table 3. 6: PCR Sequencing Primers ................................................................................. 106 Table 3. 7: Summary of statistical models used in multivariate analyses .......................... 119 Table 4. 1: Demographic and clinical characteristics of subjects in the WA Macular Degeneration Study (WAMDS) population ....................................................................... 125 Table 4. 2: Clinical characteristics of neovascular AMD subjects in the WAMDS population........................................................................................................................... 126 Table 4. 3: Clinical characteristics of individual eyes with a known history of cataract surgery ................................................................................................................................ 127 Table 4. 4: Genotype frequencies of C2/CFB SNPs within WAMDS subjects, including minor allele frequencies and Hardy-Weinberg Equilibrium (HWE) P values ................... 129 Table 4. 5: Genotype frequencies of tag SNPs in major AMD subphenotype groups within the WAMDS population .................................................................................................... 130 Table 4. 6: Chi2 tests of the relationship between pre AMD diagnosis cataract surgery and various clinical outcomes ................................................................................................... 132 Table 4. 7: Final multivariate model of late AMD in the WAMDS population ................ 133 Table 4. 8: Final multivariate model of neovascular AMD in the WAMDS population ... 134 Table 4. 9: Final multivariate model of neovascular AMD in the WAMDS population (excluding GA only individuals)........................................................................................ 135 Table 4. 10: Final multivariate model of neovascular AMD in the late AMD subset of the WAMDS population .......................................................................................................... 136. 11.
(12) Table 4. 11: Final multivariate model of CNV lesion composition in the WAMDS population........................................................................................................................... 136 Table 4. 12: Final multivariate model of CNV lesion size in the WAMDS population .... 137 Table 4. 13: Final multivariate model of atrophic AMD in the WAMDS population ....... 137 Table 4. 14: Final multivariate model of atrophic AMD in the WAMDS population (excluding CNV cases) ...................................................................................................... 138 Table 4. 15: Final multivariate model of legal blindness in the WAMDS population ...... 138 Table 4. 16: Final multivariate model of legal blindness in the late AMD subset of the WAMDS population .......................................................................................................... 139 Table 4. 17: Final multivariate model of low vision in the WAMDS population ............. 140 Table 4. 18: Phenotypic covariates for predictive multivariate model of low vision in the late AMD subset of the WAMDS population .................................................................... 140 Table 4. 19: Final multivariate model of low vision in the early AMD subset of the WAMDS population .......................................................................................................... 141 Table 4. 20: Final multivariate model of retinal detachment in the neovascular AMD subset of the WAMDS population ................................................................................................ 142 Table 4. 21: Final multivariate model of retinal scarring in the neovascular AMD subset of the WAMDS population .................................................................................................... 142 Table 4. 22: Final multivariate model of age at diagnosis in the WAMDS population ..... 143 Table 4. 23: Fisher's Exact test of association of C2/CFB variants with Late AMD in WAMDS subjects .............................................................................................................. 144 Table 4. 24: Fisher's Exact test of association of C2/CFB variants with Neovascular AMD in WAMDS subjects .......................................................................................................... 145 Table 4. 25: Fisher's Exact test of association of C2/CFB variants with Neovascular AMD versus Early AMD.............................................................................................................. 146 Table 4. 26: Fisher's Exact test of association of C2/CFB variants with Neovascular AMD versus Atrophic AMD ........................................................................................................ 147 Table 4. 27: Fisher's Exact test of association of C2/CFB variants with Atrophic AMD among WAMDS subjects................................................................................................... 148. 12.
(13) Table 4. 28: Fisher's Exact test of association of C2/CFB variants with retinal detachment in neovascular AMD .......................................................................................................... 149 Table 4. 29: Fisher's Exact test of association of C2/CFB variants with Retinal Haemorrhage in Neovascular AMD................................................................................... 150 Table 4. 30: Fisher's Exact test of association of C2/CFB variants with legal blindness in WAMDS subjects .............................................................................................................. 151 Table 4. 31:Fisher's Exact test of association of C2/CFB variants with Legal Blindness in Late AMD .......................................................................................................................... 152 Table 4. 32: Kruskal Wallis univariate test of association of worse eye Snellen visual acuity with C2/CFB genotypes ..................................................................................................... 154 Table 4. 33: Estimated odds ratios of neovascular AMD for C2/CFB genetic variants among WAMDS subjects (continued on next page) .......................................................... 156 Table 4. 34: Estimated odds ratios of neovascular AMD for C2/CFB genetic variants among WAMDS subjects: under dominant and recessive models .................................... 158 Table 4. 35: Estimated odds ratios of neovascular AMD versus Atrophic AMD for C2/CFB genetic variants under codominant models (continued on next page) ............................... 161 Table 4. 36: Estimated odds ratios of neovascular AMD versus atrophic AMD for C2/CFB genetic variants: under dominant models ........................................................................... 162 Table 4. 37: Estimated odds ratios of CNV lesion composition for C2/CFB genetic variants among neovascular AMD WAMDS subjects under codominant models (continued on next page) ................................................................................................................................... 164 Table 4. 38: Estimated odds ratios of CNV lesion composition for C2/CFB genetic variants among neovascular AMD WAMDS subjects: under recessive models ............................. 166 Table 4. 39: Estimated odds ratios of CNV lesion size for C2/CFB genetic variants among neovascular AMD WAMDS subjects under codominant models (continued on next page) ............................................................................................................................................ 168 Table 4. 40: Estimated odds ratios of CNV lesion size for C2/CFB genetic variants among neovascular AMD WAMDS subjects: under recessive model .......................................... 170 Table 4. 41: Estimated odds ratios of atrophic AMD for C2/CFB genetic variants among WAMDS subjects under codominant models (continued on next page) ........................... 171 Table 4. 42: Estimated odds ratios of Atrophic AMD for C2/CFB genetic variants among WAMDS subjects: under dominant models ....................................................................... 173 13.
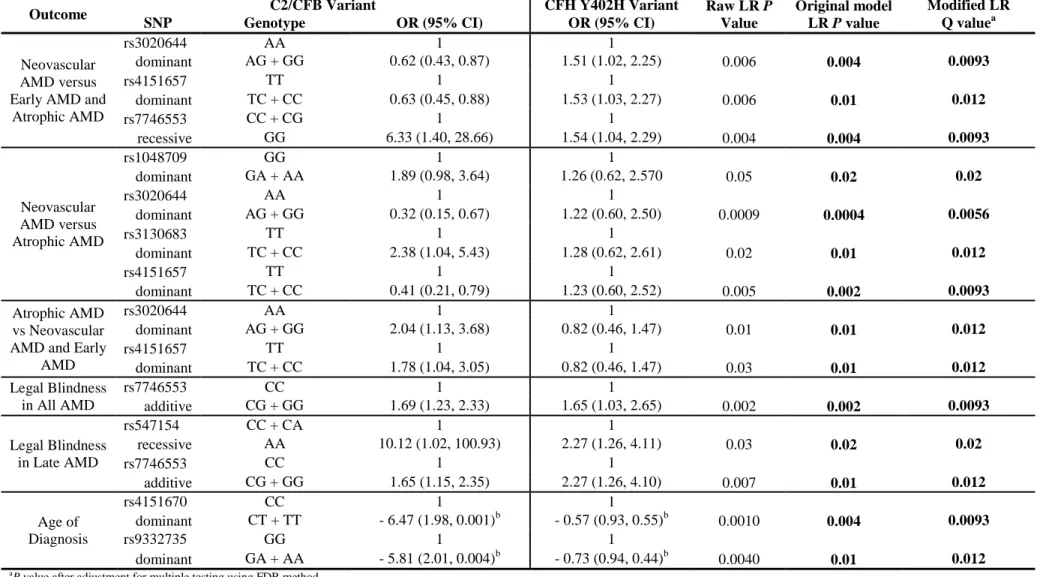
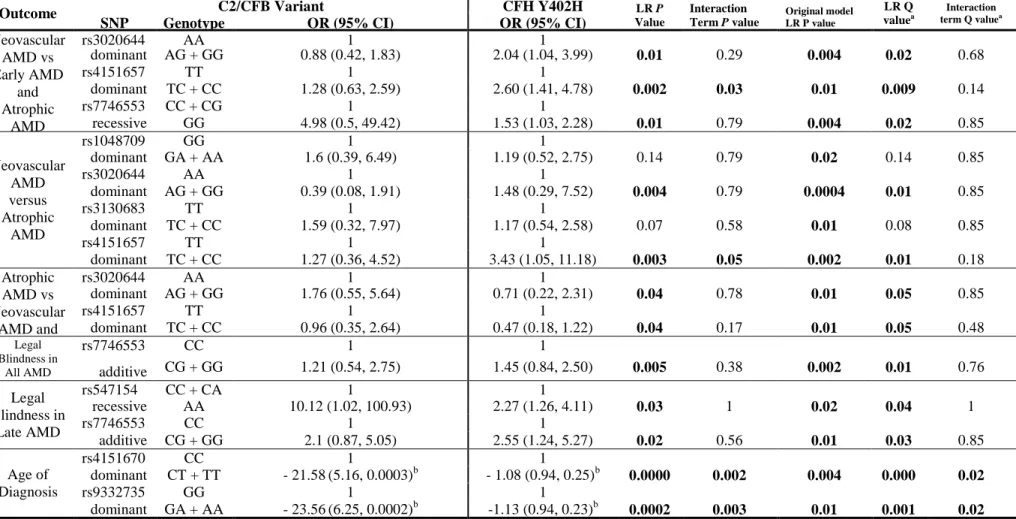
(14) Table 4. 43: Estimated odds ratios of legal blindness for C2/CFB genetic variants among WAMDS subjects under codominant models (continued on next page) ........................... 174 Table 4. 44: Estimated odds ratios of legal blindness for C2/CFB genetic variants among WAMDS subjects: under recessive and additive models .................................................. 176 Table 4. 45: Estimated influence of C2/CFB variants on age of AMD diagnosis among WAMDS subjects under a codominant model (continued on next page) .......................... 179 Table 4. 46: Modification of positive tests by inclusion of CFH Y403H covariate .......... 182 Table 4. 47: Modification of positive tests by the inclusion of CFH Y402H:C2/CFB interaction term .................................................................................................................. 183 Table 4. 48: Re-analysis of positive associations within Caucasian subset (n=811)a ........ 197 Table 4. 49: Summary of significant associations between C2/CFB genetic variants and dichotomous AMD subphenotypes, adjusted for multiple testing ..................................... 198 Table 4. 50: Summary of significant associations between C2/CFB genetic variants and CNV lesion composition in neovascular AMD cases ........................................................ 199 Table 5. 1: Reported Minor Allele Frequencies ................................................................. 210. 14.
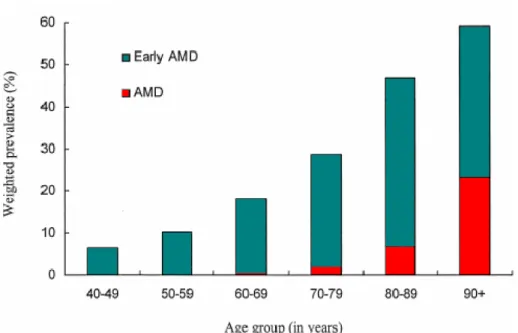
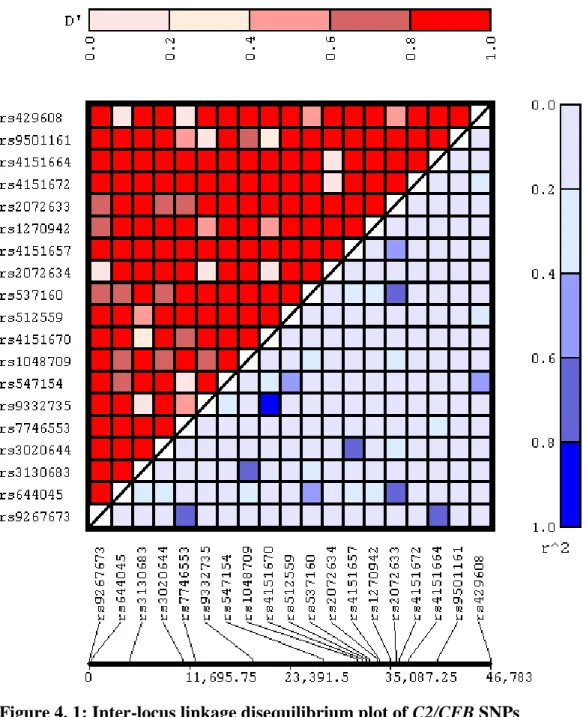
(15) List of Figures Figure 2. 1: A section of the human eye showing the location of the macula ..................... 33 Figure 2. 2: The cross-sectional layout of the macular portion of the retina is illustrated, and the exchange of oxygen and waste between the retinal pigment epithelium (RPE) and the choroid layer via Bruch‟s membrane is shown. ................................................................... 34 Figure 2. 3: Cross sectional illustration of a normal retina, centred on the fovea and macula. .............................................................................................................................................. 36 Figure 2. 4: Comparison between young and aging RPE cells. ........................................... 38 Figure 2. 5 a): An image as seen by an individual with normal healthy vision; b) An example of the visual distortion that may be experienced by an individual with AMD ...... 41 Figure 2. 6: Cross section of the retina, displaying the location of drusen. ......................... 45 Figure 2. 7: a) Soft drusen as seen in colour fundus photography. b) Hard drusen as seen in colour fundus photography. ................................................................................................. 46 Figure 2. 8: Geographic atrophy as seen in a colour fundus photograph of an atrophic AMD retina. .................................................................................................................................... 48 Figure 2. 9: Cross section of wet AMD retina, showing location of CNV-related haemorrhage ......................................................................................................................... 49 Figure 2. 10: A small haemorrhage as seen in colour fundus photography of a neovascular AMD retina. ......................................................................................................................... 50 Figure 2. 11: Age-weighted prevalence of AMD in Australia. ............................................ 57 Figure 2.12: The complement system .................................................................................. 72 Figure 2.13: The alternative complement pathway ............................................................. 73 Figure 3. 1: Tag SNPs located in the complement component 2 (C2) gene ........................ 98 Figure 3. 2: Tag SNPs located in the complement factor B (CFB) gene ............................. 99 Figure 3. 3: TaqMan SNP genotyping: cleavage of hybridised allele-specific probes by Taq DNA polymerase generates increases in reporter fluorescence. Vic and Fam fluorescent signals are generated for Alleles 1 and 2 respectively. ...................................................... 102 Figure 4. 1: Inter-locus linkage disequilibrium plot of C2/CFB SNPs .............................. 131. 15.
(16) Figure 4. 2: Power to detect associations between genetic variants and late AMD versus early AMD under an additive genetic model ..................................................................... 184 Figure 4. 3: Power to detect associations between genetic variants and late AMD versus early AMD under a dominant genetic model ..................................................................... 185 Figure 4. 4: Power to detect associations between genetic variants and late AMD versus early AMD under a recessive genetic model ..................................................................... 185 Figure 4. 5: Power to detect associations between genetic variants and neovascular AMD versus early and atrophic AMD under an additive genetic model ..................................... 186 Figure 4. 6: Power to detect associations between genetic variants and neovascular AMD versus early and atrophic AMD under a dominant genetic model ..................................... 187 Figure 4. 7: Power to detect associations between genetic variants and neovascular AMD versus early and atrophic AMD under a recessive genetic model ..................................... 187 Figure 4. 8: Power to detect associations between genetic variants and neovascular AMD versus early AMD under an additive genetic model .......................................................... 188 Figure 4. 9: Power to detect associations between genetic variants and neovascular AMD versus early AMD under a dominant genetic model .......................................................... 189 Figure 4. 10: Power to detect associations between genetic variants and neovascular AMD versus early AMD under a recessive genetic model .......................................................... 189 Figure 4. 11: Power to detect associations between genetic variants and neovascular AMD versus atrophic AMD under an additive genetic model ..................................................... 190 Figure 4. 12: Power to detect associations between genetic variants and neovascular AMD versus atrophic AMD under a dominant genetic model..................................................... 191 Figure 4. 13: Power to detect associations between genetic variants and neovascular AMD versus atrophic AMD under a recessive genetic model ..................................................... 191 Figure 4. 14: Power to detect associations between genetic variants and atrophic AMD versus neovascular and early AMD under an additive genetic model ............................... 192 Figure 4. 15: Power to detect associations between genetic variants and atrophic AMD versus neovascular and early AMD under a dominant genetic model ............................... 193 Figure 4. 16: Power to detect associations between genetic variants and atrophic AMD versus neovascular and early AMD under a recessive genetic model ............................... 193. 16.
(17) Figure 4. 17: Power to detect associations between genetic variants and atrophic AMD versus early AMD under an additive genetic model .......................................................... 194 Figure 4. 18: Power to detect associations between genetic variants and atrophic AMD versus early AMD under a dominant genetic model .......................................................... 195 Figure 4. 19: Power to detect associations between genetic variants and atrophic AMD versus early AMD under a recessive genetic model .......................................................... 195. 17.
(18) Abbreviations AIC. Akaike Information Criterion. AMD. Age-related Macular Degeneration. AREDS. Age-Related Eye Disease Study. Arg. Arginine. Asp. Aspartate. BMI. Body Mass Index. bp. base pair/s. C2. Complement Component 2 protein (gene if italicised). C3a. Complement component 3a. C3b. Complement component 3b. C5a. Complement component 5a. CEU. Caucasian-European. CFB. Complement Factor B protein (gene if italicised), also known as BF or Factor B. CFH. Complement Factor H protein (gene if italicised). CFP. Colour Fundus Photography. CI. Confidence Interval. 18.
(19) CNV. Choroidal Neovascularisation. CRP. Complement Reactive Protein. DA. Disc Areas. DNA. Deoxyribonucleic Acid. EDTA. Ethylenediaminetetraacetic acid. FDR. False Discovery Rate. GA. Geographic Atrophy. Glu. Glutamate. Gln. Glutamine. His. Histidine. HWE. Hardy-Weinberg Equilibrium. JLIN. Java-based Linkage disequilibrium plotter. kb. kilobase/s. LD. Linkage Disequilibrium (r2). LEI. Lions Eye Institute. Leu. Leucine. logMAR. Logarithm of the Minimum Angle of Resolution. 19.
(20) LR. Likelihood Ratio. MAF. Minor Allele Frequency. Met. Methionine. MHC. Major Histocompatibility Complex. mRNA. messenger Ribonucleic Acid. n. sample size. NCBI. National Center for Biotechnology Information. NSAID. Non-Steroidal Anti-Inflammatory Drug. OR. Odds Ratio. P. P value. PCR. Polymerase chain reaction. r2. see entry for “LD”. RPE. Retinal Pigment Epithelium. SCR. Short Consensus Repeats. SE. Standard Error. SNP. Single Nucleotide Polymorphism. UTR. Untranslated Region. VA. Visual Acuity 20.
(21) VEGF. Vascular Endothelial Growth Factor. WAMDS. Western Australian Macular Degeneration Study. 21.
(22) Glossary Allele: One of two or more alternative forms of a gene located at the corresponding site of homologous chromosomes Association: The statistical association of an allele with a phenotypic trait. Statistical dependence between two or more events, characteristics, or other variables. Bias: Deviation of results or inferences from the truth, or processes leading to such deviation. Bonferroni correction: A multiple test correction method. The false-positive rate is divided by the number of tests, and this modified number is used to declare any single change to be significant. Candidate Gene: A sequenced gene of previously unknown function that, because of its chromosomal position or some other property, becomes a candidate for a particular function such as disease determination. Chromosome: A linear end-to-end arrangement of genes and other DNA, sometimes with associated protein and RNA. Complex Genetic Disorder: A disease that involves several genetic and environmental factors, and which does not exhibit a classic Mendelian pattern of inheritance. Confounding variable (confounder): An additional variable that may be responsible for an apparent association between a genotype and a phenotype. Covariate: A potentially confounding variable controlled for in analysis of 22.
(23) covariance. Exon: The region of a gene that is present in the final mRNA transcript. Genome: The total complement of DNA carried by an individual. Haplotype: A group of nearby alleles that are inherited together. Hardy-Weinberg equilibrium: The stable frequency distribution of genotypes A/A, A/a, and a/a, in the proportions p2, 2pq, and q2, respectively (where p and q are the frequencies of the alleles A and a), that is a consequence of random mating in the absence of mutation, migration, natural selection, or drift. Heritability: The proportion of population variance in a trait attributable to segregation of a gene or genes. Heterozygous: Having two different alleles at a specific autosomal (or X chromosome in a female) gene locus. Homozygous: Having two identical alleles at a specific autosomal (or X chromosome in a female) gene locus. Intron: A non-coding sequence of DNA that is initially copied into RNA but is spliced out of the final RNA transcript. Linkage: The tendency for genes that are located close to each other on the same chromosome to be inherited together. Linkage disequilibrium: Two alleles at different loci that occur together within an. 23.
(24) individual more often than would be predicted by random chance. Also called population allelic association. Locus: Any genomic site, whether functional or not, that can be mapped through formal genetic analysis. Marker: A segment of DNA with an identifiable physical location on a chromosome and whose inheritance can be followed. Meta-analysis: A method for combining the results from several independent studies of the same outcome so that an overall P value may be determined. Molecular genetics: The study of the molecular processes underlying gene structure and function. Monogenic: Controlled by or associated with a single gene. Oligonucleotide: Short sequence of single-stranded DNA or RNA. P value: The probability of observing a result as extreme as or more extreme than the one actually observed from chance alone (i.e. if the null hypothesis is true). Pathophysiology: Derangement of function seen in disease. Phenotype: The clinical presentation or expression of a specific gene or genes, environmental factors, or both. Polygenic: Pertaining to the combined action of alleles of more than one gene. Polymerase chain reaction (PCR): A method for amplifying specific DNA segments that exploits certain features of DNA replication. 24.
(25) Polymorphism: A common variation (>1%) in the sequence of DNA among individuals. Population stratification: Occurs when cases and controls have different allele frequencies attributable to diversity in background population, unrelated to outcome status. A potential confounding factor in genetic association studies. Power: The ability of a study to detect an actual effect or difference. Primer: An oligonucleotide sequence used in a polymerase chain reaction. Probe: Defines a nucleic acid segment that can be used to identify specific DNA molecules bearing the complementary sequence. Promoter: The part of a gene that contains the information to turn the gene on or off. The process of transcription is initiated at the promoter. Recombination: The exchange of genetic material between homologous chromosomes during meiosis, producing a combination of alleles at two distinct loci.. 25.
(26) Acknowledgements This work would not have been possible without the support and wisdom of many people. First and foremost, I thank my supervisors for providing me with this opportunity. All of you inspired me and guided me through the trials and tribulations of scientific research in a field that was initially rather alien to me. Professor Lyle Palmer is a visionary who truly embodies all things which make a great scientist; passion, inspiration, motivation and dedication; with a contagious sense of humour as a bonus. Your personality and enthusiasm were incredibly inspiring and although keeping up with you was sometimes a challenge, it was a challenge I relished and needed. I feel we have a quiet understanding and acceptance of each other, and I appreciated being able to develop in the company of a kindred spirit. The nicest and most approachable academic on the planet would have to be Dr Wayne Greene, who I couldn‟t bear to part with after completing my honours under his supervision. I thank you for always believing in me and having the uncanny talent of knowing exactly when I needed to be saved (and then saving me, or helping me to save myself!). You have often been a last beacon of hope and courage when I felt all was lost. You taught me how to be a practical optimist, and that success can be defined in many ways; happiness is the ultimate success. I hope I can continue to benefit from your mentorship in future, and that my continued intellectual growth is a fitting testament to your excellent tutelage. I also thank Professor Ian Constable, then-Director of the Lions Eye Institute, for his patience, support and dedication to the cause. I am amazed and humbled that you managed 26.
(27) to squeeze time for me in between your lengthy hours of consultation, surgery and the considerable demands that go hand in hand with being a famous, successful and all-round world class ophthalmologist/researcher. You are superhuman, yet human; always putting your patients first and rarely stopping to rest. My supervisors‟ wives also deserve special thanks for tolerating the extra stress I created for their husbands! In particular, Dr Sutapa Mukherjee; for providing special aid and support at critical times, and Dr Elizabeth Constable; for unselfishly allowing her husband to share his knowledge and skills with the world, regardless of the hours involved. I thank the numerous people working at the Lions Eye Institute; the marvellous ophthalmic photographers Frank Shilton and Chris Barry who kept me sane during many clinic shifts, the many helpful nurses and receptionists (a big shout-out to Daphne especially), the brilliant and accommodating clinic manager Julie Robson, and ophthalmologists Professor Ian McAllister and Dr Tim Isaacs. All of these people went above and beyond their usual responsibilities in assisting me with the study whenever possible. Special thanks go to the personal assistants of Professor Piroska Elizabeth Rakoczy, Stacey Scaffardi and Natalie Mitchell, and Professor Ian Constable‟s wonderful assistant Esther McCloskey. Thanks are due to many people at PathWest, in particular A/A Professor John Beilby and research assistants Michelle Jennens and Gillian Arscott. Extended thanks go out to WA DNA Bank manager Dr Marion Macnish and staff Simone Dowd and Laura Greenwood. I am indebted to all of my colleagues at the Centre for Genetic Epidemiology and Biostatistics; it was a pleasure to work alongside such intelligent, dynamic and outstanding people. In particular, my wonderful statistical consultants, Dr Pamela McCaskie and Nicole 27.
(28) Warrington, were critical to the success of this project. I thank Nicole for being incredibly patient with me, and dedicating so much time and effort to my analytical plight. Pam, I thank you for being a role model and trusted confidante, your wisdom and empathy got me through many tough times. I thank my mentors; Dr Brenda Powell, Dr Anne Pratt and Dr Marion Macnish; for being there for me at every turn, armed with sound advice, inspiration, and a shoulder to lean on. Special thanks to Marion for going above and beyond in proofreading my thesis. Great thanks are due to the creative and efficient IT team; in particular Chris Williams, Chris Ellis, Kim Carter, CK Leong, Paul White and Declan Lynch; your extraordinary efforts made this study possible, and your professional, friendly and approachable dispositions made it a pleasure to work with you. I am indebted to the many efficient personal assistants of Prof Lyle Palmer; Jeanette Dungey, Ida Handy, Janet Gitsham, Lisa Bayley, and Brenda Loney, who recently received her baptism (largely by way of printing and binding a copy of my thesis). Finally, I thank Matt Cooper for helping me retain my sanity in the late stages of this thesis. I respectfully acknowledge and greatly appreciate the essential financial and infrastructural support that made both this research and my PhD studentship possible; I thank the Wind Over Water Foundation, Professor Ian Constable and the Lions Eye Institute, A/A Professor John Beilby and PathWest, the UWA Centre for Genetic Epidemiology and Biostatistics, WAIMR and the Australian Government. I gratefully acknowledge the assistance of the Western Australian Genetic Epidemiology Resource and the Western Australian DNA Bank (both National Health and Medical Research Council of Australia National Enabling Facilities). Furthermore, I thank Murdoch University for providing me with the best possible environment and academic support throughout my nine years of 28.
(29) tertiary education. In particular, Associate Professor Robert (Bob) Mead deserves special mention for his critical guidance throughout my undergraduate years, and Dr Wayne Greene, my champion and trusted mentor throughout my postgraduate studies. Outstanding people like Bob and Wayne, combined with a unique, inclusive and intelligent ethos, make Murdoch a truly great university. Murdoch, I thank you for choosing me. I salute the entire AMD study team; Caroline Adams, Jude Willis, Dr Alex Tan, Dr Xia Ni Wu, soon-to-be-Dr Jing Xiao and Dr Xuefeng Feng. Without your contributions of time and effort this study would not have existed, let alone produced valuable data. Furthermore, your friendship and cooperation saved my sanity countless times; so many things I want to say to you all. To all of my “surrogate grandparents”; the generous participants of the WA Macular Degeneration Study, I thank you for your enthusiasm and patience; it was a joy meeting all of you and being able to share the wealth of knowledge you volunteered. I hope my research may one day benefit your children and grandchildren, and justify our collective sacrifices. To my loyal and patient friends, I am eternally grateful for your friendship and support. While there are too many wonderful people to mention them all, a select few were particularly influential during critical stages of my PhD. The cheery and intelligent Dr Jacqueline McGlade made me look forward to each day as an undergraduate, and she has been a role model and shining beacon at the end of the PhD tunnel. Soon-to-be-Dr Yazid Abdad was the ultimate KFC lunch buddy, and guaranteed to laugh at even my weakest jokes. Soon-to-be-Dr Roheeth Delima has been an insightful and inspirational influence on me, and I value our numerous lengthy philosophical conversations. And finally, I thank Clinton Hall for giving me a refreshing perspective and moral support; you gave me my 29.
(30) proper second wind when I had been flailing around in a mini-tornado of sorts for too long. I hope I‟m worthy and deserving of your continued friendship as, one by one, we head out into the world as real scientists. Finally, I owe a great deal to my family for helping me weather the storm and survive the hard yards. To my parents Don and Liz; I thank you for giving me the space I needed, and not trying to stop me! To my awesome sister and flatmate Shannon; I cannot count the number of times you have inspired, supported and humoured me. I‟m glad we don‟t have any other siblings, because I wouldn‟t want to share you! You are irreplaceable. To my soul mate Mitchell Baird, I thank you for sticking by me every day, through the hard times, the boring times, and (almost) every crazy idea that popped into my head. You are my rock, I couldn‟t have survived without you. I love you all very much; thank you for loving me in return. And to everyone else who has had a hand in my life up until this point, I thank you for contributing to something so complicated yet wonderful.. 30.
(31) Chapter 1: Introduction Age-related macular degeneration (AMD) is the principal cause of registered legal blindness in those aged over 65 years in the United States of America, Western Europe, Australia and Japan.2-4 AMD is characterised by progressive destruction of the retina‟s central region (macula), causing central field vision loss.5 A variety of pathological changes in the macula of an affected eye can lead to visual disturbances, and in more extreme cases, loss of central vision.5 AMD is often a diagnosis of exclusion as the diverse symptoms seen in AMD cases are also found in many other conditions.5, 6 The internal diversity of AMD phenotypes creates further uncertainty when considering the condition as a discrete disease.6 Possibly the most appropriate and modern working definition of AMD is that described by Edwards and Malek:6 “AMD is a clinical phenotype. It is the typical appearance of a constellation of findings observed in the outer retina and choroid that is used to define the presence and severity of disease. AMD may or may not be a single disease. Indeed, the breadth of criteria used to define the phenotype in a study can have a major impact on the number of different diseases included in a group of “AMD patients”. A working definition of AMD might be a maculopathy characterised by the variable presence and extent of subretinal deposits called drusen with or without evidence of damage to the underlying retinal pigment epithelium.”6 This definition captures the many diagnostic uncertainties that must be considered when studying AMD, uncertainties that may be resolved as research progresses.. 31.
(32) Adopting Edwards and Malek‟s definition,6 AMD is a clinical phenotype used for a collection of symptoms observed in the outer retina and choroid layers that cause visual disturbance and vision loss in the elderly.6 These signs are loosely grouped into subphenotypes; early AMD (often referred to as age-related maculopathy), and two types of late AMD, neovascular and atrophic.5 The diagnosis of AMD rests on signs in the macula, irrespective of visual acuity.5 AMD can be defined in a number of ways, depending on the hypothesis and focus of study.5 For simplicity, it is often referred to as if it is one disease alone, which is potentially misleading.6 It is still difficult to determine whether AMD and its various forms are one discrete disease, or several diseases with various different mechanisms.6 The only known common denominator between all cases is age, thus research is being conducted in many countries in an attempt to elucidate the genetic and environmental factors involved.3, 4, 7-47. 32.
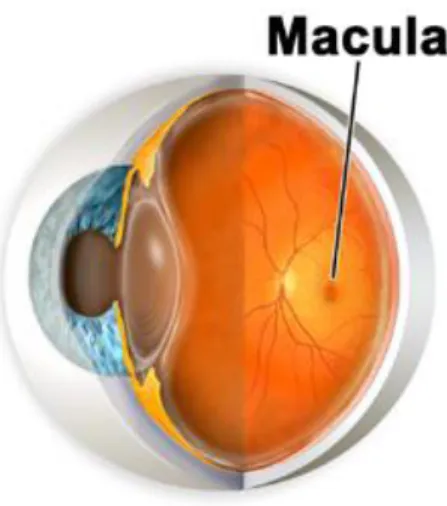
(33) Chapter 2: Literature Review 2.1. The Macula. Figure 2. 1: A section of the human eye showing the location of the macula1. The macula (Figure 2. 1) is formally known as the macula lutea, meaning „yellow spot‟, but for practical purposes this is usually truncated. A circular region of the retina situated at the back of the eye, the macula contains the highest concentration of rod and cone photoreceptor cells, responsible for detecting light and colour respectively. The macula converges into the fovea, a small avascular depression in the middle of the macular region. Traversing from the outer regions of the macula to the fovea in the centre, there is an increase in photoreceptors and a decrease in vascularity; and a corresponding increase in visual clarity. The smooth surface of the macula and the fovea required for detailed resolution is achieved by the distinct lack of blood vessels in the region. The macula and its. 33.
(34) large population of photoreceptors thus rely on a fragile and sensitive exchange of oxygen and wastes with the choroid layer via Bruch‟s membrane (Figure 2. 2). This offers a likely explanation of why the macular region of the retina is largely affected in AMD, as opposed to the entire retina. The macula may be likened to a canary in a coal mine; it is sensitive to changes in oxygen levels, and should there be a disturbance in oxygen supply, the macula is the first to show signs of hypoxic stress.. Figure 2. 2: The cross-sectional layout of the macular portion of the retina is illustrated, and the exchange of oxygen and waste between the retinal pigment epithelium (RPE) and the choroid layer via Bruch’s membrane is shown. There are two main theories to explain why the macula in particular is affected in AMD rather than other areas of the retina. Firstly, the gene expression patterns in the macula may differ significantly from those seen in non-macular retinal areas, resulting in different levels of certain gene products. Secondly, the physiological differences in the structure and composition of the macula compared to the rest of the retina may cause a predisposition to pathological changes such as those seen in AMD. An exploration of these hypotheses follows, with supporting evidence provided where available.. 34.
(35) 2.2. General Physiology and Biochemistry. When investigating any disease, and especially a complex disease such as AMD, it is important to do so in context of the function and physiology of tissues involved. An understanding of biochemistry and differential expression of key species is also crucial. This section will explore the function, physiology and biochemistry of relevant tissues, with particular focus on the macula. Elucidation of differences between the macula and the more distal regions of the retina may help us understand why AMD primarily affects the macula, and to theorise the possible causes of AMD. The combined cooperative layers of the retinal pigment epithelium (RPE), Bruch‟s membrane and the choroid (Figure 2. 3) are referred to as Ruysch‟s complex, where all of the pathological effects of AMD take place. Bruch‟s membrane is a thin semi-permeable membrane between the choroid and the RPE, and is the site of oxygen and waste exchange between the blood supply and the RPE cells. It is here, on the surface of Bruch‟s membrane, debris accumulations called drusen form in AMD sufferers. Drusen are discussed in further detail in section 2.5. As Bruch‟s membrane is simply an inert semipermeable barrier between the RPE and the choroid, the latter two structures will be the focus of further discussion.. 35.
(36) Figure 2. 3: Cross sectional illustration of a normal retina, centred on the fovea and macula.. The Retinal Pigment Epithelium The RPE is a central element in the pathogenesis of AMD.48 It is a post-mitotic, cuboidal monolayer of cells with a very high metabolic rate.48 The RPE cell derives its name from the numerous melanosomes within its cytoplasm.48 Of the 10 known functions of the RPE, the most important are regeneration of bleached visual pigments; formation and maintenance of two extracellular matrixes, the interphotoreceptor matrix and Bruch‟s membrane; transport of fluids and ions between photoreceptors and the choriocapillaris; and phagocytosis.48 A pivotal function of the RPE is the regeneration of the visual pigment rhodopsin.48 The absorption of light by rhodopsin creates a visual signal and results in a change in the molecule that necessitates the reconstitution of dark-adapted visual pigment.48 This process 36.
(37) occurs largely within the RPE through many complex intermediate steps.48 One of them entails RPE65, an enzyme that converts all-trans retinyl esters into 11-cis retinal, which is essential for the function of rods and cones.49 The RPE is a phagocytic system that is essential for the renewal of photoreceptors.48 Each photoreceptor has an inner and outer segment, separated by an invagination, the connecting cilium.48 The outer segment of each rod has about 1000 disks,50 and the outer segment of every cone has a membrane that is folded 700 times, stacked like a roll of coins.48 The disks are necessary for the conversion of light into electrical potentials.48 In each disc membrane, the transmembrane protein rhodopsin is positioned in combination with four phospholipids and docosahaxanoic acid.51 The tips of both types of photoreceptors are shed from their outer segments and engulfed and degraded within the RPE.52 The shedding is balanced by the addition of membranes at the base of the outer segments of rods and the replacement of nucleic acids, proteins, and lipid throughout the cones.48 In the rhesus monkey, about 3000 disks are shed daily from 30 photoreceptors in each RPE cell.53 These shed disks fuse with lysosomes, forming phagolysosomes.48 The contents of the phagolysosomes are incompletely degraded within acid lysosomal compartments and form the residual bodies that are the substrates for lipofuscin formation.48. The Choroid The choroid layer hosts the blood supply for the retina, seemingly paradoxically high in the peripheral regions of the retina and low in the critical regions of the macula and fovea. As inconvenient as this trend is, it serves the function of maintaining a smooth RPE surface as required for detailed vision.. 37.
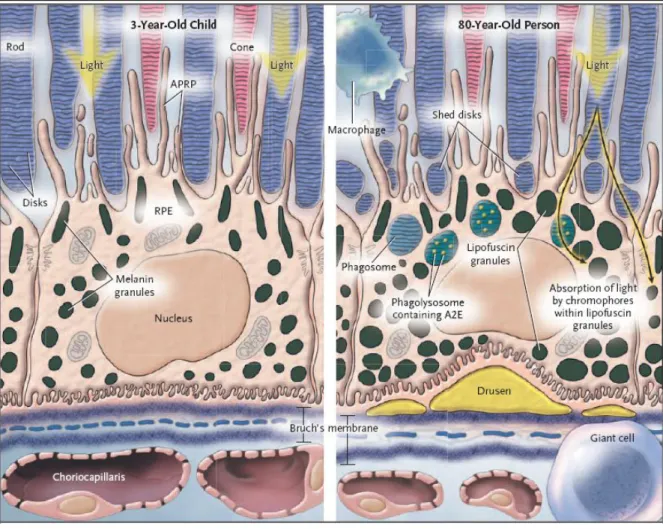
(38) Figure 2. 4: Comparison between young and aging RPE cells.48 Figure 2. 4 Legend: RPE cell in a 3-year-old child (left-hand panel) and an 80-year-old person (right-hand panel). The outer segments of the rods and cones are embedded in the interphotoreceptor matrix (blue-gray areas) and partially surrounded by apical pseudopodial RPE processes (APRP). The shed disks (right-hand panel) become encapsulated in the phagosomes and are digested in phagolysosomes in the cell cytoplasm of the RPE. Macrophages and fused macrophages (giant cells) remove cellular debris around the cell. Light-induced toxicity occurs as light is absorbed by the various chromophores in the lipofuscin granules. This damages DNA and cell membranes and causes inflammation and apoptosis. The right-hand panel shows enlarged lipofuscin granules, the thickened Bruch‟s membrane, and the attenuation of the choriocapillaris. The central elastic lamina in Bruch‟s membrane becomes more porous in old age. Figure and legend reproduced and adapted from de Jong et al..48. 38.
(39) Figure 2. 4 illustrates common age-related differences between the retina of a young child and an elderly individual. The changes observed are particularly critical in the macula due to the higher concentration of photoreceptors.. Differential Gene Expression in the Macula The molecular basis for the macula‟s predisposition to degenerative disease is still not understood.54 Radeke et al.54 examined the molecular basis for the macula‟s disease susceptibility by comparing the gene expression profile of the human RPE/choroid in the macula with the profile in the extramacular region using DNA microarrays.54 Significant differences in gene expression were found in genes related to inflammation (CCL19, CCL26, CXCL14, SLIT2), angiogenesis (CXCL14, SLIT2, TFP12, WFDC1), extracellular matrix components (DCN, MYOC, OGN, SMOC2, TFP12) and an RPE cell growth factor (TFP12) .54 All of these processes are highly relevant to AMD pathogenesis.54 With the possible exception of CX3CR1,55 none of the genes associated with any type of macular degeneration were shown to be differentially expressed in the macula.54. Differential Physiology of the Macula The macula‟s predisposition to degenerative disease may be attributable to specialised structural features and/or functional properties of the underlying macular RPE/choroid and Bruch‟s membrane.56 Chong et al.56 found a significant difference in the thickness and elastic integrity of Bruch‟s membrane between extra-macular regions of low susceptibility to degeneration and macular regions with high susceptibility to degeneration, such that the differences in Bruch‟s membrane could be used to delineate the entire macular region.56. 39.
(40) One obvious distinction between the macula and extramacular regions is the difference in retinal organisation and photoreceptor distribution.54 Accordingly, it has been suggested that the cone-rich macula may be subjected to elevated levels of oxidative stress, resulting in increased susceptibility to degeneration.54 An alternative explanation for the macula‟s susceptibility may lie in the adjacent RPE/choroid, the anatomical location where the early histopathologic signs of degeneration are first recognised.54 Although not as striking as in the retina, there are significant differences between the macular and extramacular RPE/choroid.54 These include a substantially higher macular RPE cell density,57 smaller calibre and higher density of choroidal capillaries58 and a thinner and less dense elastic layer within Bruch‟s membrane.56. 2.3. Visual disturbances. Visual disturbances experienced by AMD sufferers can range from slight distortion of shapes and colours, to blind spots and large areas of vision loss, qualifying for legal blindness. These visual defects affect the central vision rather than the peripheral vision, though some AMD treatments such as laser therapy may sacrifice some peripheral vision in an attempt to preserve central vision.. 40.
(41) Figure 2. 5 a): An image as seen by an individual with normal healthy vision; b) An example of the visual distortion that may be experienced by an individual with AMD59. 41.
(42) 2.4. Classification and Nomenclature. The stages of AMD are categorised as early, in which visual symptoms are inconspicuous,60 and late, in which severe loss of vision is usual.48 Early AMD is characterised by drusen (described in the following section dealing with AMD subphenotypes) or by hyper-pigmentations or small hypo-pigmentations, without visible choroidal vessels.5 Seven out of eight people who develop sub-clinical AMD (early drusen) will not experience visual impairment and will not progress to late stage AMD. The one remaining person will progress to late stage AMD, but as yet it is difficult to predict when the progression will occur, what type of late stage symptoms will present, and to which person. Late stage AMD generally results in progressive visual distortion and loss of central vision, caused by retinal bleeds, drusen, and resulting central scotomas. A central scotoma is an area of depressed vision that corresponds with the point of fixation and interferes with central vision. Presence of a central scotoma suggests a lesion between the optic nerve head and the chiasm. Other more complex consequences of AMD can include thickening of Bruch‟s membrane and hypoxia due to drusen coverage. The. characteristic. late. stage. symptoms. (geographic. atrophy. and. choroidal. neovascularisation) that define each AMD subphenotype are quite different and distinctive, with drusen being the major overlapping symptom connecting the two. However, many individuals appear to have symptoms of both neovascular and atrophic AMD (sometimes even in the same eye) and numerous cases appear to be atrophic AMD yet later progress to 42.
(43) the neovascular form, and likewise with neovascular forms becoming atrophic.48 This interesting behaviour makes it difficult to elucidate the relationship between the two forms of AMD, and creates confusion over appropriate classifications to use when studying AMD.61 AMD symptoms can often resemble other retinal diseases and conditions (for example, ocular trauma, retinal detachment, high myopia, chorioretinal infective or inflammatory process, choroidal dystrophy, etc), and for this reason, AMD is a diagnosis of exclusion.5 Under superceded and less useful definitions, any AMD case that lacked choroidal neovascularisation would often be classified as atrophic AMD. Only some of these cases would progress to late stage atrophic AMD, while some developed neovascular AMD symptoms and would thus be reclassified. The new definition of subphenotypes classifies all cases with choroidal neovascularisation as neovascular AMD, geographic atrophy as atrophic AMD, and all remaining AMD cases as early AMD.62 In general, the nomenclature of AMD reflects some uncertainty surrounding the classification of the disease(s) and its various manifestations.3,. 13, 18, 19, 58, 63-68. The term. “Aging Macular Disorder” was coined because the word “degeneration” was thought to cause distress to many patients told of their diagnosis. Frequently, the term “Age-Related Maculopathy (ARM)” is used to refer to either all cases of AMD, or early stage (often subclinical) AMD.5 The extension of this term to “Age-Related Macular Degeneration (ARMD)” is usually used to describe late stage disease, involving geographic atrophy or choroidal neovascularisation and noticeable visual impairment. Another term that may be used for AMD in clinical settings is “senile macular degeneration”63 but this term is largely considered archaic and derogatory to the patients; thus it may be commonly found in 43.
(44) doctors‟ notes but rarely spoken. In this review I will refer to all forms of the disease as “AMD”, and will specify early/late stage, neovascular/atrophic subphenotypes, and other features as applicable.. 44.
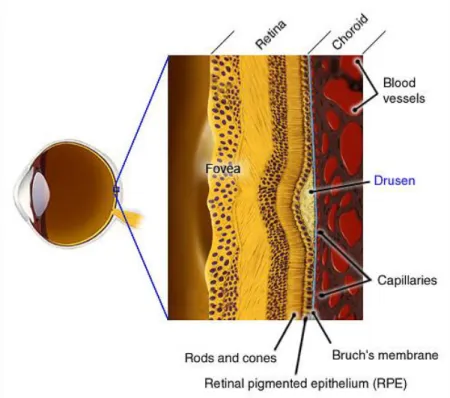
(45) 2.5. AMD Subphenotypes. 2.5.1. Early AMD. A clinical hallmark of early AMD is the presence of drusen, localised deposits of debris found between the basement membrane of the RPE and Bruch‟s epithelium in the layers of the retina.69 The origin of drusen has remained undetermined for over a century.70, 71 There is still disagreement as to whether drusen in the absence of other ocular abnormalities always point to early AMD.72,. 73. The debris is thought to be derived from the. photoreceptors (photoreceptor derived debris, or PDD).. Figure 2. 6: Cross section of the retina, displaying the location of drusen.1. 45.
(46) Figure 2. 7: a) Soft drusen as seen in colour fundus photography. b) Hard drusen as seen in colour fundus photography.74 Drusen are typically clustered in the central macula (Figure 2. 7).75 Early drusen appear as semi-translucent punctuate dots in retroillumination,75 only visible by ophthalmoscopy when their diameter exceeds 25µm.72 The larger the drusen, the greater area they cover, and the larger the areas of hyperpigmentation and hypopigmentation of the retinal pigment epithelium (RPE), the higher the risk of late AMD.8 Clinically, there are two main types of drusen; hard drusen and soft drusen. Hard drusen are considered to be normal hallmarks of age, while soft drusen tend to be indicative of AMD. The main morphologic distinction between hard and soft drusen is size; hard drusen are usually less than 63µm in diameter, while soft drusen are generally larger with indistinct edges. Hard drusen are pinpoint yellow-white spots. 75. which appear as window. defects on fluorescein angiography. Soft drusen have a tendency to become confluent as they grow larger, a distinctive feature setting soft drusen apart from hard drusen. In small numbers, hard drusen are not considered risk factors for the development of AMD,72 but numerous hard drusen are an independent risk factor for visual loss from 46.
(47) AMD.76 With increasing age, drusen can become calcified or filled with cholesterol, appearing crystalline or polychromatic.75 Extensive drusen can lead to more serious complications such as localised detachment of the RPE which causes significant vision loss and requires emergency surgery. Drusen are usually the earliest sign to appear in both atrophic and neovascular AMD. However, drusen are common in aging individuals, and the majority of those with drusen will not progress to late stage AMD. Small drusen may not noticeably affect vision and, as drusen develop relatively slowly, AMD is often not detected in the early phases. Most early cases of AMD are detected by optometrists often before the patient has noticed visual disturbance. There is currently no known effective treatment for drusen, largely due to their nature and location. Preventing their formation would be the most ideal option, but currently the most widely available therapeutic option, a vitamin supplement, can potentially offer a reduction in the rate of AMD progression.. 2.5.2. Atrophic AMD. Thinning of the retina, known as geographic atrophy (GA), is the defining hallmark of atrophic AMD. Technically, GA refers to confluent areas (defined as 175µm in minimum diameter) of retinal pigment epithelium (RPE) cell death accompanied by overlying photoreceptor atrophy.77 Often it develops in the parafoveal region, sparing the fovea until late in the disease, and is bilateral in more than half of the patients.7,. 77-81. Geographic. atrophy can develop in many situations; following the fading of drusen, in an area of RPE attenuation, following flattening of a RPE detachment, or involution of choroidal. 47.
(48) neovascularisation (CNV).75 The visible atrophy is usually accompanied by atrophic underlying choriocapillaris,82,. 83. and large areas of atrophy reveal underlying choroidal. blood vessels seen ophthalmoscopically or angiographically. Areas of geographic atrophy are characterised by diffuse, irregular patches of increased autofluorescence, which precede the development and enlargement of geographic atrophy.84 Historically, patients with GA were not considered to be at risk for developing CNV. However, Green et al. showed a 34% incidence of GA in a histopathologic study of patients with CNV.85 Geographic atrophy and CNV both tend to develop in patients with large drusen and pigmentary changes.86,. 87. CNV can sometimes conceal an atrophic process,. making it difficult to distinguish.75 GA leads to gradual progression of vision loss, most likely because photoreceptors overlying areas of RPE atrophy are metabolically dependant on RPE cells.75 Atrophic AMD and early AMD combined make up 90% of AMD cases.. Figure 2. 8: Geographic atrophy as seen in a colour fundus photograph of an atrophic AMD retina. 48.
(49) 2.5.3 Neovascular AMD The defining feature of neovascular AMD is CNV, the growth of new blood vessels in the choroid layer beneath the macula. The blood vessels not only distort the smooth surface of the retinal pigment epithelium, they also have a tendency to leak and bleed into subretinal layers and in extreme cases into the vitreous space. The subretinal presence of the vessels alone can often be sufficient to distort vision by creating irregularities in the smooth surface of the RPE above, especially when present beneath the fovea. Subretinal haemorrhages are often classified as emergency situations, as the bleeding can lead to acute and intractable blindness if not stemmed quickly. Neovascular AMD can cause rapid vision loss and potential complications such as retinal detachment and RPE tears. The aftermath of a haemorrhage often takes the form of a disciform scar.. Figure 2. 9: Cross section of wet AMD retina, showing location of CNV-related haemorrhage88. 49.
(50) Neovascular AMD is less common than atrophic and early AMD, accounting for only 10% of all AMD cases. However, neovascular AMD patients are often overrepresented at ophthalmic clinics due to the acuteness and relative severity of this subphenotype, accounting for 90% of AMD related legal blindness.. Figure 2. 10: A small haemorrhage as seen in colour fundus photography of a neovascular AMD retina.. 2.5.4. Bilateralism. The symptoms of AMD exhibit varying degrees of bilateralism, complicating the classification, diagnosis and treatment of the disease. The Blue Mountains Study. 89. produced a variety of statistics on the bilateralism of the study population‟s AMD signs. The percentage of bilateralism indicates, out of those with a particular subphenotype, the proportion of individuals who have that subphenotype in both eyes. Early (subclinical) AMD showed 80% bilateralism, while the clinical forms of AMD exhibited 57% bilateralism.89 The specific clinical signs ranged from high to low bilateral 50.
(51) prevalence; from reticular drusen and indistinct soft drusen at 91% and 79% bilateralism respectively, to hypopigmentation and hyperpigmentation at 28% and 38% respectively.89 The more severe late stage AMD symptoms of geographic atrophy and neovascularisation showed moderate levels of bilateralism at 56% and 40% repectively, along with distinct soft drusen at 47% bilateralism.89 Wang et al.89 found a consistent increase in bilateral occurrences with age for most lesions, and all lesions except soft drusen were found to be more bilateral in women, once the data were adjusted for confounding factors.89 There was also an observed increase in ageadjusted risk of AMD blindness in women, possibly due to the increased bilateralism of lesions in women.89 Finally, a reported family history of AMD was found more frequently amongst bilateral cases.89 Knowledge of bilateral tendencies is significant in understanding the aetiology of AMD and enabling more accurate classification of the subphenotypes. Furthermore, the ability to predict the likelihood of AMD lesions developing in a patient‟s presently unaffected eye is useful in determining the correct course of treatment and support required for that patient.. 2.6. Current Treatments for AMD. There is no known cure for AMD, and treatments currently available are focused on treatment/prevention of choroidal neovascularisation (CNV). Recently a greater public awareness of AMD has led to earlier presentation and diagnoses, providing the opportunity to reduce the chance of haemorrhage in CNV cases through preventative treatments. Two types of laser therapy are frequently used; a thermal laser can be used to cauterise and destroy the new blood vessels, while photodynamic therapy (PDT) involves the injection of 51.
(52) a chemical that becomes solid when hit with a laser, also destroying the blood vessels and stemming the leakage. A third type of treatment recently developed is the use of antivascular endothelial growth factor (anti-VEGF) injections. Anti-VEGF is thought to slow or prevent the growth of new blood vessels by antagonising the VEGF protein that is responsible for encouraging new blood vessel growth. These treatments are discussed in greater detail below. Prior to 1999, the only proven treatment for subfoveal exudation in AMD was thermal laser photocoagulation, which was advocated to stop the progression of vision loss in this disease.90, 91 Thermal laser coagulates new choroidal vessels at the cost of destroying the overlying sensory retina and creating an absolute central scotoma.90 In addition, a significant fraction of patients treated with thermal laser for neovascular AMD92 develop persistent or recurrent neovascularisation after laser photocoagulation,91 a regrettable trend which has been observed in subjects with high-risk drusen in several large randomised control trials.93, 94 Due to the undesirable collateral effects of the thermal laser treatment its use is currently limited to treating small extrafoveal CNV lesions. The need for a new CNV treatment approach was met first with photodynamic therapy (PDT) using verteporfin. This treatment is performed by injecting a photosensitizing dye (verteporfin) intravenously, followed by application of focused light to the area of subretinal neovascularisation under direct visualisation. Photodynamic therapy reduces the rate of visual loss in patients with subfoveal choroidal neovascularisation but does not lead to significant visual improvement in most individuals.95, 96 These limitations have led to the investigation of alternative treatment modes for subfoveal neovascular AMD, such as systemic interferon,97, 98 brachytherapy,99, 100 subfoveal membranectomy with and without 52.
Figure

+7


Related documents