Analysis of YouTube User Experience from Passive
Measurements
Giorgos Dimopoulos
Pere Barlet-Ros
Josep Sanju`as-Cuxart
Department of Computer Architecture UPC, Barcelonatech
{gd, pbarlet, jsanjuas}@ac.upc.edu
Abstract—In this paper, we analyze the YouTube service and
the traffic generated from its usage. The purpose of this study is to identify by strictly using passive measurements the information that can be used as metrics or indicators of the progress of individual video sessions and to estimate the impact of these metrics in the user experience. We find a novel method to track the progress of the video playback that, in contrast to previous works, does not require instrumentation of the video player neither browser-based plug-ins. Instead, we extract important statistical information about the status of the playback by reverse engineering the metrics in related HTTP requests that are generated during playback. For the purpose of collecting these metrics, a tool was developed to perform YouTube traffic measurements by means of passive network monitoring in a large university campus network. The analysis of the obtained data revealed the most important sources of initial delay in the sessions as well as buffer outage events and download rate statistics. Further analysis revealed the impact of video advertisements and re-buffering events on the user experience in terms of video abandonment rate.
I. INTRODUCTION
YouTube is not only the current dominant on-line video sharing provider, but also the 3rd most visited web site according to the website statistics collection service Alexa [1] and overall 30% of internet users visit it. In their own press release [2], YouTube claimed as of 2011 to serve more than 4 billion hours of video every month, while it hosts more than 200 million videos according to the number of assigned unique video IDs. As stated by the same source, the number of files has doubled since last year.
Moreover, YouTube is an ever-changing service where new features are constantly added in order to preserve its popularity and enhance the provided functionality. At the same time, in order to support its huge user base and bandwidth requirements the content is served by a growing global Content Distribution Network (CDN).
Since YouTube is both extremely popular and one of the services that consume most Internet bandwidth, its study has attracted the interest of the research community. Two reasons can be distinguished for this. First, researchers wish to understand how the CDN of YouTube is structured, given its enormous performance requirements. The details of YouTube’s CDN implementation are not public, but understanding its architecture can provide clues on how to massively distribute content over the Internet. Second, researchers wish to be able to measure the quality of the service as experienced by users
and understand which network parameters have an effect on it.
Moreover, network operators and Internet Service Providers (ISPs) are required to adapt to constantly increasing traffic demands by users and maintain an overall satisfactory level of Quality of Service (QoS). As a means to this end, it is critical for operators to be able to accurately evaluate how users and services utilize the network resources, in order to improve the performance of their infrastructure and provide long-term capacity planning. Likewise, ISPs are interested in identifying the applications their clients are using the most, in order to allocate the available bandwidth more efficiently and improve the quality of the services offered.
Hence, it is understandable that measurements related to the YouTube service are becoming a necessity for either researchers or network operators, as a way of retrieving information about the users’ experience when using YouTube and the network parameters that affect it. A first step to fulfill this objective is to create the appropriate tools for performing YouTube associated measurements.
In this paper we extract YouTube performance and user experience related metrics by means of passive network mea-surement methods. Although active approaches presented in previous works allow the measurement of more parameters and in more detail, they require modification or addition of client-side software and therefore the cooperation of end users. For this reason it is harder to collect representative measurements using these methods.
Although the methodology we propose is more challenging for extracting information, passive measurements will enable us to measure YouTube usage without interfering with users, which in turn makes it possible to collect statistics of a larger user base.
An important contribution of our approach is the discovery of the possibility to extract detailed information about user sessions from the statistical “s” requests, that will be presented in detail in the Methodology section. This allowed easier passive measurement of sessions and in more detail than previously done.
To the best of our knowledge, this is the first paper that introduces a passive measurements methodology as a means of obtaining statistical information about the YouTube video sessions. In addition, another aspect of this work that has not been addressed before in the past, is the study of the
advertisement videos that are introduced by YouTube in the beginning of some of the video sessions.
II. RELATEDWORK
In the related literature one can distinguish three main fields of study focused on online video services: video characteriza-tion, modeling of the infrastructure and user experience.
A. Video Characterization
Video Characterization refers to the process of identifying and categorizing videos according to their technical attributes, content or popularity, for the purpose of conveying information about them. The significance of this procedure, lies in under-standing the viewers’ preferences in terms of video quality and content, so as to evaluate current and future viewing patterns. In [4] and [5], traffic from university campuses was captured and processed in order to characterize usage patterns and local and global video popularity respectively. Other researchers have “crawled” YouTube to collect meta information [6] or gather video and social statistics [7]. As a result, they found that video popularity and user preferences have a great impact on local and remote networks. Therefore, different caching polices were proposed to handle the increasing traffic generated by YouTube.
B. Infrastructure
The YouTube infrastructure and server selection mecha-nisms have been put under the microscope by researchers, as well as the physical location of YouTube servers [8], [9]. Additionally, in [10] there is an analytical comparison among YouTube and other video sharing services via crawling the websites and measuring delays. In [11], there is a comparison between PC and mobile users of YouTube and how their behavior can be related to system performance degradation.
The conclusions derived in these papers agree on a load balancing mechanism that redirects YouTube users to preferred video servers in order to achieve a more uniform load distribu-tion in the system. Addidistribu-tionally, in cases where load balancing resulted in redirection to non-preferred servers, there were factors such as DNS server variation, lack of video availability in some servers and high server load due to popular video content.
C. User Experience
With respect to the research concerning the YouTube user experience, Mok et al. [12] approached user QoE through investigating network QoS metrics. The procedure followed here, included a customized Flash video player able to detect buffering events which are in consequence related to user experience.
A similar approach was followed in [13], where a custom browser-based plug-in was implemented to provide feedback about the videos’ buffering status and predict possible dis-ruptions in the playback due to buffer underflow events. In addition, the same authors [14], enhanced the aforementioned method for Wireless Mesh Network environments, with the
addition of an application to perform resource management tasks.
In [15] the Mean Opinion Score (MOS) scale was success-fully related to the occurrence of increased packet loss that resulted in re-buffering events during video playback. The MOS represents the average of the scores when rating the quality of a service on a scale of 1 to 5, where lower numbers indicate poorer experience.
Finally, in the work of Dobrian et al. [3], client-based tools in controlled lab settings where used to extract statistics for short and long Video on Demand (VoD) and for streaming video services. More specifically, user experience for different types of media content was evaluated in terms of quality metrics and content types.
The work done in the publications related to User Ex-perience is the most relevant to the one presented in this paper. Their results reveal that network QoS metrics such as Round Trip Time (RTT) and packet loss, may affect the buffering process of a YouTube video and therefore affect the user’s experience. More specifically, either by using the re-buffering frequency or the buffering ratio as performance metrics, researchers were able to derive MOS marks and link network QoS to user QoE.
Our work is mostly related to the work previously done on YouTube user experience. However, we differ from these papers for the reason that we do not rely on custom-made players or browser plug-ins to make measurements nor do we rely on controlled experiments performed in the lab. In contrast, we were able to extract all the important metrics for our study, under a real-life scenario, only from passively monitoring the related traffic in a network hosting thousands of users per day.
III. MEASUREMENTS
We distinguish two categories of measured variables in this section. In the first category we measure the different processes in the video server selection mechanism which are responsible for inserting delay in the video session. Each delay is measured by comparing the time-stamps of the related HTTP events as shown in Figure 1. In the second category we present the set of parameters that we extract directly from the HTTP requests containing statistical information and those that are inferred from the later with simple calculations.
Both sets of parameters are of high importance with regards to the QoE a user experiences. On one hand, the initial delays provide an insight into the time the user has to wait until the video session is initialized and the playback begins. Long delays are indicators of poor performance of the YouTube video delivery mechanism due to factors such as multiple re-directions and congestion of the servers, and strongly affect the perceived quality of experience for the user.
On the other hand, parameters from the HTTP traffic are ex-tracted throughout the entire duration of the video session and therefore can be used to monitor each part of a video session. Apart from returning important metadata about the video, they help us identify events such as stalls in the playback due to
buffer depletion, the download rate at which the video was delivered to the client as well as the percentage of the total video that was watched. Another significant parameter derived from the HTTP parameters is the Viewed Ratio. This metric is used to indicate the number of abandoned video sessions and at which point of the playback they were abandoned. It is strongly related to the viewer’s QoE given that users frustrated from poor performance tend to abandon their video sessions.
A. Initial Delays
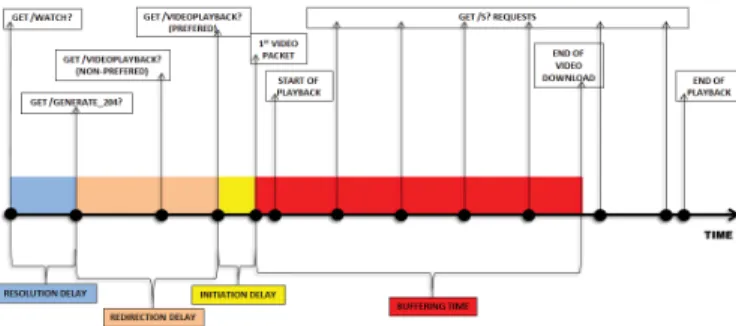
The first set of parameters that we measure, are those related to the delay introduced from the beginning of the video session, until the first video packet arrives at the client side. During this period, all the required elements of the web page are delivered to the user’s browser and at the same time the preferred video server is located. In order to identify the preferred video server, the load-balancing mechanisms of the YouTube CDN attempt to make the best selection among those servers that are closer to the viewer and are not suffering from high load. This process consists of three sub-processes, each responsible for introducing delay in the video session as shown in Figure 1.
The first part of the video server selection is the “Resolu-tion” phase that begins along with the video session by open-ing a YouTube video link and ends when the “generate 204” request is made. The “generate 204” is an HTTP GET request whose URI begins with the string “/generate 204?” and it is responsible for the DNS resolution of the video server. It is identical to the request that will be made in the next phase to get the video from the video server, with the difference that it returns a “204 No Content” from the server. This response indicates that the address of the video server was successfully resolved, however no video data will be delivered yet [11].
The following section of the video selection process corre-sponds to the “Redirection” phase. In this part, a “videoplay-back” request is generated by the browser to start downloading the video. If the server responds with a code “302 Found”, the requested video is located in this server but the client needs to be redirected to a more preferable server. At this point, multiple re-directions may occur until the best video server is located. If the server is the preferred, it responds with “200 OK” and the video will shortly start downloading.
The final phase that is responsible for generating delay in this process is the “Initiation” phase. This period marks the time required from the generation of “videoplayback” request to the preferred video server, until the arrival of the first video packet at the client side. The Initiation Delay that derives from this part, indicates the time that the server needs to process the request and start delivering the video.
Another important metric concerning the progress of a video session is the buffering time that corresponds to the time needed to deliver the entire video to the user. Until recently, it was possible to compare the buffering time with the duration of the video and infer buffer outage events that force the playback to halt in a re-buffering state until enough video data has been delivered in order to resume playback as done
in [3]. However, lately YouTube modified the mechanism of delivering video data. Currently, the video download is paused when the buffer holds enough data to continue playback and it resumes when the buffer is close to depletion. As a consequence, if a user pauses the video playback, then the video download will also pause as soon as the buffer is filled and will not resume unless the playback resumes. Hence, the duration of the video download does not correspond to the buffering time and therefore it cannot be used an indicator of re-buffering events.
Fig. 1: Important events in a video session
B. “S” Requests
Moreover, after the beginning of a video playback a plethora of HTTP events are generated to maintain and update the video session (or occasionally deliver advertisement content). The most intriguing of these events are the “s” GET HTTP requests that can be identified from the “/s?” marking the beginning of the request URI, followed by a long line of parameters and their corresponding values. They are generated on short intervals of a few seconds as soon as the playback begins, while the generation stops if the video is paused by the user. The “s” requests are made to servers under the “s.youtube.com” domain. This particular domain’s CNAME record points to the domain “video-stats.l.google.com” that is used Google (owner of YouTube), to collect statistical information from its services.
At this point due to the fact that neither YouTube nor previous studies have documented the meaning and usage of the parameters involved in the “s” requests, we proceeded to reverse engineer the Flash player object which automatically generates the aforementioned requests.
After reverse engineering and analyzing the player, we verified the statistical role of the parameters involved. Among those, the ones with the greatest significance for our study are the “bd” and “bt” that stand for bytes downloaded and bytes time. The bytes downloaded is the count of video data bytes the client received since the previous “s” request and the bytes time returns the time the later amount of bytes was required to be delivered. Therefore, from the ratio of these two parameters we can derive the download rate between the current “s” request and the previous one.
At this point it is worth to mention that to the best of our knowledge, the results obtained from reverse engineering the YouTube Flash player have not been published before.
Another two parameters that hold useful information are the “rt” that represents the time the “s” request was generated relative to the beginning of playback and “len” that indicates the duration of the video in seconds. By comparing the values of these variables we can infer whether the full length of a video was watched by the user or if it was abandoned earlier. We accomplish this by comparing the value of the last “rt” generated plus a timeout, against the length of the video. If the calculated value is smaller than the video length we conclude that the video was not watched to its entirety. In the other case, the complete video was watched.
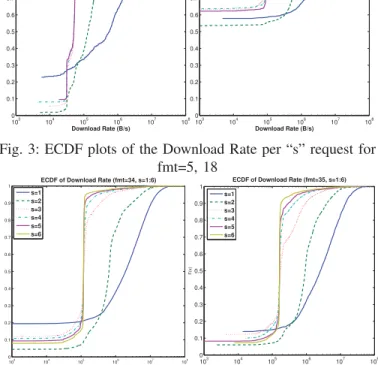
Moreover “fmt” is an in-URL parameter of the “s” requests, used to specify the quality of the watched video in the form of a numerical identifier. The value of “fmt” can either be constant within a video session or vary if the user selects a different video quality during playback. In Table I the most popular video formats in our data-set are displayed along with their characteristics. The “B/s” column indicates the bit-rate requirements of each format.
fmt Characteristics B/s fmt Characteristics B/s 5 240p FLV 40960 37 1080p MP4 792576 18 360p MP4 94208 43 360p WebM 118784 22 720p MP4 408576 44 480p WebM 163840 34 360p FLV 118784 46 1080p WebM n/a 35 480p FLV 163840
TABLE I: fmt identifier with corresponding video characteristics
The last of the statistical parameters examined in this work is the “pd” that corresponds to the player delay. The player delay is one of the most important variables identified during our analysis of YouTube traffic because it illustrates the time the playback was stalled due to re-buffering events throughout the video playback. Unlike the other aforementioned parame-ters that are returned every time an “s” request is generated, the player delay is only present if holds a non-zero value.
The importance of the player delay is clear since it provides us not only with information about the progress and perfor-mance of different parts of the video session but also with details about re-buffering events which are known to heavily influence user experience [15].
Finally, in this section we also define the Viewed Ratio parameter, as the ratio of the watched part of the video over the total duration of the video. To calculate the duration of the watched part of the video, we measure the time the last “s” request of the video session was generated through the value of “rt” and allow an additional time-out period of 10 seconds. If the calculated time is smaller than the video duration, then we conclude that the video was abandoned.
As the reader will observe, “s” requests can be used to extract very important parameters of YouTube video sessions. To our knowledge, this is the first work to reverse engineer these requests, which provide a simple mechanism to track YouTube sessions passively and accurately.
10−2 100 102 0 0.1 0.2 0.3 0.4 0.5 0.6 0.7 0.8 0.9 1 Delay (s) Initiation Delay Redirection Delay Resolution Delay
Fig. 2: ECDF plots of the Initiation, Redirection and Resolution Delays
IV. THE DATA SET
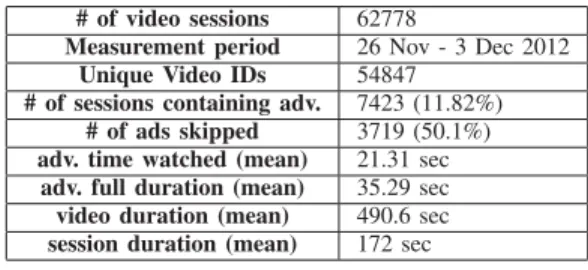
Our measurement scenario included seven continuous days of data collection from the campus network of UPC. The period of one week was selected in order to measure traffic under various time and day-of-the-week conditions such as network peak load periods. To perform the data collection, we developed a module able to identify and extract parameters related to YouTube traffic. The module was used as an exten-sion of the CoMo passive network measurement platform [17], which was in turn installed on a dedicated machine, capable of capturing all incoming and outgoing traffic from the campus network over a full-duplex Gigabit Ethernet link. In Table II we provide important metrics from the obtained data set, while more information on the network and the related traffic can be found in the work of Sanjuas-Cuxart et al. [16].
# of video sessions 62778
Measurement period 26 Nov - 3 Dec 2012
Unique Video IDs 54847
# of sessions containing adv. 7423 (11.82%)
# of ads skipped 3719 (50.1%)
adv. time watched (mean) 21.31 sec
adv. full duration (mean) 35.29 sec
video duration (mean) 490.6 sec
session duration (mean) 172 sec
TABLE II: Data set metrics
V. RESULTS
In this section we initially measure the different parameters that can have an impact on QoE and later we proceed to estimate their impact on the QoE perceived by the end user.
A. Initial Delays
In Figure 2 the empirical CDF plots of the three initial delays are depicted. In more detail, we can see that the Resolution Delay contributes the least in the total delay before the video playback start, as it is the smallest in magnitude.
Although there are some irregularities in the distribution of the Resolution Delay, the vast majority of its values are below 400 ms and approximately the 63% of all the values are lower than 90 ms. The variance that are observed around the 100 ms and 30 ms values can be associated with the different response and processing times presented by different video servers.
The distribution of the Initiation Delay shown on Figure 2, shows that 95% of the values are between 350 and 1100 ms. This distribution is more uniform than the previous and the overall variation of the values is the smallest among the three delays. Given that the Initiation Delay measures the time required to deliver the HTML code and different scripts from one server over a single TCP connection, the tight and uniform distribution of the Initiation Delay agrees with the fact that YouTube video pages share the same structure and are delivered from the same servers in a given geographical area.
On the other hand, the greatest contribution to the start-up delay comes from the Redirection Delay. This is attributed to some sessions suffering from many re-directions until the preferred video server is located. Each redirection that takes place may add a significant amount of delay to the particular part of the video session.
However this part of the session may also be further delayed from in-line video advertisements that are presented to the viewer before the beginning of the playback of the desired video. These advertisements are either non-skippable short clips with duration in the range of 10 seconds, or longer clips that can be skipped by the user after 4 seconds.
It is important to notice that the presented results concern-ing the Initiation delay are coherent with the correspondconcern-ing Processing Time that can be found in [11]. Additionally, the Redirection Delay is not equivalent but can be considered analogous to the Startup Latency in the same paper [11]. The ECDF plots of the two parameters are similar with the difference that Redirection Delay is overall larger. This can be attributed to the introduction of the advertisements in the video sessions in our data set, which heavily affect the Redirection Delay.
B. Download Rate
Figures 3 and 4 plot the empirical CDF of the Download Rate for four different video formats. In all the cases the 1st “s” request reports that the download rate has a high value, while in the following requests the download rate is reducing and after the 4th “s” request is converging to a certain value. These results indicate that YouTube is making use of a fast-start mechanism to fill as quickly as possible an initial buffer of large size. As soon as it is full, then the rate at which video data is sent to the browser gradually reduces, to reach to the minimum required download rate that will allow a smooth playback of a video with the given format. As mentioned earlier, the required data-rate for each format can be seen in Table I.
The fast fill of a larger initial buffer serves the purpose of initiating the playback as soon as possible, in order to
103 104 105 106 107 108 0 0.1 0.2 0.3 0.4 0.5 0.6 0.7 0.8 0.9 1 Download Rate (B/s) ECDF of Download Rate (fmt=5,s=1:5) s=1 s=2 s=3 s=4 s=5 103 104 105 106 107 108 0 0.1 0.2 0.3 0.4 0.5 0.6 0.7 0.8 0.9 1 Download Rate (B/s) ECDF of Download Rate (fmt=18, s=1:5) s=1
s=2 s=3 s=4 s=5
Fig. 3: ECDF plots of the Download Rate per “s” request for fmt=5, 18 103 104 105 106 107 108 0 0.1 0.2 0.3 0.4 0.5 0.6 0.7 0.8 0.9 1 Download Rate (B/s) ECDF of Download Rate (fmt=34, s=1:6) s=1 s=2 s=3 s=4 s=5 s=6 103 104 105 106 107 108 0 0.1 0.2 0.3 0.4 0.5 0.6 0.7 0.8 0.9 1 Download Rate (B/s) F(x)
ECDF of Download Rate (fmt=35, s=1:6) s=1 s=2 s=3 s=4 s=5 s=6
Fig. 4: ECDF plots of the Download Rate per “s” request for fmt=34, 35
reduce the initial delay and maintain playback in case of insufficient bandwidth at the client side. The second part of this mechanism limits the download rate to a minimum in order to minimize the unnecessary download video data in case the user skips a part of a video or aborts the video session.
C. Advertisements
Another important aspect of the YouTube video sessions are the video advertisements that are occasionally presented to the viewer before the playback of the requested video. Small advertisements with duration around 10 seconds cannot be skipped, while larger video ads allow the user to skip them after watching 4 seconds of content. Since the delivery of the advertisements occurs before the delivery of the requested video, they heavily affect the Redirection Delay when they are present. In our measurements with the parameter “Ad Du-ration” we calculate the time the advertisement was watched regardless to its duration so that we can accurately monitor how it affects the video session.
In Figure 5 we show the distribution of the ratio between the Ad Duration time and the Watched Video time. This ratio indi-cates the magnitude of the advertisement time compared to the video time. In the figure we observe that only approximately 12% of the video sessions included advertisement videos and there is a 2% where the advertisement lasted longer than the video playback.
10−3 10−2 10−1 100 101 0.9 0.91 0.92 0.93 0.94 0.95 0.96 0.97 0.98 0.99 1 Ad duration/Watched Video F(x)
Fig. 5: ECDF of the ratio between advertisement duration and video playback duration
D. Player Delay
In Figure 6 we present the distribution of the Player Delay Sum over the complete data-set and the distribution of the parameter per “s” request. The Player Delay Sum is calcu-lated from the addition of the individual Player Delay values introduced at each video session. The interesting observations in this figure, is the lack of Player Delay for the 73% of all the video sessions, while for the rest the values remain under 1 second with the exception of approximately 5% of the sessions. In the 5% of the video sessions with Player Delay over 1 second, the total delay can climb up to 60 seconds. To get a better insight of how the Player Delay evolves during the video playback, we investigated the values it takes per “s” request across all sessions. This information for the first 5 “s” requests of every video is shown in the ECDF plot in Figure 6. The selection of the first 5 requests gives us a view of the first one minute of video playback. In the plot we can see that the Player Delay takes larger values in the first few seconds of the playback and in the 2nd “s” request it reduces by a small amount. However, in the following 3 requests the sessions there is an increase in the sessions where Player Delay is zero and for the complementary sessions, the value of Player Delay is decreased significantly. The above findings illustrate that users are more likely to experience large delay due to buffer depletion within the first thirty seconds of playback.
E. QoE estimation
In this part we estimate the impact of the different metrics presented so far on the QoE of the user by measuring the abandoned video sessions. As mentioned in the Methodology section, the parameter that we have at our disposal for that purpose is the Viewed Ratio parameter which is calculated from the “rt” parameters of the “s” requests and the video duration. The plot in Figure 7 shows the ECDF plot of the Viewed Ratio Parameter. In this figure we can observe that only 40% of the video sessions in the data-set were completed and 40% where not watched over half of their duration. These
10−3 10−2 10−1 100 101 0.6 0.65 0.7 0.75 0.8 0.85 0.9 0.95 1
Player Delay Sum (s)
Total s=1 s=2 s=3 s=4 s=5
Fig. 6: ECDF of Player Delay Sum for the complete data-set and per “s” request
10−3 10−2 10−1 100 0 0.1 0.2 0.3 0.4 0.5 0.6 0.7 0.8 0.9 1 Viewed Ratio F(x)
Fig. 7: ECDF plot of Viewed Ratio
0 0.2 0.4 0.6 0.8 1 0 0.1 0.2 0.3 0.4 0.5 0.6 0.7 0.8 0.9 1
Viewed Ratio for 60 sec < Video Duration < 300 sec
ECDF
Resolution Delay < 0.2 sec 0.2 sec <= Resolution Delay < 0.8 sec Resolution Delay >= 0.8 sec
0.2 0.4 0.6 0.8 1 0 0.1 0.2 0.3 0.4 0.5 0.6 0.7 0.8 0.9 1
Viewed Ratio for 60 sec < = Video Duration < 300
ECDF
Redirection Delay < 0.5 sec 0.5 sec < Redirection Delay <= 10 sec Redirection Delay >= 10 sec
0 0.2 0.4 0.6 0.8 1 0 0.1 0.2 0.3 0.4 0.5 0.6 0.7 0.8 0.9 1
Viewed Ratio for 60 sec <= Video Duration < 300 sec
ECDF
Initiation Delay < 0.5 sec 0.5 sec <= Initiation Delay < 2 sec Inititation Delay >= 2 sec
results are similar to those presented in the corresponding section of [11].
It is necessary to point out that a user may not watch a video to its full length due to lack of interest for the content. However, we illustrate in this section that the Viewed Ratio is strongly affected by parameters that indicate delay, stalling of the playback and the existence of advertisements. Therefore, we show through our findings that the Viewed Ratio can be effectively used as a metric of users’ QoE.
10−0.5 10−0.3 10−0.1 0.1 0.2 0.3 0.4 0.5 0.6 0.7 0.8 0.9 1
Viewed Ratio for Video Duration <= 60 sec
ECDF pd < 0.5 sec 0.5 <= pd < 1 sec 1 <= pd < 2 sec pd >= 2 sec 10−1 100 0.2 0.3 0.4 0.5 0.6 0.7 0.8 0.9 1
Viewed Ratio for 60 < Video Duration <= 300 sec
ECDF pd < 0.5 sec 0.5 <= pd < 1 sec 1 <= pd < 2 sec pd >= 2 sec 10−3 10−2 10−1 100 0.1 0.2 0.3 0.4 0.5 0.6 0.7 0.8 0.9 1
Viewed Ratio for Video Duration >= 300 sec
ECDF
pd < 0.5 sec 0.5 <= pd < 1 sec 1 <= pd < 2 sec pd >= 2 sec
Fig. 9: ECDF plots of Viewed Ratio for i) small, ii) medium and iii) large videos with 4 classes of Player Delay in each
case.
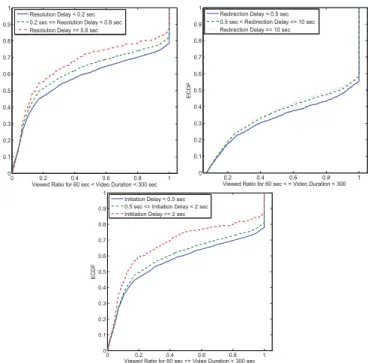
The three ECDF plots in Figure 8 show the relation of each of the initial delays with the Viewed Ratio. In each plot the corresponding delay is split into three classes in order to demonstrate how the Viewed Ratio is affected by the delay values in each class. In all three cases the diagrams indicate that when the respective delay is increasing the Viewed Ratio is decreasing. This means that users abandon sooner a video when they experience higher values of delay due to poorer QoE. Although in this figure we illustrate results for videos with medium length, the same observations can be made for larger or smaller video duration.
In Figure 9 we show three ECDF plots, one for small videos with duration smaller than 1 minute, one for medium duration between 1 and 5 minutes and one for large videos lasting more than 5 minutes. In all the plots we examine how the Viewed Ratio is affected with different values of the Player Delay. In particular we examine in all three plots the following four cases: a) the total Player Delay per session is smaller than 0.5 seconds, b) between 0.5 and 1 second, c) between 1 and 2 seconds and finally d) the total Player Delay is larger than 2 seconds. 10−4 10−3 10−2 10−1 100 0 0.1 0.2 0.3 0.4 0.5 0.6 0.7 0.8 0.9 1 Viewed Ratio ECDF Skipped Ads Not Skipped Ads
Fig. 10: ECDF of Viewed Ratio for sessions with skipped Ads and Not skipped Ads.
Similar observations can be made for all the graphs in Figure 9. When the Player Delay increases then the number of abandoned video sessions is also increasing and when the Player Delay is larger than 2 seconds the vast majority of the video sessions are not completed. Therefore, we can see a strong correlation between the delay during a video playback and the amount of video the viewers watch. When a video session suffers from larger Player Delay, more and longer stalls in the playback are taking place due to re-buffering events and therefore the user’s perceived QoE is degrading to a larger scale, causing the user to abandon the session earlier.
In order to investigate how the user’s QoE is affected by the existence of video advertisements in the beginning of a session, we plot Figure 10. Here, we only take into account video sessions with advertisements. From these videos we distinguish those where the advertisement was skipped and those that was not skipped. This information is derived from the comparison of the full duration of the ad video against the time the user watched the ad. We assume that shorter watched times than the actual duration of the ad correspond to skipped advertisements. Hence, from the ECDF plots of Figure 10 we conclude that users who did not or could not skip the advertisement video, abandoned the video session earlier while less users watched the entire video. The implication of the later observation is that sessions where the ads were not skipped, resulted in poorer QoE for the users and led them to eventually abandon the entire video session sooner.
When making an overall comparison of the figures presented in this subsection, we observe that from all the studied parameters the one with the greatest impact on Viewed Ratio is the Player Delay as can be seen in Figure 9. The increase of Player Delay is causing a much greater increase in video abandonment than the increase of initial delay or the intro-duction of non skipped ads. As a result, larger Player Delay during a video session can cause greater degradation of QoE than the other two cases. This is observation is logical due to the fact that Player Delay is linked to buffer depletion that in turn causes stalls during the playback and strongly affects the user’s experience.
VI. CONCLUSION
In this paper we studied the sub-processes of YouTube’s video delivery mechanism and identified the Redirection Delay as the greatest contributor in initial delay. Moreover, our main finding in this work are the “s” requests which are used by YouTube to transfer statistical information. The analysis of these requests, helped us conclude that there are parameters involved which can be used to extract important information about anomalies throughout the video playback, such as re-buffering events and abandonment rate that are strongly cor-related with the quality of experience of the user. In addition, we measured the impact that advertisement videos have on the initial delay and the video abandonment rate and showed that users are more likely to abort a video when the advertisements are not skipped. Finally, from our study we concluded that the Player Delay is the parameter with the highest impact on the user’s perceived QoE that eventually causes viewers to abandon the watched videos.
VII. ACKNOWLEDGMENTS
The work presented here was supported by the Spanish Ministry of Economy and Competitiveness under contract TEC2011-27474 (NOMADS project) and by theComissionat per a Universitats i Recerca del DIUE de la Generalitat de
Catalunya (ref. 2009SGR-1140). The authors would also like
to thank Dr. Konstantina Papagiannaki and Telefonica I+D for their valuable insights and contributions on this work.
REFERENCES [1] ”http://www.alexa.com”
[2] ”http://www.youtube.com/t/press statistics”
[3] Dobrian, F., Awan, A., Joseph, D., Ganjam, A., Zhan, J., Sekar, V., Stoica, I., et al. (2011). Understanding the impact of video quality on user engagement. Proceedings of the ACM SIGCOMM 2011 conference on SIGCOMM (pp. 362373). ACM. Retrieved from http://www.cs.berkeley.edu/ sekar/papers/comm254-dobrian.pdf [4] Gill, P., Arlitt, M., & Li, Z. (2007). Youtube traffic characterization: a
view from the edge. Proceedings of the 7th ACM SIGCOMM. Retrieved from http://dl.acm.org/citation.cfm?id=1298310
[5] Zink, M., Suh, K., Gu, Y., & Kurose, J. (2009). Characteris-tics of YouTube network traffic at a campus network Measure-ments, models, and implications. Computer Networks, 53(4), 501514. doi:10.1016/j.comnet.2008.09.022
[6] Cha, M., Kwak, H., Rodriguez, P., Ahn, Y. Y., & Moon, S. (2007). I tube, you tube, everybody tubes: analyzing the worlds largest user gen-erated content video system. Proceedings of the 7th ACM SIGCOMM conference on Internet measurement (pp. 114). ACM. Retrieved from http://dl.acm.org/citation.cfm?id=1298306.1298309
[7] Cheng, X., Dale, C., & Liu, J. (2008). Statistics and social network of youtube videos. Quality of Service, 2008. IWQoS 2008. 16th Interna-tional Workshop on (pp. 229238). Ieee.
[8] Adhikari, V. K., Jain, S., & Zhang, Z. L. (2010). YouTube traffic dynamics and its interplay with a tier-1 ISP: An ISP perspective. Proceedings of the 10th annual conference on Internet measurement (pp. 431443). ACM.
[9] Torres, R., Finamore, A., Kim, J. R., Mellia, M., Munafo, M. M., & Rao, S. (2011). Dissecting Video Server Selection Strategies in the YouTube CDN. Distributed Computing Systems (ICDCS), 2011 31st International Conference on (pp. 248257). IEEE.
[10] Saxena, M., & Sharan, U. (2008). Analyzing video services in web 2.0: a global perspective. Support for Digital Audio and Video, 05. [11] Finamore, A., Mellia, M., Munafo, M., Torres, R., & Rao, S. (2011).
YouTube Everywhere: Impact of Device and Infrastructure Synergies on User Experience. Electrical Engineering.
[12] Mok, R., Chan, E., & Chang, R. (2011). Measuring the quality of experience of HTTP video streaming. Proc. IEEE/IFIP IM (pre-conf.) (Vol. 1).
[13] Staehle, B., Hirth, M., Pries, R., & Wamser, F. (2010). YoMo: A YouTube Application Comfort Monitoring Tool. Outlook.
[14] Staehle, B., Hirth, M., & Pries, R. (2011). Aquarema in action: Im-proving the YouTube QoE in wireless mesh networks. (BCFIC Riga), 2011.
[15] Gustafsson, J., Heikkila, G., & Pettersson, M. (2008). Measuring mul-timedia quality in mobile networks with an objective parametric model. Image Processing, 2008. ICIP 2008. 15th IEEE International Conference on (pp. 405408). IEEE.
[16] Sanjus-Cuxart, J. (2012). Measurement based analysis of one-click file hosting services. Journal of Network and Systems Management 20(2), June 2012.
[17] Barlet-Ros, P., Iannaccone, G., Sanju‘ as-Cuxart, J., Amores-L opez, D., Sol 25 e-Pareta, J.: Load shedding in network monitoring applications. In: Proceedings of USENIX Annual Technical Conference, pp. 5972.In Proc. of USENIX Annual Technical Conf. (ATC), Santa Clara, USA, June 2007.