Simon Cole is the founding partner of the corporate reputation and branding consultancy Reputation Dividend (www.
reputationdividend.com).
The Impact of Reputation
on Market Value
Simon Cole
Introduction
Investors like to think of themselves as fundamentally objective, making decisions based on hard facts and rigorous analysis. Whether operating in major financial institutions with responsibility for assets running into bil-lions or managing more modest personal savings, their investment choices are inevitably informed by the ever increasing plethora of readily acces-sible information, hard data and market indicators. or are they? While equity analysts may appear to take a very rational approach to calculating investment potential, their work is often undermined by a failure to take proper account of the impact of the less tangible assets such as patents, customer lists, copyrights, know how, collaboration activities, brands and the like.
one of the most familiar, but least understood, intangible assets is a firm’s reputation. For far too long the combination of limited understand-ing and lack of tools to measure
it has resulted in the somewhat schizophrenic attitude that’s dis-played towards it. Investors will
readily agree that a company’s reputation has a real and sometimes con-siderable bearing on its value, but they will struggle to put a figure on
One of the most familiar, but least understood, intangible assets is a firm’s reputation.
just how much. The question is often dismissed under the amorphous banner of market ‘sentiment’ or bundled up into the equally vague catch all of ‘goodwill’ to explain why equity prices trade above net asset value. As a result value based assessments of companies’ reputations have been ignored on the grounds that ‘if you can’t measure it you can’t account for it’.
But, as Black and carnes (2000) argued, corporate reputation ‘should have value to the investor since it results in financial benefits to the cor-poration’. Benefits which, they explained, include reducing the mobility of rivals, supporting premium prices and enhancing access to capital. They went on to demonstrate that corporate reputation contributes to a firm’s value but they stopped some way short of identifying ‘a method for evaluating and measuring, in dollar terms, an individual firm’s reputa-tion’.
Something had to change. The volume of shareholder value tied up under the loose banner of ‘intangibles’ has grown inexorably in the last few decades to the point where by the start of 2012 tangible book or net asset value only accounted for around 49% of the total market capitalisa-tion of companies in the S&P500 and 55% of the FTSE100. Earnings expectations based on analysts’ consensus forecasts of future earnings growth and predicted dividend pay-out ratios help account for some of the difference, but the bulk of the remainder is a function of the intangibles, identifiable and unidentifiable, of which a considerable portion comes back to the brands and their outward manifestation, the corporate reputa-tions of the firms whose equity is traded.
The sheer scale of this ‘intangible’ value creates a variety of problems for investors. First, it reduces the veracity of their value modelling and calculations. Second, it limits their ability to take a suitably measured account of reputation events – actions that may materially affect a com-pany’s reputation and thus value. Third, and arguably most importantly, it inhibits reputation owners (i.e. the companies themselves), from manag-ing the asset in a truly objective and properly strategic manner that could realistically be described as ‘reputation value management’.
Resolving these and many related issues required a fundamentally new approach to interpreting how investors consume non-financial data to judge and ultimately determine the value of the companies they’re buying into. The role of reputation as a lens through which the more traditional
financial metrics are assessed, analysed and adjusted where necessary, had to be better understood. Then, and only then, can all the spin and dark arts that lie behind corporate reputation and its management be deployed as it should to the advantage of shareholder value as a whole.
Background
The idea that a brand or, more accurately, the ‘thoughts, feelings and impressions’ associated with the entity it represents, has tangible economic
value goes back to before the Second World War. John Stuart, the legend -ary cEo of the American company Quaker and one of the early adopters of the notion of brand, is alleged to have said, ‘If this business were split up, I would give you the land and bricks and mortar, and I would take the brands and trademarks, and I would fare better than you.’ The idea was understood conceptually but it wasn’t till some time later that techniques to measure brand value with any certainty finally emerged.
In the late 1980s the FTSE-listed Rank Hovis mcDougall (RHm) in the UK became the target of an aggressive take-over bid from the Australian food producer Goodman Fielder Wattie (GFW) who were look-ing to acquire them for a sum which the RHm board believed significantly understated the company’s value. As part of their defence RHm worked with london-based consultants Interbrand to develop a means to assess the value of the operating brands that would support a higher valuation. The approach they came up with was based around a calculation of the net present value of forecast earnings attributable to the brand (or more accurately perhaps, to its ‘reputation’) through its influence on customer choice. This became known as the ‘economic use’ method and grew to become the standard for brand valuation analyses around the world. more importantly for RHm however, the valuations of a raft of long standing and much loved brands including the likes of Hovis, Bisto and mr Kipling cakes helped to demonstrate that the GFW bid seriously undervalued the company and they were able to see off the challenge.
Before long the economic use approach to calculating brand value along with number of derivatives became widely used by a growing industry of valuation consultants, and the idea that brands have identifiable economic value became generally accepted. Brand management as a science made a big step forward and, instead of having to rely on the intuitive faith of
the brand and marketing professionals, brand owners found themselves in a position where they could adopt a far more objective, measurable and generally accountable approach to developing their charges.
Usage and application of the thinking connecting brands to their eco-nomic value soon extended into the conservative world of the accounting
profession. Although initially uncom-fortable, accounting authorities around the world came round in time and, while stopping short of advocating that brands belonged on the balance sheet, began to incorporate evidence attest-ing to their value into their wider analyses, commentaries and corporate reporting .
The current position is set out in the accounting standards (IFRS 3;1
SFAS 1412) which require companies to break down in more detail what
was historically called goodwill arising from the premium paid over the net value of a firm and its assets including brands in an acquisition. The accounting standard requires a company to conduct an annual ‘impair-ment’ test to see if the current value of an acquired asset remains as it was or has fallen below the carrying cost, but there is no requirement that assets be tested for an accretion possibility. Any increase in value arising from improvements in the value of brands acquired or enhanced reputa-tion remains ignored in the accounts. Furthermore, brands that a company developed itself or which it acquired prior to 2001 when the standard was introduced are not considered to be assets. These issues are still subject to debate.
In time, the notion of brands as economic assets became widely established and applied in ways that took brand management thinking into applications including tax management, legal disputes and debt securitization, to name just three. more recently, the processes by which brands are valued was ‘formalised’ in 2010 in the ISo (International organisation for Standardization) standard no. 10668. This sought to
1 International Financial Reporting Standard (IFRS) 3 has the objective of enhancing the relevance, reliability and comparability of the information that a reporting entity provides in its financial statements about a business combination and its effects. See http://www.ifrs.org/nR/rdonlyres/B0B3243F-A1cE-4727-8B2A-E1B11D463c3E/0/IFRS3.pdf.
2 Statements of Financial Accounting Standards (SFAS) 141 is a US standard which also addresses financial accounting and reporting for business combinations. See http://www.fasb.org/summary/stsum141.shtml.
The thinking connecting brands to their economic value soon extended into the conservative world of the accounting profession.
institutionalise existing thinking by laying down a) ‘requirements for procedures and methods of monetary brand value measurement’, b) ‘a framework for brand valuation, including objectives, bases of valuation, approaches to valuation, methods of valuation and sourcing of quality data and assumptions’ and c) ‘methods for reporting the results of such valuation’.
The idea of brands as economic assets had arrived and up to a point everything worked well. The thinking, however, still lagged behind the debates held in commercial organisations and marketing circles where attention had turned towards the corporate brand or reputation whose importance as a driver of sustainable competitive advantage creating bar-riers to entry had been recognised for some time by industrial economists. Spence (1974) suggested that reputation is part of a market-signalling process by which firms communicate relevant characteristics to customers and other stakeholders to maximize status. A similar approach was taken by caves and Porter (1977). The entry barrier effect would lift the rate of return of companies with strong reputations above the opportunity cost of capital and thus enhance their market value.
Ironically, corporate brand wasn’t covered by the original thinking developed by RHm and their advisers Interbrand when they set the ball rolling in the late 1980s. The notion of the brand was restricted to
its role in influencing customers to buy what are by definition branded
goods or services. The underlying theory argued that a brand creates value through its ability to guide customer choice at the point of trans-action; securing decisions to choose over alternatives and/ or realising higher prices through lowering price elasticities. While that might allow for some influence of the ‘corporate brand’, i.e. thoughts, feelings and
impressions of the company or organisation behind the product or service,
any influence is forced to manifest through the operating brand and then only as a part of the wider story. But more often than not, it was missed entirely.
This shortcoming is especially apparent in the case of pure-play corpo-rate brands, i.e. those that do not feature in any customer transaction such as a Procter & Gamble, a Unilever or a Diageo. ‘Traditional’ brand valuation techniques imply that they have no economic value in and of themselves. Analyses might well find value in for example a raft of Diageo’s product
and so on, but because none of them are branded ‘Diageo’ it cannot be said to contribute to the individual brand equities and therefore have any material impact on customer choice. As a result no economic earnings could be attributed to it and its economic value is defaulted to zero.
clearly, this is not the case. Diageo, like a host of pure-play corporate brands, is by any measure a global blue chip. It’s listed on a number of stock markets around the world including london and new York and there are well established research studies that testify to the fact that it commands a suitably well rated corporate reputation, e.g. Reputation Institute’s ‘Global RepTrak’ study. This all serves to underline the fact that not only do corporate brands ‘mean something’ and thus exert influ-ence, but that the issue is to do with the analysis techniques not being equipped to identify it rather than it not existing.
In order to resolve the issue, brand owners need to take a wider per-spective on how brands, and in particular corporate brands and the repu-tations they inform, create value. Traditional thinking that treats brand value as manifesting solely from ‘customers’ is flawed. Brands create value in a number of ways and through their influence on a variety of different stakeholders, and if the assets are to be managed comprehensively the thinking needs to reflect this.
A fresh approach
The failure of ‘traditional’ brand valuation techniques to account for corporate brands stems from shortcomings with the underlying theory which is founded on the notion that brands influence transactions when the customer makes a decision based on assessments at the time. The benefits are weighed up, a price is accepted, and the trans-action is completed. The brand therefore creates value for the brand owner by adding to the utility of the goods or services and/or facilitating individual drivers of choice. Brand transactions in the corporate space, however, are somewhat dif-ferent. The principal source of value creation derives from investors rather than from customers, and the means by which it’s delivered is quite distinct. Investors buy or hold a company’s stock on the basis
The principal source of value creation for corporate brands derives from investors rather than customers.
of the economic returns they expect to generate from either capital growth or future dividends and will sell it if they believe they can achieve better returns elsewhere. The transaction is to all intents and purposes under constant review as prices move in response to market activity and as new information about aspects of the firm’s performance becomes available.
This is the process that must be analysed to reveal the impact and, ultimately, the economic value of corporate reputation. new information, intelligence and insight will be filtered through the body of extant impres-sions that add up to the company’s reputation, and any changes may add to or detract from it. As a result, investor confidence that the company will produce the economic returns expected becomes inflated or deflated and, assuming an appropriately liquid market in the company’s stock, will flow through to increase or decrease the share price.
Calculating company reputation value
Individual company reputation values were calculated by modelling the influences on investor behaviour impacting on share price. The approach was developed with four considerations in mind:
1. That the model of investor behaviour should be empirical and based on experience and observation rather than theory alone.
2. That the model should not be constrained or fixed to include corporate reputation. Rather, that any impact would be determined in the course of the analysis. As such all the input variables were treated with equal weight, and reputation allowed to emerge from the process if it was found to have a role.
3. That the model should operate at an individual company level. That it should be built to explain specific influences and reputation events rather than macroeconomic factors affecting the stock market as a whole. 4. That the model should be quantitative. The plethora of appropriate
data suggested that a statistical regression analysis approach could well be valid. moreover the nature of the audience the model was being developed for, financial analysts, investor relations and corporate com-munications professionals and arguably the wider investment commu-nity demanded it.
The modelling comprised four stages: a. Designing the framework for analysis
The underlying hypothesis was that a company’s market capitalisation could be explained by a combination of variables including financial metrics and corporate reputation. The companies in question were by definition publicly quoted and listed on major stock markets. Regression analysis was used to test the hypothesis and specify the model’s form.
The process began with the definition of the ‘wide’ set of potential explanatory variables. These were developed via a small scale, explora-tory research exercise. Eighteen qualitative interviews were conducted with a selected group of buy and sell side investment analysts working with major investment banks, fund managers, and agency and client side investor relations professionals.
The interviews elicited the principal metrics and indicators used along with wider factors or influences that were having a bearing on the deliberations of investment professionals as a whole.
b. Data capture and cleaning
The financial data were sourced from Factset and Bloomberg, two of the world’s leading providers of financial information and analytics. The data comprised reported and consensus forecasts from relevant industry analysts including:
– EBITDA and EBIT – EPS
– Return on Assets – Dividend yield
– Beta – company and sector – Assets
– liabilities
– Earnings per share – Stock liquidity
– IcB (Industry classification Benchmark, the internationally accepted system for categorizing companies and securities on a consistent and worldwide basis).
The reputation data were derived from the Most Admired Companies
studies published by Management Today in the UK and Fortune in the
US. Both of these are based on survey research studies conducted (entirely separately) among samples of c-suite individuals (senior and board level executives including ‘chief executive officers’, ‘chief com-munications officers’, ‘chief financial officers’, etc.) from many of the largest public companies in each market along with selected investment analysts and business journalists.3
Although by no means perfect the studies are widely judged to be authoritative and they boast track records of consistency going back more than 20 years. most importantly however, they are, unlike any other syndicated study of corporate reputation, polling the impressions of ‘professional observers’, i.e. people who have a view of the business overall, not just its products or services. These people represent a close proxy for the investment community and as such can reasonably be judged to reflect investor sentiment. other studies tend to focus on the views of ‘consumers’ which, while relevant to more traditional brand valuation metrics, offer little to help understand pure-play corporate reputation.
The Most Admired studies capture perceptions of a broadly compre-hensive set of factors judged to be among the principal components of corporate reputation. These constitute the basic make up of each company’s reputation and are presented in the form of quantitative measures of the ‘strength’ of perceptions of the following dimensions: – Quality of management
– Innovation
– Quality of goods/products and services
– community & environmental responsibility (UK)/Social responsibil-ity (US)
– Financial soundness
– long-term investment value – Use of corporate assets – Ability to attract talent (UK) – People management (US)
3 While the individual measures are broadly consistent across the two studies, there are some differences (as indicated).
– Quality of marketing (UK) – Global competitiveness (US).
measures of the overall ‘strength’ of a company’s reputation were derived from a simple average of the ratings of the nine component parts.
Prior to any statistical analysis the data was cleaned and consolidated. This involved excluding a) companies that were either private or listed outside of the relevant jurisdictions (the UK or the US) and b) compa-nies for which the financial data was in any way incomplete. It may have been possible to import data from alternative measures to complete missing values in some instances, however, this was not pursued on the grounds that it could introduce distortion from source inconsistencies.
The net result was a core data set of close to 180 companies in the UK and 320 in the US.
c. Statistical analysis
The initial phase of the modelling concentrated on ‘general’ inves-tor behaviour. It was designed to achieve three ends: to determine if reputation could, in fact, be identified as one of the primary drivers of market capitalisation; to establish the extent of any influence along with that of any other explanatory variables; to account for the influence of reputation as a whole and through its main component parts.
Raw data was tested for independence using simple correlation analysis. Variables exhibiting any signs of an association with market capitalisation were designated possible response variables and priori-tised. Variables showing high levels of significant correlation with each other were consolidated or removed.
Regression analysis was then applied to explore relationships between possible explanatories and the response variable and to identify any requirements for additional variable transformation and/or compound-ing.
The model was built from two directions using a combination of forward selection and stepwise regression. First, starting with the full set of potential explanatories and removing the least significant one at a time until a suitably robust solution was achieved. Second, building up the model one variable at a time beginning with the explanatories
showing the highest degree of correlation with market capitalisation supplemented with those showing the greatest correlation with residu-als as the build progressed.
This stage of the process was also used to identify ‘missing’ variables, i.e. ones that had not been included as ‘possible’ factors in the initial run. For example, it became apparent early on in the build (in the UK model development) that there was a systemic issue related to company size or more accurately, whether it was FTSE100 or FTSE250. This reflected the fact that not only are the investor profiles different (as a result of the impact of investment funds and other institutional inves-tors with index driven exposure requirements) but also that the larger index tends to relate more to global or international activity while the lesser one is more UK centric.
The resultant ‘best’ model form was tested for:
– common sense – whether or not the signs of the coefficients make sense. For example, does the model imply a greater market cap for higher levels of expected earnings, etc.
– Residual randomness – whether or not the residuals fall within an acceptable range and are sufficiently randomly distributed.
– Goodness of fit – whether or not the model explains a satisfactory degree of the variation in market capitalisation.
– Significance – whether or not the significance of the individual vari-ables was within acceptable bounds.
once the general model had been established, regression analysis was applied to develop a more granular, ‘second order’ model. This took the analysis beyond the empirical work
described by Schwaiger (2004) which explored the idea that the investment community does not see and value rep-utation in a one-dimensional temporal
sense but, rather, a two-dimensional one in which reputation is divided into affective (sympathy) and cognitive (competence) components. This allowed for richer models that demonstrate the negative trade-offs that exist between measures aimed at enhancing a firm’s reputation in terms of corporate responsibility at the expense of short-term performance.
The investment
community does not see and value reputation in a one-dimensional sense.
For this, reputation was introduced into the analysis at the level of its nine component parts. modelling used the general form as the frame-work and re-ran the regression substituting the individual measures for the overall rating. This identified which of the nine factors were most influential along with their relative impact.
Following successful completion of the model based on UK listed companies at the end of 2007, the process was repeated annually until the most recent iteration relating to the end of 2011/start of 2012. The stability of results – using entirely new data sets each year – led to the analysis being repeated for US listed companies. The basis for this was the notion that the underlying hypothesis was not country specific and so should hold in any developed equity market. In short, that equity investors behave in a broadly similar fashion throughout the devel-oped world. The analysis completed for five separate years using US listed companies and reputation data from an entirely different source,
namely Fortune’s World’s Most Admired Companies. The results relating
to the model form were entirely consistent thereby providing further evidence as to its general veracity.
d. Individual company analyses
The final stage of the analysis saw the model applied to calculate a combination of reputation orientated metrics for each of the companies in the database.
Predicted values of the market capitalizations of each company were calculated and from that a series of leading indicator outputs produced. They included:
– Reputation Contribution – the proportion of a company’s market cap attributable to its reputation. The primary measure of reputation value.
– Reputation Leverage – the extent of the return that can be expected from a specific increase in overall reputation strength (expressed in terms of increased market cap).
– Reputation Risk Profile – on the basis that extant reputation value is by definition value at risk, i.e. it can disappear without appro-priate support, the Reputation Risk Profile spells out how it is distributed between its individual components. In short, it details
the scale of reputation value resident in each component of the company’s reputation.
Results
Corporate reputation is a powerful driver of shareholder return
The implications of the analysis were clear. company reputations are, as many already believe, real, present and often very substantial assets. Their presence is considerable in both the UK and the US where they rank among the most important repositories of value for listed companies.
As of 1 January 2012 they accounted for close to 26% of the total market
capitalization of the S&P500, US$3,190bn of shareholder value. At the same time they were delivering US$770bn of value across the FTSE100 and US$67bn across the FTSE250.
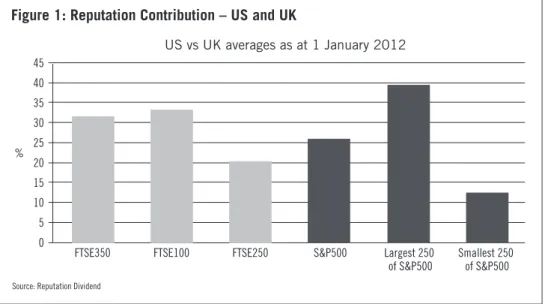
Reputation contribution, the proportion of a company’s market capitali-sation attributable to its reputation, varies by company size and not sur-prisingly given human nature and a tendency to generalise, is often higher for larger companies. In crude terms it would appear that even the hardest nosed investors infer some degree of ‘success’ from size and in that are perhaps prepared to consign an amount of judgement to the preconceived thoughts and impressions that are by definition reputation.
US vs UK averages as at 1 January 2012
%
Figure 1: Reputation Contribution – US and UK
Source: Reputation Dividend
0 5 10 15 20 25 30 35 40 45
FTSE350 FTSE100 FTSE250 S&P500 Largest 250
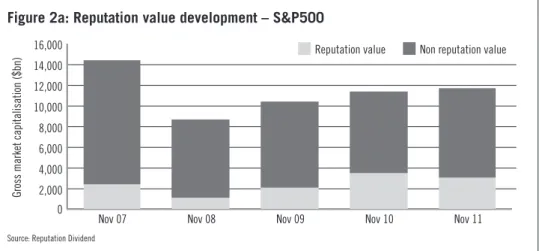
The value of reputation, like any investment, can rise as well as fall
The importance of reputation is evidenced by the part it played in sup-porting corporate value through the economic downturn that started in 2008. Although average Reputation contributions were relatively subdued as nervousness began and investors looked harder at the more tangible evidence, they grew since then as a consequence of the wider flight to safety. Well managed corporate reputations provide an important reassurance for investors and help to mitigate concerns over deteriorating corporate earnings. Reputation therefore is a useful leading indicator of investment risk.
Gross market capitalisation ($bn)
Figure 2a: Reputation value development – S&P500
2,000 0 4,000 6,000 8,000 10,000 12,000 14,000 16,000
Nov 07 Nov 08 Nov 09 Nov 10 Nov 11
Reputation value Non reputation value
Source: Reputation Dividend
Gross market capitalisation ($bn)
Figure 2b: Reputation value development – FTSE100
0
Nov 07 Nov 08 Nov 09 Nov 10 Nov 11
Reputation value Non reputation value
Source: Reputation Dividend
500 1,000 1,500 2,000 2,500 3,000
While the underlying trends in the US and UK have been broadly con-sistent for the last five years, there were signs of a growing divergence in 2011. Although the total market capitalization in the S&P500 ended the year up by 2%, the average Reputation contribution was down by 4% points. As a result the index closed the year some US$440bn lower than it might have. clearly, the cost of failing to maintain reputation value can be considerable.
By contrast the average Reputation contribution in the FTSE100 grew steadily through the downturn and offset pressure from weaker or declining financials. The combination of European austerity and less optimism for ‘green shoots’ focused the attention of the investment com-munity and encouraged continued reputation support. As a result the average Reputation contribution was 2% points higher and shareholder value across the index US$35bn ahead of where it might have been. The rewards of a healthy reputation can be substantial.
Reputation returns vary from company to company
The value of individual corporate reputations varies considerably. There are winners and there are losers. Across the 410 leading US and UK com-panies tracked at the start of 2012, as a whole they ranged from a height of close to 58% (Apple) to a low of –39% (Sears Holdings). In most cases, 91% of companies, reputation is having a positive impact and creating shareholder value. In the remaining 9% it is destroying value.
As a group, the 25 companies with the highest Reputation contributions at the start of 2012 were benefitting to the tune of US$1,707bn (see Table 1).
conversely, shareholders of the 25 companies with the lowest Reputation contributions were down US$16bn as a result of those companies’ reputa-tion weaknesses (see Table 2).
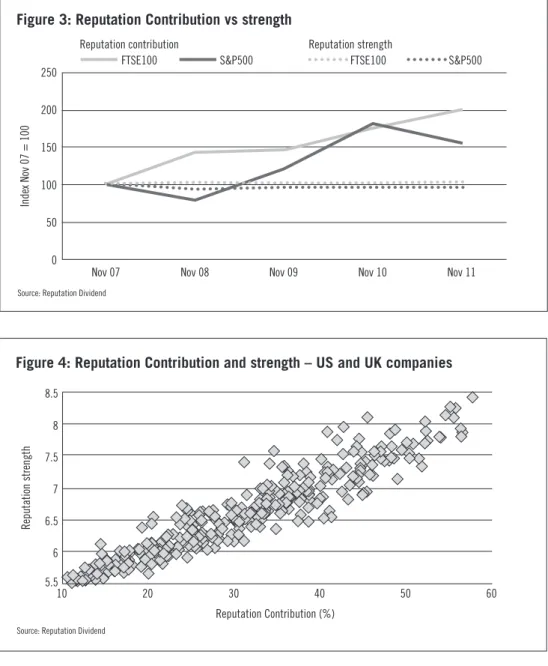
UK and US companies have in large part been successful in lev-eraging their reputation assets through the downturn. However, the evidence suggests that FTSE100 companies have been more effective and indeed consistent than their US peers. After the initial shock of lehmanns in September 2008 when questions were being asked of even the most blue chip companies, growth in reputation contributions in S&P500 companies fell behind and only caught up with their UK counterparts in 2010. Since then US companies have lost some of those
gains as the potency of their assets declined. It would appear that con-fronted with a growing optimism for improving financials reputation, owners took their eyes off the ball and were punished by the markets accordingly (see Figure 3).
Reputation value is driven by more than strength alone
critically, Reputation contributions have changed regardless of any signif-icant movement in the overall strength of the corporate reputations. While the average Reputation contribution in the FTSE100 doubled in the four years to 2011 and increased by half in the S&P500, the average strength
Table 1: Reputation Contribution 2012 – the leaders
The top 25 Jurisdiction Reputation Contribution (%) (US$m at 2 Jan 2012)Reputation value
Apple US 57.6 216,916
Exxon Mobil US 56.4 229,338
Royal Dutch Shell PLC UK 56.3 132,999
Chevron US 56.2 119,177
Philip Morris International US 55.7 75,873
Procter & Gamble US 55.4 101,752
McDonald’s US 55.0 56,500 Walt Disney US 54.5 36,706 IBM US 53.9 116,847 Intel US 53.8 66,392 Google US 52.4 109,588 Caterpillar US 52.2 30,573 Diageo PLC UK 52.1 28,423 Unilever PLC UK 52.1 54,003 Vodafone Group PLC UK 51.7 72,006 BG Group PLC UK 51.4 37,231 Schlumberger US 50.7 46,499 SABMiller PLC UK 50.3 28,117 Occidental Petroleum US 50.2 38,215 Qualcomm US 50.0 45,950 Rolls-Royce Holdings PLC UK 49.4 10,705 Tesco PLC UK 48.9 24,526 Aggreko PLC UK 48.6 4,055
British Sky Broadcasting Group PLC UK 48.5 9,590
Deere US 48.2 15,070
of the underlying reputations was only marginally improved. Reputation value is dependent on more than the strength of reputation alone; it’s a factor, but only part of the story (see Figure 3).
The relatively weak relationship between reputation strength and Reputation contribution is more apparent when the two measures are compared directly. Figure 4 maps the position of the (c400) US and UK companies tracked at the end of 2011. companies with a reputation strength of, for example, 6.5 (measured on a scale of 0 to 10) are show-ing correspondshow-ing Reputation contributions rangshow-ing from around 20% to 43%, a spread of 23 percentage points. Similarly, companies with a
Table 2: Reputation Contribution 2012 – the laggards
The bottom 25 Jurisdiction Reputation Contribution (%) (US$m at 2 Jan 2012)Reputation value
Best Buy US –6.4 –544
E*Trade Financial US –6.6 –151
American Eagle Outfitters US –6.8 –200
Family Dollar Stores US –7.0 –471
Health Net US –9.7 –244 Foot Locker US –10.7 –384 AOL US –10.7 –158 Kesa Electricals PLC UK –11.2 –62 Sara Lee US –11.3 –1,268 SuperValu US –11.5 –198
Coventry Health Care US –11.7 –511
Omnicare US –11.9 –470
Collective Brands US –13.4 –116
Brinker International US –14.2 –307
Cable & Wireless Worldwide PLC UK –14.9 –102
Essar Energy PLC UK –15.3 –531
Boston Scientific US –15.7 –1,242
Dean Foods US –18.2 –375
Advanced Micro Devices US –18.5 –697
Office Depot US –19.9 –120
WellCare Health Plans US –23.5 –529
Yahoo US –25.7 –5,132
Millennium & Copthorne Hotels PLC UK –29.4 –588
Cable & Wireless Communications PLC UK –30.4 –455
Sears Holdings US –39.3 –1,335
Reputation contribution of around 45% have reputation strengths ranging from around 6.7 to over 8.
The ‘strength’ of reputation has a part to play but there are other factors at work too as evidenced by the extent of the scatter. These, as explained below, relate primarily to the make-up of individual corporate reputations. clearly, it is not just how well a company is known, it’s what it is known
Figure 3: Reputation Contribution vs strength
0 50 100 150 200 250
Nov 07 Nov 08 Nov 09 Nov 10 Nov 11
FTSE100 Reputation contribution
S&P500 FTSE100 Reputation strength
S&P500
Source: Reputation Dividend
Index Nov 07 = 100
Figure 4: Reputation Contribution and strength – US and UK companies
6 5.5 6.5 7 7.5 8 8.5 10 20 30 40 50 60 Reputation Contribution (%)
Source: Reputation Dividend
for that counts and investors need to look beyond the simple measures of strength if they want to understand the impact of corporate reputation properly.
Reputation management is a means to grow shareholder returns
Separate to being a repository of shareholder value, corporate reputation is also a means to grow it.
The analysis suggests that a notional 5% improvement in the strength of an extant reputation would yield a market capitalization growth of 2.5% in a company in the S&P500 and 2.2% in one in the FTSE100. While there are differences from index to index this equates to a return on investment of around US$600m for the average sized S&P500 (market cap cUS$24bn) and US$500m for a correspondingly average FTSE100.
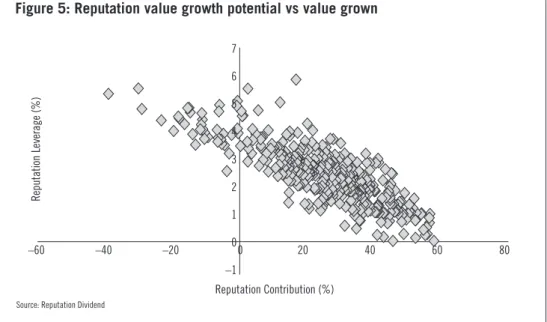
As with reputation value created, value growth depends on the individual reputation that’s being built. Reputations of different companies are by definition structured in different ways and in that offer different potential for ‘leverage’ – the increase in market capitalization that can be expected for any improvement in general reputation strength. comparing Reputation leverage and Reputation contribution of companies in the S&P500 and FTSE100 (see Figure 5) demonstrates the structure of this relationship. As a
Figure 5: Reputation value growth potential vs value grown
Reputation Contribution (%)
Source: Reputation Dividend
–1 0 1 2 3 4 5 6 7 –60 –40 –20 0 20 40 60 80 Reputation Leverage (%)
rule, less valuable reputations will provide less opportunity for value growth; however, there is substantial variation and thus opportunity within that.
In the same way that reputation value isn’t a function of strength alone, value growth is determined by changes in the individual components’ reputation. companies will achieve disproportionately greater returns on their reputation investment by ensuring that their communications activity is aligned to promote the messages that matter most to inves-tors at the time.
While the general requirements of corporate messaging may, in the broadest sense, remain consistent, it’s clear that the ‘needs’ of the invest-ment community are a movable feast.
This study uncovered important evidence of changes in the priori-ties allocated to different components of reputation. It revealed that by the start of 2012 the investment community had started to look beyond companies focused on the more defensive characteristics of quality of leadership and products/services and was starting to respond more
Communications activity should be aligned to promote the messages that matter most to investors at the time.
Capacity to innovate Quality of goods and service
s
Quality of managemen t
Quality of marketing Financial soundness Ability to attract, develop and retain talent
Value as a long-term investmen t
Community an d
environmental responsibility
Use of corporate assets People managementGlobal competitiveness Figure 6: Reputation value growth drivers
–2 –1 0 1 2 3 4
Sep 09 Sep 10 Nov 10 Sep 11 Nov 11
Source: Reputation Dividend
favourably to those companies it saw as innovating, attracting talent and investing in marketing. They were increasingly eschewing shorter-term defensive qualities and rewarding companies they perceive to be geared up to capitalise on the changing economic cycle and preparing for the upturn.
Conclusions
Reputation value analysis has important implications for both the own-ers and managown-ers of corporate brands and the investors who target them. First and foremost because it reveals the scale and location of shareholder value residing in a company’s reputation, and second because it provides an objective basis for securing and growing value further.
Reputation value analysis presents reputation owners with an objec-tive means to organise communications and broader reaching operational or strategic activities to optimise the reputation component of a firm’s market value. It answers the questions as to where the most productive messaging opportunities lie, where the company might be under-rated and so benefit from improved perceptions and, is the return on the investment required reasonable? All of which can have a critical impact on investors’ decisions as to whether or not to support one company or another.
We do not go so far as to claim that this can be a panacea for a com-pany’s reputational shortcomings, however, reputation value analysis can reveal the most pressing value generating or destroying components. moreover, by disentangling the individual drivers of reputation value it can shed light on whether the reputation issues are truly messaging problems, operational problems or some combination of the two. All of which adds up to critical insight for both reputation professionals and investors who have to make decisions as to whether the solutions, and opportunities, lie in communications, business management or wider strategic planning.
References
Black, E.l. & carnes, T.A. (2000) The market value of corporate reputation.
caves, R.E. & Porter, m.E. (1977) From entry barriers to mobility barriers. Quarterly Journal of Economics, 19, pp. 421–434.
Schwaiger, m. (2004) components and parameters of corporate reputation – an empirical study. Schmalenbach Business Review,56, January, pp. 46–71.
Spence, m.A. (1974) Market Signalling: Informational Transfer in Hiring and Related