Transportation Research Record: Journal of the Transportation Research Board, No. 1937,Transportation Research Board of the National Academies, Washington, D.C., 2005, pp. 152–158.
152 This research developed a system for visualizing four-dimensional (4-D), real-time transportation data for the major road networks of Washington, D.C., Northern Virginia, and the entire state of Maryland. The effort employed a combination of OpenGL and other modeling techniques to develop a scalable, highly interactive 4-D model using available geo-graphic information system (GIS) and transportation infrastructure data in conjunction with real-time traffic management center data. The prototype system interacts with real-time traffic databases to show ani-mations of real-time traffic data (volume and speed) along with incident data (accident locations, lane closures, responding agencies, etc.). A user can “fly” or “drive” through the region to inspect conditions at an infinite number of angles and distances. The program also allows users to mon-itor the status of and interact with traffic control devices such as dynamic message signs, closed-circuit television feeds, and traffic sensors and even view the location of emergency response vehicles equipped with Global Positioning System transceivers. Because the system uses standard GIS data and relatively standard transportation databases to derive traffic measures, it can be scaled to incorporate other states and agencies.
The primary function of a traffic management system is to moni-tor traffic conditions and manage incidents. To accomplish these goals, traffic management centers (TMCs) use large arrays of traffic sensors to measure vehicle speeds and flow rates, roadway weather stations to monitor pavement and atmospheric conditions, and closed-circuit television (CCTV) cameras to monitor road conditions and verify incidents. Once a problem or incident has been identified, TMCs use real-time databases to help manage incident response. These databases may include the location of an incident, the number and type of vehicles involved, the types of agencies responding to the incident, and so forth. Engineers are faced with the significant challenge of designing a comprehensive, intuitive means to communicate this vast array of dynamic data to both traffic management personnel and the traveling public.
TMC personnel and the traveling public have long needed one cohesive place by which to visualize, analyze, and interact with all of these data. Two-dimensional traffic maps and more sophisticated geographic information system (GIS) databases have become pop-ular means to visualize much of these data; however, these systems are typically only capable of two-dimensional data representations,
which can be limiting. Some newer GIS databases can visualize three-dimensional (3-D) data, but they are usually slow in rendering and do not currently provide the kind of real-time interaction that is necessary in a dynamic traffic management system. In a recent usabil-ity analysis study conducted by the Universusabil-ity of Virginia’s Smart Travel Laboratory on dynamic transportation system condition maps, it was noted, “There are numerous examples of functionally deficient [visualization] systems now in use throughout the world that do not meet the needs of users” (1).
The purpose of this research was to develop a comprehensive, real-time, interactive, four-dimensional (4-D) visualization system that can be used by both TMCs for operations and control and trav-eler information systems to communicate traffic conditions to the public. The prototype system encompasses the major roads monitored by the Washington, D.C., Northern Virginia, and Maryland TMCs. This research effort developed the framework around which other states will be able to integrate data into the system to create their own interactive 4-D visualization system.
LITERATURE REVIEW
Real-time transportation visualization systems have been slow to evolve. Most major urban areas with advanced traveler information systems (ATIS) and advanced traffic management systems (ATMS) still use two-dimensional traffic maps to display a graphic of the local roads, which are color coded to communicate speed and volume. Many systems also overlay icons of accidents on the map in areas where collisions have occurred or construction is taking place.
Other areas of transportation engineering are exploring more sophis-ticated visualization techniques. It has been realized that traditional engineering plans, profiles, and cross-section diagrams are no longer satisfactory in presenting geospatial data and effectively conveying a clear understanding of transportation improvement alternatives and their associated impacts (2, 3). As such, 3-D visualization is being used in the design process for planners to show design concepts to the public and to decision makers (2, 4–6 ). In general, state departments of transportation (DOTs) see visualization as a tool that can increase the likelihood of early public project acceptance (2). These 3-D plans, though extremely helpful in visualizing a final product, are static representations of new infrastructure and are rarely capable of any type of dynamic interaction.
With the rapid advance of the computer-gaming industry it is now possible to move from 3-D static renderings (in which the third dimension is depth) to 4-D visualization systems in which textured displays of solid, 3-D objects are capable of being viewed in a real-time, animated environment (4).
Four-Dimensional Interactive Visualization
System for Transportation Management
and Traveler Information
Michael L. Pack, Phillip Weisberg, and Sujal Bista
Center for Advanced Transportation Technology, University of Maryland–College Park, Building 806, Suite 3103, College Park, MD 20742-6602.
pixel represents 11 m2. These raw data cannot be used to model the terrain directly because graphic cards have limitations on how much data they can handle and render in real time.
The typical way of storing terrain data and graphing them is by using a point region KD (PR-KD) tree (9). In this approach, the entire terrain is divided into simpler triangular meshes. Each triangle will have data consisting of a centroid, vertices, and neighboring triangles. Then every triangle is added into the PR-KD tree on the basis of its centroid. To display the terrain, a spatial search is performed and only the area close to the viewing area is shown. Though the PR-KD tree approach is very good for generating terrain of smaller sizes or of relatively little detail, the application discussed here maps the area of Washington, D.C., Northern Virginia, and Maryland. To save the data for every triangular region (along with the relationship with its neighboring triangles) is very costly. Performing level-of-detail ren-dering in real time by using a PR-KD approach is also extremely costly (10, 11).
As an alternative solution to save and display terrain data effec-tively, the entire body of terrain data is saved into smaller rectangular chunks (usually grids of 128 ×128). These chunks are saved in the file in linear order with different levels of details. Once the chunks are stored in linear order, the terrain-modeling application loads only data chunks that are in the visible area of the user into the memory. To accomplish this loading, virtual spheres are drawn around every data chunk. As seen in Figure 2, the spheres are analyzed to see if they fall inside the user’s field of view, which equates to a triangular area in front of the viewer. If the chunk is within this space, it is loaded into the memory and displayed. This process is referred to as frustum culling (12).
The final optimization method used for terrain modeling renders varying levels of terrain detail based on the distance the data chunk is from the user. As seen in Figure 3, for the parts of the terrain closer to the viewer, higher levels of detail are shown, whereas for the area in the distance, less detail is shown. When fewer details are rendered in these distant areas, the number of polygons needed is reduced drastically. Thus, rendering the terrain is faster and more efficient. Driving simulators are used for prototyping new highway designs
and traffic control device placement and to analyze potential safety hazards resulting from road geometry or otherwise poor road design (7, 8). Driving simulators allow an individual to “drive” a vehicle through a virtual environment or 3-D model. Because the 3-D envi-ronment changes as the user steers and accelerates, there is an added, fourth dimension of time. Such 4-D simulators, though expensive, are slowly gaining popularity with transportation engineers.
Since 3-D and 4-D visualization has proved useful in the design process of transportation systems, it stands to reason that a real-time 4-D visualization system should also be useful for traffic manage-ment and traveler information systems. Such large-scale systems have yet to be developed because of the massive amount of data (both static geospatial and dynamic traffic and incident) that would need to be integrated and manipulated and rendered in real time to represent an area covered by a regional TMC.
PROTOTYPE SYSTEM DESIGN
A prototype 4-D, fly-through visualization system was developed to incorporate the many types of dynamic transportation data used in daily TMC operations and necessary for traveler information systems. The prototype system was developed in C++using the OpenGL appli-cation program interface. The system incorporates three main phases: (a) terrain modeling, (b) road and feature mapping, and (c) dynamic data visualization (Figure 1).
Terrain Modeling
U.S. Geological Survey 11-m digital elevation model data were used for the base terrain model. These data are represented as a large series of bitmaps, each with a resolution of 4162 ×3573 pixels, where each
(a) Load Terrain
(c) Load Dynamic Data
Render Scene
Has the user changed positions?
YES NO
(b) Load Road & Feature Data
Area seen by the viewer
Viewer
Near view plane
Far view plane Drawn Not drawn
FIGURE 2 Analysis of data chunk spheres to see if they fall inside user’s field of view.
FIGURE 1 Three main stages of prototype system.
Modeling of Road Network
Standard GIS shape files combined with state and local device and road characteristics databases were used to generate 3-D roads. The shear magnitude of the road data presents a challenge for real-time rendering; therefore, an efficient means to find all the roads within a given region and within the user’s field of view was needed. As the user changes location and viewing angle, the roads need to dynam-ically update; as with the terrain-modeling portion, objects within the field of view should be displayed, and everything else should be discarded. A polygonal map 3 (PM3) quadtree (9) data structure was used to accomplish this modeling. The PM3 quadtree uses key-space partitioning. A range search determines which points should be included in the space that the terrain model is displaying.
The quadtree is composed of three types of nodes: white, black, and gray. White nodes are simple placeholders, black nodes hold the point data, and gray nodes are guides that signify four-way subdivisions in the tree (13). Figure 4 illustrates the choice to implement the white
nodes as a singleton class to save space, considering they are all identical placeholders (14).
The search algorithm uses recursion in which the base cases are the white and black nodes of the tree. When a white node is reached, nothing happens, since it contains no data. When a black node is reached, the program determines if the black node represents a par-tition of space within the search range. If so, the point in the black node is compared with the search range. Any points falling in or on the search box are added to the result. The recursive case of the search is the gray (guide) nodes. At a gray node, the program determines into which quadrants (northwest, northeast, southwest, or southeast, or all four) the search box falls. Then it calls for a search again on these regions in the tree. Figure 5a shows an example map of a complete GIS file in which the gray box represents the search space. Figure 5b shows a zoomed-in version of Figure 5a with the same gray box, and Figure 5c shows a rendering of the resulting roads found within the gray box search area.
Because of the size of the Maryland roadway database, it was beneficial to create the quadtree and save it to disk in an organized, searchable format. When the terrain program runs, it accesses the quadtree from the disk rather than from memory. This procedure saves time by building the quadtree only once instead of each time the program is run.
Visualization of Real-Time Traffic and Incident Data
The final, and perhaps least complicated, component of the 4-D model is the addition of real-time traffic and incident data. These data are queried from the regional integrated traveler information sys-tem database at the Center for Advanced Transportation Technol-ogy, at the University of Maryland. The data include point sensor data (speed and volume), incidents (including accidents, construc-tion, disabled vehicles, etc.) locaconstruc-tion, incident response (includ-ing police, fire, rescue, etc.), lane closures, dynamic message signs, weather, and CCTV video.
The program simulates, or animates, the road condition based on the input from these data. For example, if the database reports that a particular link of the road has 20 vehicles with an average speed of 45 mph, the program loads a distribution of 20 vehicles from pre-existing vehicle models and sets them in motion at a uniform speed of 45 mph. Figure 6 includes two screen shots of dynamic traffic animations being rendered within the model.
Area seen by the viewer
Viewer
Near view plane
Moderate detail
Far view plane High
detail
Very low detail
(a) (b) (c)
FIGURE 4 Example quadtree and corresponding tree structures with and without singleton class implementation: (a) two-dimensional representation and (b) tree representation with (c) use of white node as singleton class. FIGURE 3 Rendering of varying levels of detail depending on
Since incident data are collected in real time by the regional TMCs, this information can also be used to visualize accidents dynamically on the roadway. The incident databases used include data about the number of vehicles involved in the accident, including type (car or truck), how many and which lanes are blocked, the number and type of response vehicles on the scene, and the type of incident (vehicle fire, collision, disabled vehicle, etc.). Figure 7 shows a dynamic rendering of a two-car collision with three responding vehicles (two police cars and one arrow truck) on the scene. Figure 8 shows a similar rendering of a vehicle fire on the shoulder of Interstate 495 in Maryland.
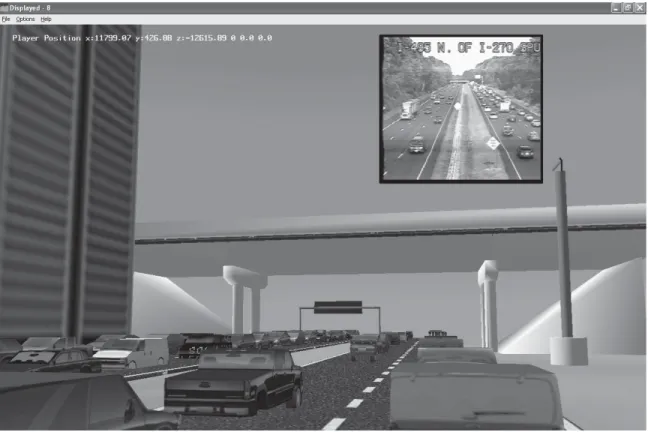
Advanced visual interface files from real-time CCTV feeds are also placed over each CCTV camera location. These videos can be seen as the user flies past each CCTV tower. A screen shot of an embedded CCTV feed can be seen in Figure 9. Figure 10 shows how the program can be used to visualize information about road closures and construction sites too.
Individual vehicles, other animated objects, and certain devices such as CCTV poles and road signs were developed by using 3-D Studio Max software. Models drawn in 3-D Studio Max can be directly imported into the 4-D visualization program. Animations (like spinning tires, flashing lights, etc.) are saved inside the individual object file.
IMPLICATIONS
Though no formal user testing of the application has been conducted, initial feedback on its usefulness from the three state DOTs has been overwhelmingly positive. TMC operators are particularly excited about the 4-D application since it will enable them to better visual-ize the status of the transportation system where they do not currently have cameras. CCTV installations are expensive and current free-way coverage with CCTV is limited. The 4-D application makes it
(a) (b) (c)
FIGURE 6 Two dynamic, real-time renderings of traffic in Maryland with dynamic message sign data displayed on left.
FIGURE 5 Searching for correct data chunk to view: (a) example of entire search space, (b) narrowed search space on basis of terrain model output, and (c) rendered portion of image.
FIGURE 7 Dynamic 4-D rendering of two-vehicle accident blocking two lanes of traffic with three responding vehicles.
FIGURE 9 Dynamic 4-D rendering of area in Maryland with real-time CCTV video feed and traffic embedded in model.
seem as if there are virtual CCTV cameras all over the coverage area. This coverage allows the operators to get a better picture of what is going on, where problems exist, and how to best resolve situ-ations. Currently, traffic sensors send back volume and speed reports to the TMC that are displayed on a color-coded map. Few operators truly understand what a volume of 500 vehicles/h, for example, really looks like on the road. This 4-D system shows vehicular traffic as an animation rather than as a number or color-coded map.
Since the 4-D program shows the geometry of the road, operators can get a better sense of how a particular incident or construction work zone might affect traffic. When emergency response vehicles are rendered and placed on the scene, a better idea of the magnitude of the incident can be created. This rendering helps to give a much bet-ter sense of the scope of the problem. It is just like having a video camera everywhere. Raw sensor and device data are converted from simple numbers (speed, volume, weather, etc.) into real pictures that much better convey the status of the system.
Transportation engineers and researchers will also be able to use the application to visualize archived and current transportation data. The system easily combines standard spatial shape files with temporal data to make 4-D views where previously only 2-D data graphs and maps were available. Engineers will be able to examine the placement of road signs, pavement markings, building placements, and structural changes. Then the engineer can drive through the virtual environment (much like one would do using a driving simulator) to see the design before construction. Unlike driving simulators, however, this 4-D program renders its environment from existing shape files, digital elevation models, and other readily available data. Thus, little funding need be allocated for expensive graphic artists and programmers. This approach can save many tens of thousands of dollars.
Though the majority of the public would not be able to run this pro-gram from their own machines, the television media could easily adapt it for weather and traffic reports. Showing a fly-through of a city, state, or region would be much more understandable and beneficial to the public than a simplistic 2-D map or a fixed-position CCTV feed. NEXT STEPS
Rendering overpasses where roads intersect is currently the only part of this application that is not dynamic because the GIS files and other databases that are being used for the project do not contain infor-mation about which road (when there is an intersection) is on top of the other road. At the moment, intersecting roads must be manipu-lated manually to make them look correct. Future development with improved GIS files could help to automate this process.
The model does not include arterials at the moment. Future work should be done to add arterial data including signal timing plans. In addition, the terrain-modeling portion of the program does not incor-porate fancy texturing. Future work will overlay detailed aerial imagery onto the terrain to provide a more realistic visualization of the region. CONCLUSIONS
The purpose of this research was to develop a comprehensive, real-time, interactive, 4-D visualization system that can be used by TMCs for operations and control and by traveler information
sys-tems to communicate traffic conditions to the public. The prototype system encompasses the major roads monitored by the Washington, D.C., Northern Virginia, and Maryland TMCs. Though more work is needed to automate the rendering of certain features including over-passes and intersections, the initial prototype shows great promise in providing the ability to dynamically render large areas with real-time traffic data. This research effort developed the framework around which other states will be able to integrate data into the system to cre-ate additional interactive 4-D visualization systems.
REFERENCES
1. Smith, B. L., W. Scherer, M. Evans, and S. Guerlain. Dynamic Transpor-tation System Condition Maps: Usability Analysis to Support Improved System Design. In Towards a Vision for Information Technology in Civil
Engineering, Proc., Fourth Joint International Symposium on Information
Technology in Civil Engineering, Nov. 15–16, 2003, Nashville, Tenn., ASCE, New York, 2004, pp. 1–16.
2. Huang, B. Dynamic Environmental Visualization Within a Virtual Envi-ronment. Presented at 83rd Annual Meeting of the Transportation Research Board, Washington, D.C., 2004.
3. Huang, B., H. Li, and X. Huang. Visualizing Massive Terrain with Transportation Infrastructure by Using Continuous Level of Detail. In
Transportation Research Record: Journal of the Transportation Research Board, No. 1899, Transportation Research Board of the National
Acad-emies, Washington, D.C., 2004, pp. 175–180.
4. Hughes, R. G. Visualization: Where Should Our Direction Lie? Working Paper. Presented to TRB Visualization in Transportation Task Force, Transportation Research Board of the National Academies, Washington, D.C., 2003.
5. Bailey, K. D., and T. Grossardt. Better Visioning for Transit System Development: Framework for Improvement of Visualization and Its Successful Application. Presented at 83rd Annual Meeting of the Trans-portation Research Board, Washington, D.C., 2004.
6. Liapi, K., J. O’Connor, and N. Khwaja. Highway Interchanges: Con-struction Schedule and Traffic Planning Visualization. Presented at 82nd Annual Meeting of the Transportation Research Board, Washington, D.C., 2003.
7. Andersen, G. J., C. Sauer, and A. Saidpour. Visual Information for Car Following by Drivers: Role of Scene Information. In Transportation
Research Record: Journal of the Transportation Research Board, No. 1899, Transportation Research Board of the National Academies,
Wash-ington, D.C., 2004, pp. 104–108.
8. Khattak, A. J., S. Hallmark, and R. Souleyrette. Application of Light Detection and Ranging Technology to Highway Safety. In
Transporta-tion Research Record: Journal of the TransportaTransporta-tion Research Board, No. 1836, Transportation Research Board of the National Academies,
Washington, D.C., 2003, pp. 7–15.
9. Samet, H. The Design and Analysis of Spatial Data Structures. Addison-Wesley, Reading, Mass., 1990.
10. Larsen, B., and N. Christensen. Real-Time Terrain Rendering Using Smooth Hardware Optimized Level of Detail. Journal of the Winter
School of Computer Graphics, Vol. 11, No. 1, Feb. 2003.
11. Ogren, A. Continuous Level of Detail in Real-Time Terrain Rendering. Master’s thesis. Umea University, Sweden, 2000.
12. Moller, T. Optimized View Frustum Culling Algorithms. Technical Report 99-3. Department of Computer Engineering, Chalmers University of Technology, Sweden, March 1999. www.ce.chalmers.se/staff/uffe. 13. Samet, H., and R. E. Webber. Storing a Collection of Polygons Using
Quadtrees. ACM Press, New York, 1985.
14. Gamma, E. Design Patterns: Elements of Reusable Object-Oriented
Software. Addison-Wesley, Reading, Mass., 1995.
The Visualization in Transportation Task Force sponsored publication of this paper.