QUT Digital Repository:
http://eprints.qut.edu.au/37926
Pathak, Virendra and Dikshit, Onkar (2010) A new approach for finding an appropriate combination of texture parameters for classification. Geocarto International, 25(4). pp. 295-313.
1
A new approach for finding an appropriate combination of
texture parameters for classification
Virendra Pathak
1, Onkar Dikshit
21. School of Urban Development, QUT, Brisbane, Australia 2. Department of Civil Engineering, IIT Kanpur, UP, India
This paper suggests an approach for finding an appropriate combination of various parameters for extracting texture features (e.g. choice of spectral band for extracting texture feature, size of the moving window, quantization level of the image, and choice of texture feature etc.) to be used in the classification process. Gray level co-occurrence matrix (GLCM) method has been used for extracting texture from remotely sensed satellite image. Results of the classification of an Indian urban environment using spatial property (texture), derived from spectral and multi-resolution wavelet decomposed images have also been reported. A multivariate data analysis technique called ‘conjoint analysis’ has been used in the study to analyze the relative importance of these parameters. Results indicate that the choice of texture feature and window size have higher relative importance in the classification process than quantization level or the choice of image band for extracting texture feature. In case of texture features derived using wavelet decomposed image, the parameter ‘decomposition level’ has almost equal relative importance as the size of moving window and the decomposition of images up to level one is sufficient and there is no need to go for further decomposition. It was also observed that the classification incorporating texture features improves the overall classification accuracy in a statistically significant manner in comparison to pure spectral classification. Key words: Texture, GLCM, Wavelet, Conjoint analysis, Classification
2
Inclusion of spatial information in the classification process in the form of texture using the window-based approach is dependent on the choice of various parameters. These include the choice of spectral band for extracting texture feature, size of the moving window, inter-pixel distance and quantization level of the image, etc. The improvement in overall classification accuracy is thus window dependent, which, in turn depends upon the structure of the classes. To analyze the significance of few variables needed in texture feature extraction like spatial resolution, spectral band and size of moving window, inter-pixel distance and quantization level of the image, study (Marceau et al. 1990) showed that the size of the window was found to be the most important parameter affecting classification accuracy. To study the best texture feature and window size, textural classification of SPOT XS images of Indian urban areas was carried out using five GLCM features employing three spectral and one texture feature. It has been reported that angular second moment and correlation texture feature gave lower classification accuracy amongst all the features and the best window sizes were 7 x 7 and 9 x 9 for extracting textural features (Shaban and Dikshit 2001). In another research to analyse the effects of texture window size on classification accuracy, the conclusions drawn indicate that texture was more effective for improving the classification accuracy of land use classes at finer resolution levels. For spectrally homogeneous classes, a small window is preferable but for spectrally heterogeneous classes, a large window size is required (Chen et al. 2004). The GLCM textures based on Landsat ETM+ panchromatic and
3
different sizes of moving windows have also been investigated. The findings support that not all texture measures can improve classification performance and for the same texture measure, selecting the appropriate window size and spectral band is crucial (Lu et al. 2007). There have also been experiments with texture information derived using QuickBird and IKONOS satellite image and the findings suggest that the best accuracies were found in both images for mean and angular second moment texture parameters. The optimum window size in these texture parameters was 3 x 3 for Ikonos images, while for Quick Bird images it depended on the quality index studied, but the optimum window size was around 15 x 15. The optimum value of grey level in their study was 128 (Agüera et al. 2008).
It has also been reported that the approaches based on the multiresolution analysis like wavelet transform often outperform traditional second order statistics (Bouman and Liu 1991, Unser and Eden 1989). Methods based on wavelet transform and MRA have received a lot of attention. A multiresolution approach based on a modified wavelet transform called the tree-structured wavelet transform for texture analysis and classification has been proposed with reported overall accuracy of 98.9% for all the textures (Chang and Kuo 1993). The texture analysis and the classification on remote sensing image have been studied using wavelet (Zhu and Yang 1998). The set of parameters for retrieving urban objects using a wavelet transform approach have also been studied. All the retrieval parameters including summary statistical indices for the detail
4
sub-images of the wavelet transform, an edge pixel index, the level of the wavelet transform, and the search window size were effective, except for the weighting scheme, in retrieving the target objects (Bian 2003). The optimization and selection of wavelet texture for feature extraction from high-resolution satellite imagery have also been investigated and the findings suggest that classification accuracy decreases with increasing levels of decomposition and texture-integrated classification delivered a significant contribution to the improvement of tree extraction from high-resolution imagery in urban areas (Yashon et al. 2006).
Inclusion of spatial information in the form of texture is still considered as an interesting but challenging problem in remote sensing. Considerable experimentation is required to arrive at an appropriate combination of various parameters for extracting texture features. The main objective of the present work is to suggest an approach for eliminating the lengthy process of selecting these parameters. A multivariate data analysis technique called conjoint analysis (Hair et al. 1998) has been used in this study to determine the relative importance of various parameters affecting classification accuracy. Besides GLCM, the classification approach has also used texture features derived from wavelet-decomposed remote sensing images at multi-resolution.
5 2 Objectives, study site and data
The objectives of this study were to
quantify the relative importance of various parameters which affect textural classification and to suggest an approach for eliminating lengthy process of selecting various parameters while using textural features in the classification process
investigate the importance of texture information in classification of the Indian urban environment using conventional and wavelet based approaches
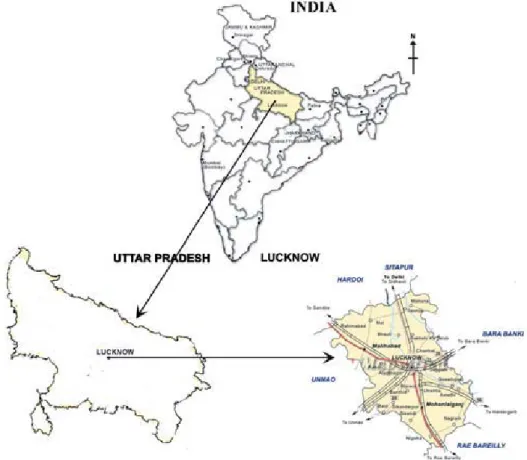
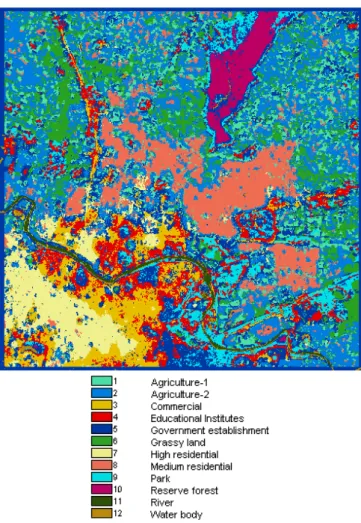
The study has been carried out for Lucknow city, the state capital of northern Indian state of Uttar Pradesh (Figure 1). It is situated in the upper Gangetic plains of the country, the geographical extent of study area lies within North latitudes 26 45 to 27 and the East longitudes 80 50 to81 5 . From the study of the available maps, field visits and the previous knowledge about the study site, it was observed that 12 classes covered the majority of the urban land use features (Table 1).
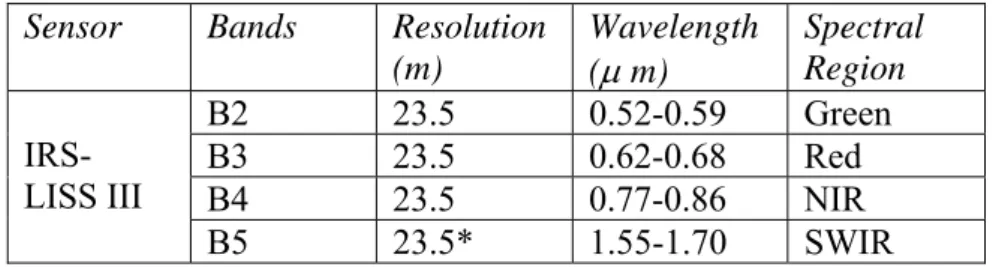
The satellite data products used for the study was procured from linear imaging self scanning (LISS)-III sensors on board IRS-1C satellite through National Remote Sensing Agency (NRSA), Hyderabad, India
6
(Table 2). A central extract covering major portion of urban areas encompassing 145 sq. km. was extracted from the satellite image for the study. In addition to these satellite data products, corresponding topographic and land use maps were also used.
3 Theoretical background
Majority of the methods implementing texture information have used statistical approaches as the basic texture calculating algorithm. Methods based on wavelet transform have also been reported in the literature. In the present work second order statistics based approach GLCM and stationary wavelet transform (SWT) have been used. A multivariate data analysis technique called ‘conjoint analysis’ (Hair et al. 1998 ) has been used to determine relative importance of various parameters effecting classification. Next sections present a brief theoretical background about these approaches.
3.1 Statistical approach of texture analysis
Statistical approaches can be divided into two areas. The spatial domain approach and the frequency domain approach. The present investigations have used the spatial domain approach rather than the frequency domain approach. This is due to the observations by the previous researchers, who, reported that spatial domain approach was more powerful than the
7
frequency domain for the classification of the urban area (Gong et al. 1992).
Haralick et al. (1973) presented one of the most widely used approaches to texture analysis, the spatial gray level dependence matrix (SGLDM) or the gray level co-occurrence matrix (GLCM) approach They listed 14 texture features that utilize the spatial relationship amongst gray level values of pixels with in a region. For a comprehensive review on statistical algorithms, the reader can refer (Haralick 1979, Gool et al. 1985).
3.2 Wavelet analysis
This study has used stationary wavelet transform (SWT). To understand SWT reader should know about basics of wavelet analysis, discrete wavelet transform (DWT) and MRA. For details on these topics one can refer to excellent references from ((Mallat 1989, Chui 1992, Young 1993, Graps 1995, Aboufadel and Schlicker 1999, Misiti et al. 2000). It is important to extract the features from the wavelet-decomposed bands which effectively characterize the texture. The features are calculated from the approximation (App) and the detail (Det) images by placing a convolving window of certain size over these images and used as textural features in classification along with the spectral bands. The textural
8
features can be extracted from the wavelet-decomposed channels as described in (Chen et al. 1999).
3.3 Conjoint analysis
The technique ‘Conjoint analysis’ used for determining the relative importance of various parameters is a family of techniques and methods, all theoretically based on the models of information integration and functional measurement. The purpose of the conjoint analysis is to estimate the utility scores, called part-worth of various parameters considered for the study. The parameters are independent variables and their utility scores are a measure importance of each parameter. The parameter levels are the specific values of these independent variables. Output from the conjoint analysis includes importance ratings of the parameters, part-worth estimates showing preferences for different alternatives. Reader can refer (Green and Srinivasan 1990, Carroll and Green 1991, Pathak and Dikshit 2006) for further details about this technique. A brief theoretical detail of this technique has been presented in the following paragraphs.
In conjoint analysis, first a set is constructed by combining the selected levels of each parameter. These combinations are then evaluated. Because the researcher selects different parameters and their levels in a specific manner, the influence of each parameter and its level on the final result (classification accuracy) can be determined from overall ratings of
9
the particular combination of different parameters. Table 3 and Table 7 show the number of parameters and their levels considered in the present study. Further details about use of conjoint analysis for this study is presented in section 5.
4 Methodology
The entire methodology to achieve objectives can be broadly divided into two parts.
(i) The first part has two phases. In the first phase, the relative importance of parameters considered for GLCM texture analysis was assessed using conjoint analysis. In the second phase, Gaussian Maximum likelihood (GML) classification was carried out with selected parameters.
(ii) The second part also has two phases. In the first phase, the relative importance of parameters affecting texture analysis using wavelet-decomposed images was determined. In the second phase, classifications were carried out with wavelet-derived texture feature using selected parameters.
Implementation of texture using GLCM involves selection of number of algorithm specific parameters. Researchers have studied effects of different parameters of GLCM on classification accuracy. These
10
parameters include choices relatedto the type of image band, quantization levels, window size, texture features, distance metric and direction for computing textures. In the present study, distance metric of single pixel in horizontal direction was considered while varying all other parameters. Five GLCM texture measure were used in study i.e Mean (Mean), Variance (Var), Angular second moment (Asm), Contrast (Con) and Entropy (Ent).
Sample set size was determined using multinomial distribution approach at 99% reliability with desired precision of 5%. Two different sets of pixels from every class were selected for training and testing purposes using a random sampling approach. The training and test pixels for different classes were selected with the help of various available maps and field visits. The overall classification accuracy and the accuracy of the individual classes were assessed by computing kappa coefficient (κ) and associated asymptotic variances. Pairwise statistical tests were performed to assess the significance of any differences observed between two classifications using Z statistics (Congalton and Green 1999).
5 Procedure, results and analysis
This section presents detailed procedure, results and analysis of various experiments carried out to find relative importance of parameters affecting textural classification and the importance of texture in classification of Indian urban environment.
11
5.1 Classification with GLCM texture feature
In the first phase, relative importance of various parameters was determined, subsequently in. the second phase, classifications were carried out with selected features after taking lead from results of the first phase of experiments. Following section presents the relative importance of the various parameters affecting classification accuracy, when, classification is carried out with GLCM texture features.
5.1.1 Relative importance of the parameters
In the first phase, Principal Component Analysis was performed using bands 2, 3 and 4. The first principal component image (PC1) was used in the experiments along with the other bands. These bands were then used with the four different quantization levels (32, 64, 128, and 256). A conjoint analysis was performed considering four parameters (image band, quantization level, window size and texture feature) while keeping distance metric and direction fixed. Table 3 presents the parameters and their level considered for the study. Input features for various textural classifications in the first phase include four spectral and one textural feature. For conjoint analysis, the first parameter (image band) for extracting texture feature was considered with four levels (band 2, band 3, band 4 and PC1). The second parameter (quantization level) was considered with four levels (32, 64, 128 and 256). The third parameter (window size) was considered
12
having five levels (odd sized windows varying from 5 (5x5) to 21 (21x21) pixels). The fourth parameter (texture feature) had five levels. These texture features Mean, Var, Con, Ent and Asm were calculated using GLCM approach with a distance metric of one pixel in the horizontal direction.
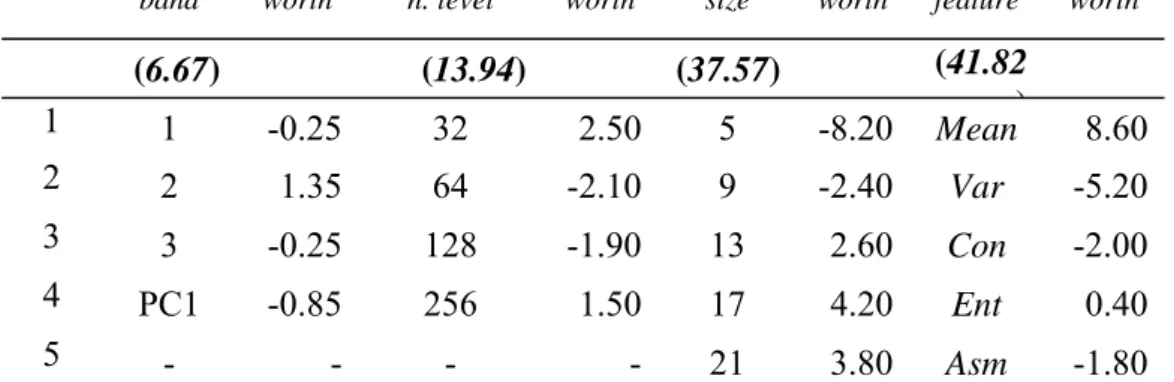
Out of a possible 400 (4x4x5x5) combination of parameter levels, an orthogonal design (Hair et al. 1998) was generated. Based on the orthogonal design, twenty-five texture features were derived. For example, a possible combination could be the Asm texture feature derived from band 3 having 64-quantization level at window size 17. These features were then used in conjunction with four spectral features for the classification purpose. Subsequent results of the test set accuracy were used to derive relative importance of the different parameters affecting classification accuracy; and the part worth of their levels. Results of conjoint analysis for assessing the relative importance of the parameters and part-worth of their levels considered for the study are presented in Table 4. The following observations can be made from these results:
(i) Out of the fourparameters investigated, the choice of texture feature has the highest relative importance (41.82%) followed by choice of window size (37.58%), quantization level (13.94%) and choice of image band used for extracting texture feature (6.67%).
13
(ii) Mean texture feature having highest part-worth value is the most important texture feature amongst all features considered for the study.
(iii)With the increase in size of window, classification accuracy increases up to a certain extent but stabilizes thereafter.
5.1.2 Classification using GLCM texture feature
After taking lead from results of the first phase, detailed analysis were performed in the second stage of the first part of experiments with selected parameters. GLCM textural features Mean, Con and Ent were used with spectral features. These texture features were derived from PC1 at 256 quantization levels with window sizes varying from 5 to 21 pixels. It was observed from the results that inclusion of the texture feature in the classification process improved overall classification results in a significant manner. This increase in the overall accuracy was maximum with the Mean followed by Con and Ent. Test accuracy with Ent decreased initially with the window size of 5 and 9. Thereafter, it increased with higher window sizes. It was also observed that with the increase in window size, the accuracy increased but for every texture feature there was an optimum window after which this increase was statistically not significant.
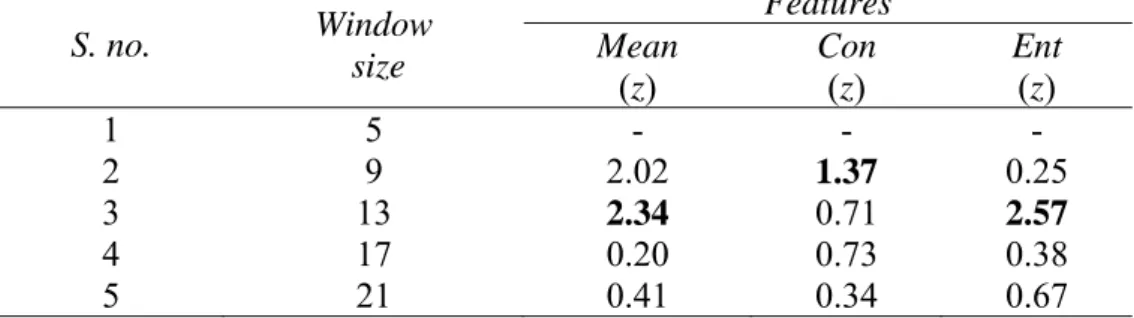
The optimum window is determined as follows. It is a window for which the
-coefficient is not statistically significantly different, in comparison with any higher window sizes. For any window larger than the14
optimum window size, the magnitude of
- coefficient may be higher or lower than that for the optimum window size. However,
-coefficients for the optimum window and any window larger than the optimum window will be statistically similar.For texture features Mean and Ent the optimum window size was 13, for Con it was 9 (Table 5). These results also corroborate the findings of conjoint analysis that Mean is the most important texture feature and with the increase in size of window, classification accuracy increase up to certain extent but stabilizes thereafter. Table 6 gives classification results with spectral and combined spectral and textural features for all three features at the optimum window sizes. Figure 2 shows a classified image using spectral plus texture feature Mean at optimum window size 13. It was observed that a window that is optimal for the overall accuracy for a given texture feature was not optimum for all the classes. However, before presenting results for various classes, it is important to understand the effect of window for various classes, which have been explained below.
In texture analysis, it is important that the textural features for the various class types need to be extracted over a local area of unknown size and shape. If the areas are not large enough with respect to the texture element or variations, then one cannot expect these local analyses to provide feature values that are invariant across the textured region. Consequently, it is desirable to extract the textural information over as large an area as possible. It is difficult to ensure that the window selected does not cover more than one texture class. If this is the case (i.e. texture
15
features are not calculated from a single texture class), then the features would be representing a hybrid value and this leads to the so-called window-effect. This situation is likely to occur at class boundaries and for the classes that have spatial extent smaller than window size (e.g. linear classes like river, small water ponds etc.).
It can be observed from results presented in above table 6 that none of the texture features are effective in improving accuracy of the classes like grassy land, river and water body. The accuracy of above classes are already high using pure spectral classification, therefore there is no need to add any further feature to improve the results. Moreover, for class river, the accuracy decreases after textural features are added in the classification process. This is due to the window-effect as explained above. Texture feature Mean was very effective in improving accuracy of classes like agriculture-1 and agriculture-2, commercial, educational institutes, government establishment, medium residential and reserve forest. This increase in accuracy was more than 10% for these classes over pure spectral classification. Though, texture features Con and Ent improved accuracies of the various classes other than grassy land, river and water, but this increase was not statistically significantly different for most of the classes. The overall test accuracy in terms of
-coefficient increased from 0.74 to 0.87 (increase of 13%) after including Mean texture feature. It was also observed from this classified image that edges of classes like river and reserve forest have broadened due to the window-effect.16
5.2 GML classification with wavelet-derived texture feature
The second part of experiment was conducted using GML classifier with wavelet-derived texture features. In the first phase, relative importance of various parameters considered for deriving texture features using wavelet analysis was determined. In the next phase, GML classifications were carried out with selected features. The following sections present relative importance of various parameters considered while extracting wavelet-derived texture features, and importance of use these wavelet wavelet-derived texture features in the classification of urban environment.
5.2.1 Relative importance of parameters
To find out the relative importance of the parameters in wavelet-based texture classification, PC1 image was decomposed using SWT. This decomposition resulted into one approximate image (App) and three detail images (3det) (horizontal, vertical and diagonal detail images) at each decomposition level. The present study examines up to three levels of decomposition. The textural features Mean, Var, Asm, Con and Ent were extracted from the App and 3det at different levels of composition.
For carrying out analysis, the first parameter considered was wavelet-decomposed image (Dec_img) used for extracting texture features, two levels were considered for this. The first level used only App for extracting texture feature; the second level used App along with 3det for extracting texture features, thus making a total of four textural features.
17
The second parameter, decomposition level (Dec_level) was considered with three levels (1, 2 and 3).
The third parameter (Window size) had five levels (odd sized windows varying from 5x5 to 21x21 pixels). The fourth parameter (Texture feature) was considered with five levels. These texture features, Mean, Var, Con, Ent and Asm were calculated using equations described in Chen et al., 1999. The texture features were obtained using the following combination of different parameters and their levels (Table 7).
Out of the possible 150 (2x3x5x5) combination of parameter levels, an orthogonal design was generated. Based on this design, twenty-five texture features were derived. For example, a possible combination could be Con texture feature derived using App + 3Det at decomposition level 3 with window size 9. These texture features were then used in conjunction with four spectral features for classification purpose. In case when only App was used to extract texture feature, a total of 5 (four spectral and one texture) features were used in the study. While considering App + 3det, 8 (four spectral and four texture) features were used for the classification. Subsequently, GML classifications were carried out and results on the test sample sets were used to derive relative importance of different parameters and part-worth of their levels.
Results of conjoint analysis for assessing relative importance of parameters considered for GML classification with wavelet-derived texture features are presented in Table 8.
18
Following observations can be made from the results of conjoint analysis:
(i) Out of the four parameters investigated, choice of texture feature has the highest relative importance (33.66%) followed by choice of window size (26.57%), decomposition level (24.51%) and decomposed images used in classification (15.26%).
(ii) The decomposition level has almost similar relative importance as that of window size, indicating that it is equally important in texture analysis using wavelet-based approach.
(iii) Part-worth scores of various levels show that combination of App and 3det is preferred over only App for extracting texture features.
(iv) Wavelet decomposition of images up to level one is sufficient and there is no need to go for further decomposition.
5.2.2 Classification with texture features derived using wavelet base approach
Taking lead from the results of conjoint analysis, further experiments were performed using texture features Mean, Con and Ent. These features were
19
derived using App + 3det at the first level of decomposition with window sizes varying from 5x5 to 21x21. Thus a total of eight features (four spectral and four textures) were used in classification process. It was observed from the results that inclusion of texture feature in the classification process improved overall classification results in a significant manner.
The classification results with spectral and combined spectral and texture features show that in this approach as well, the overall classification with wavelet based texture features was statistically significantly better than the pure spectral features for all window sizes. Further, although with increase in the window size, the accuracy increased; but for every texture feature there was an optimum window. After this window size, the increase in classification accuracy was statistically not significant. For texture features Con and Mean the optimum window size was 9, for Ent it was 17. Comparison of GML classification results between GLCM and wavelet-derived texture feature reveals that with more number of bands in wavelet-based approach; statistically significantly higher accuracy was achieved using texture features at all window sizes.
6 Conclusions
Based on the results of the study it can be concluded that ‘conjoint analysis’ can be successfully used to determine effects of various
20
parameters on the classification results with textural features and also the relative importance of the parameters affecting textural classification. This technique could be used for selecting the important texture parameters having maximum effect on the classification accuracy. Further experimentation can then be carried out giving much importance to the important parameters without wasting much time on experimentation with less important parameters, thereby, eliminating the lengthy process of selecting various parameters.
The following conclusions can be drawn from the analysis carried out with GLCM derived texture features: Out of the four parameters investigated to find out their relative importance in GLCM texture classification, the choice of texture feature has the highest relative importance (41.82%) followed by the window size (37.58%), quantization level (13.94%) and the choice of image band for extracting texture feature (6.67%). It was also observed that GLCM texture feature improved classification results in a significant manner. This increase in accuracy was in the range of 12% to 14% in comparison to pure spectral classification. With the increase in window size the accuracy increased. However, for every texture feature, there was an optimum window after which this increase was statistically not significant. Inclusion of the Mean texture feature has the highest effect on classification results followed by Contrast. Experiments with texture features derived using wavelet based approach revealed that the choice of texture feature was observed as the most important parameter affecting classification accuracy (33.66%),
21
followed by the choice of window size (26.57%), decomposition level (24.51%) and the band combination used for decomposition (15.26%). The parameters decomposition level has almost equal relative importance as that of the window size. Part-worth scores of the various parameter levels show that a combination of approximate and three detail images is preferable over only the approximate image for extracting texture features. Decomposition of images up to level one is sufficient and there is no need to go for further decomposition. Comparison of classification results with GLCM derived texture reveals that statistically significantly higher accuracy was achieved using wavelet-derived texture feature at all the window sizes.
References:
Aboufadel, E., and Schlicker, S., 1999. Discovering Wavelets, A Wiley-Interscience Publication, John Wiley & Sons, Inc, New York.
Agüera, F., Aguilar, F., J., and Aguilar, M. A., 2008. Using texture analysis to improve per-pixel classification of very high resolution images for mapping plastic greenhouses, ISPRS Journal of Photogrammetry & Remote Sensing, 63, 635–646
Bian, L., 2003. Retrieving Urban Objects Using a Wavelet Transform Approach, Photogrammetric Engineering & Remote Sensing, 69 (2), 133-14.
22
Bouman, C., and Liu, B., 1991. Multiple resolution segmentation of textured images, IEEE Transactions on Pattern Analysis and Machine Intelligence, 13, 99-113.
Carroll, J. D., and Green, P. E., 1991. Psychometric Method in Marketing Research: Part 1, Conjoint Analysis, Journal of Market Research, 32, 113-120.
Chang, T., and Kuo, C. C. J., 1993. Texture analysis and classification with tree-structured wavelet transform, IEEE Transaction on Image Process,2 (4), 429-441.
Chen, Z., Feng, T. J., and Houkes, Z., 1999. Texture segmentation based on wavelet and kohonen network for remotely sensed images, IEEE Transactions on Image Processing, 6, 816-821.
Chen, D., Stow, D. A., and Gong, P., 2004. Examining the effect of spatial resolution and texture window size on classification accuracy: an urban environment case, International Journal of Remote Sensing, 25 (11), 2177-2192.
Chui, C. K., 1992. An Introduction to Wavelets, Academic Press, Inc, Harcourt Brace Jovanovich publishers, San Diego.
23
Congalton, R. G., and Green, K., 1999. Assessing the Accuracy of Remotely Sensed Data: Principles and Practices, CRC Press, Inc., U.S.A.
Gong, P., Marceau, D. J., and Howarth, P. J., 1992. A comparison of spatial feature extraction algorithms for land-Use classification with SPOT HRV data, Remote Sensing of Environment, 40, 137-151.
Gool, L. V., Dewaele, P., and Qosterlinck, A., 1985. Texture analysis, anno. 1983, Computer Vision Graphics and Image Processing, 29, 336-357.
Graps, A., 1995. An Introduction to Wavelets, IEEE Computer Science Engineering, 674-693, summer 1995.
Green, P. E., and Wind, Y., 1975. New Way to Measure Consumers’ Judgements, Harvard Business Review,53, July-August: 107-117.
Green, P. E., and Srinivasan, V., 1990. Conjoint Analysis in Marketing: New Developments with Implications for Research and Practice, Journal of Marketing, 54 (4), 3-19.
Hair, J. F., et al., 1998. Multivariate Data Analysis, fifth edition, Prentice-Hall International Inc., NJ, USA.
24
Haralick, R. M., Shanmugam., K., and Dinstein, I., 1973. Textural features for image classification, IEEE Transaction on Systems, Man and Cybernetics, SMC-3, 610-621.
Haralick, R. M., 1979. Statistical and structural approaches to texture, Proceeding of the IEEE, 67, 786-804.
Lu, D., Batisstella, M., and Moran, E., 2007. Land-cover classification in the Brazilian Amazon with the integration of Landsat ETM+ and Radarsat data, International Journal of Remote Sensing, 28 (24), 5447-5459.
Mallat, S. G., 1989. A theory for multiresolution signal decomposition: The wavelet representation, IEEE Transactions on Pattern Analysis and Machine Intelligence, 11 (7), 674- 693.
Marceau, D. J., et al., 1990. Evaluation of the gray-level co-occurrence matrix method for land cover classification using SPOT Imagery, IEEE Transaction on Geosciences and Remote Sensing, 28, 513-519.
Misiti, M., et al., 2000. Wavelet Toolbox User’s Guide, The Math works, Inc. Natic, MA.
Pathak, V., and Dikshit, O., 2006. Conjoint analysis for quantification of relative importance of various factors affecting BPANN classification of
25
urban environment, International Journal of Remote Sensing, 27 (21), 4769-4789.
Shaban, M. A., and Dikshit, O., 2001. Improvement of classification in urban areas by the use of textural features: the case study of Lucknow city, Uttar Pradesh, International Journal of Remote Sensing, 22, pp. 565-593.
Unser, M., and Eden, M., 1989. Multiresolution feature extraction and selection for texture segmentation, IEEE Transactions on Pattern Analysis and Machine Intelligence 11, 717-728.
Yashon, O. O., Ngigi, T. G. and Tateishi, R., 2006. On the optimization and selection of wavelet texture for feature extraction from high-resolution satellite imagery with application towards urban-tree delineation, International Journal of Remote Sensing. 27 (1), 73–104.
Young, R. K., 1993. Wavelet theory and its applications, Kluwer Academic Publishers, Boston.
Zhu, C., Yang, X., 1998. Study of remote sensing image texture analysis and classification using wavelet, International Journal of Remote Sensing, 14 (3), 615-619.
26
Table 1. Classes in study area and their brief description
S. no. Name Description
1 Agriculture-1 Agriculture area having crops at middle stage of growth
2 Agriculture-2 Agriculture area having crops at early stage of growth
3 Commercial Central business area of the city 4 Educational institutes Various educational Institutions 5 Government
establishment Different Government establishments 6 Grassy land Big patches of lands having grass only 7 High residential Residential areas with more than 600
persons/hectare
27
persons/hectare
9 Park Parks for recreational activities
10 Reserve forest A big portion of land reserved for forest 11 River River Gomti flowing from left to right 12 Water body Various small water bodies in the study
area
Table 2. Satellite data characteristics for study area
Sensor Bands Resolution (m) Wavelength (
m) Spectral Region IRS- LISS III B2 23.5 0.52-0.59 Green B3 23.5 0.62-0.68 Red B4 23.5 0.77-0.86 NIR B5 23.5* 1.55-1.70 SWIR *Resampled28
Table 3. Parameters and their levels considered for GLCM texture classification
Level
Parameters
Image band Quantization level Window size Texture feature
1 2 32 5 Mean
2 3 64 9 Var
3 4 128 13 Con
4 PC1 256 17 Ent
5 - - 21 Asm
*Values indicate in ( ) are relative importance of parameters in percentage
Table 4. Relative importance of parameters and part-worth scores of their levels in GLCM texture classification
Level
Parameters and their part-worth
Image band Part-worth Quantizatio n. level Part-worth Window size Part-worth Texture feature Part-worth (6.67) (13.94) (37.57) (41.82 ) 1 1 -0.25 32 2.50 5 -8.20 Mean 8.60 2 2 1.35 64 -2.10 9 -2.40 Var -5.20 3 3 -0.25 128 -1.90 13 2.60 Con -2.00 4 PC1 -0.85 256 1.50 17 4.20 Ent 0.40 5 - - - - 21 3.80 Asm -1.80
29
Table 5. Optimum window size for texture features with GML classification
S. no. Window size Features Mean (z) Con (z) Ent (z) 1 5 - - - 2 9 2.02 1.37 0.25 3 13 2.34 0.71 2.57 4 17 0.20 0.73 0.38 5 21 0.41 0.34 0.67
* Values in bold indicate Z-statistic corresponding to optimum window size
(z) Z-statistic with respect to immediate previous window
Table 6. Accuracy with spectral + GLCM texture features at the optimum window size using GML classification
S.
no Class name
Test accuracy
Features Z-statistic
a b c d zba zca zda
1 Agriculture-1 0.78 0.96 0.81 0.90 3.65 0.38 2.16 2 Agriculture-2 0.77 0.98 0.90 0.81 4.19 2.34 0.57 3 Commercial 0.71 0.88 0.78 0.80 2.77 1.06 1.43 4 Educational institutes 0.53 0.66 0.56 0.61 1.70 0.31 1.05 5 Government establishment 0.11 0.59 0.26 0.14 7.42 2.47 0.57 6 Grassy land 0.89 0.90 0.88 0.88 0.26 -0.24 0.24 -7 High residential 0.81 0.90 0.83 0.81 1.81 0.42 0.02 8 Medium residential 0.85 0.96 0.89 0.86 2.52 0.74 0.23 9 Park 0.73 0.82 0.79 0.86 1.32 0.89 2.18 10 Reserve forest 0.90 0.98 0.93 0.96 2.01 0.58 1.60 11 River 0.92 0.90 0.89 0.89 -0.27 -0.53 -0.52 12 Water body 0.93 0.94 0.89 0.95 0.31 0.81 - 0.65 Overall 0.74 0.87 0.78 0.79 7.46 2.09 2.42
a Spectral features only, b Spectral + Mean 13 c Spectral + Con9, d Spectral + Ent13 zxa Z-statistic with respect to a ( x varies from b to d )
30
* Values indicated in ( ) are relative importance of parameters in percentage
Table 7. Parameters and their levels considered in wavelet-based texture classification
Level
Parameters Dec_img Dec_
level
Window size Texture
feature
1 App 1 5 Mean
2 App + 3Det 2 9 Var
3 - 3 13 Asm
4 - - 17 Con
5 - - 21 Ent
Table 8. Relative importance of parameters and part-worth scores of their levels in wavelet-based texture classification
Level
Parameters and their Part-worth
Dec_img Part-worth Dec_lev el Part-worth Window size Part-worth Texture feature Part-worth (15.26) (24.51) (26.57) (33.66) 1 App -2.58 1 4.30 5 -5.80 Mean 3.80 2 App+3 d 2.58 2 -0.30 9 -1.40 Var -5.80 3 - - 3 -4.00 13 2.00 Con 5.60 4 - - - - 17 2.00 Ent -0.60 5 - - - - 21 3.20 Asm -3.00
31
32