Procedia Computer Science 54 ( 2015 ) 301 – 310
1877-0509 © 2015 The Authors. Published by Elsevier B.V. This is an open access article under the CC BY-NC-ND license (http://creativecommons.org/licenses/by-nc-nd/4.0/).
Peer-review under responsibility of organizing committee of the Eleventh International Multi-Conference on Information Processing-2015 (IMCIP-2015) doi: 10.1016/j.procs.2015.06.035
ScienceDirect
Eleventh International Multi-Conference on Information Processing-2015 (IMCIP-2015)
Feature Selection and Classification of Microarray Data using
MapReduce based ANOVA and K-Nearest Neighbor
Mukesh Kumar
a,∗, Nitish Kumar Rath, Amitav Swain and Santanu Kumar Rath
Department of Computer Science and Engineering, National Institute of Technology Rourkela, Orissa 769 008, India
Abstract
The major drawback of microarray data is the ‘curse of dimensionality problem’, this hinders the useful information of dataset and leads to computational instability. Therefore, selecting relevant genes is an imperative in microarray data analysis. Most of the existing schemes employ a two-phase processes: feature selection/extraction followed by classification. In this paper, a statistical test, ANOVA based on MapReduce is proposed to select the relevant features. After feature selection, MapReduce based K-Nearest Neighbor (K-NN) classifier is also proposed to classify the microarray data. These algorithms are successfully implemented on Hadoop framework and comparative analysis is done using various datasets.
© 2015 The Authors. Published by Elsevier B.V.
Peer-review under responsibility of organizing committee of the Eleventh International Multi-Conference on Information Processing-2015 (IMCIP-2015).
Keywords: Big data; Classification; Gene selection; Hadoop; K-nearest neighbor; MapReduce; Microarray.
1. Introduction
Microarray based gene expression profiling has emerged as an efficient technique for cancer diagnosis, prognosis, and treatment purposes1. In recent years, DNA microarray technique has a great impact in determining theinformative genesthat cause cancer2, 3. The major drawback that exists in microarray data analysis is the curse of dimensionality problem, this hinders the useful information of dataset and leads to computational instability4. Therefore, the selection/extraction of relevant features (genes) remains an imperative in the analysis of microarray data of cancer.
A good number of feature (gene) extraction techniques and classifiers based on machine learning techniques have been proposed by various researchers and practitioners5–9. Meanwhile, recent developments in microarray chip technology, help in studying thousands/millions of genes simultaneously, generating a huge amount of data. Processing it, is a difficult task using a conventional system having standard computational power. The MapReduce programming model and its implementation on Hadoop framework has a substantial base for processing large datasets, in particular for high dimensional genomic data such as microarray data, in a distributed manner. Hadoop framework was developed by Doug Cutting in 200810. Apache Hadoop is an open source software, and provides a effective way of storing and processing huge data in a distributed fashion on large clusters of commodity hardware. It employs a master/slave architecture for both distributed storage and distributed computation; thus, it accomplishes two tasks, i.e., massive data storage and faster processing11.
∗Corresponding author.: Tel.: +91-8984142557.
E-mail address:a[email protected]
© 2015 The Authors. Published by Elsevier B.V. This is an open access article under the CC BY-NC-ND license (http://creativecommons.org/licenses/by-nc-nd/4.0/).
Peer-review under responsibility of organizing committee of the Eleventh International Multi-Conference on Information Processing-2015 (IMCIP-2015)
The parametric and non-parametric statistical tests are elegant procedures to analyze the behavior of data12. The statistical tests are used as a feature selection method by assuming the hypotheses, i.e., Null hypothesis and Alternate hypothesis. Based on the correctness of the hypothesis, the features are either selected or rejected. The K-Nearest Neighbor classifier provides a simple non-parametric procedure for the assignment of a class label to the input pattern based on the class labels represented by the K-nearest training samples13.
In this paper, MapReduce based statistical test, Analysis of variance (ANOVA) test has been proposed to select the relevant features in a dataset. Along with this feature selection technique, MapReduce based K-NN has been proposed to classify the microarray dataset. These algorithms are implemented to process for various microarray datasets. The performance of the algorithms are tested on Hadoop cluster with four slave (data) nodes and a conventional system.
The rest of the paper is organized as follows: Section 2 present the related work in this area. Section 3 presents the proposed work for selecting features and classifying the microarray data using ANOVA and K-NN based on MapReduce programming paradigm. Section 4 highlights the basic concepts of Hadoop and its components. Section 5 presents the implementation details for the proposed approach. Section 6 highlights on the results obtained, interpretation drawn from it and also presents the comparative analysis for gene classification of microarray data. Section 7 concludes the paper with scope for future work.
2. Related Work
A. K. M. Tauhidul Islamet al.14have proposed a MapReduce based parallel gene selection method, that utilizes
sampling techniques to reduce irrelevant genes by using Between-groups to Within-groups sum of square (BW) ratio. The BW ratio indicates the variances among gene expression values. After gene selection, it applies MRkNN technique to execute multiple kNN in parallel using MapReduce programming model. Finally, the effectiveness of the method is verified through extensive experiments using several real and synthetic datasets.
Shicai Wanget al.15have proposed a new method for calculating correlation and introduced an efficient algorithm based on MapReduce to optimize storage and correlation calculation. This algorithm is used as a basis for optimizing correlation value for high throughput molecular data (microarray data).
3. Proposed Work
This section presents an approach for classification of microarray data, which consists of two phases:
i. The input data is preprocessed using methods such as missing data imputation, normalization, and feature selection using ANOVA test based on MapReduce programming model.
ii. After selecting the relevant features, MapReduce based K-NN has been applied to classify microarray dataset into cancerous/non-cancerous sample.
The step wise description of the proposed work is, as follows: a. Data collection
The dataset for classification analysis, which acts as requisite input to the models is obtained from Kent Ridge Bio-medical Data Set Repository1and National center of Biotechnology Information (NCBI GEO,
http://www.ncbi.nlm.nih.gov/gds/).
b. Missing data imputation and normalization of dataset
Missing data of a feature (gene) in microarray dataset are imputed by using themeanvalue of the respective feature. Input feature values are normalized over the range [0,1] using Min-Max normalization technique16, 17. c. Division of dataset
The dataset is divided into two categories: training set and testing set as discussed in Section 6. d. Feature selection
MapReduce based ANOVA has been applied to select the features having high relevance value and thus the curse of dimensionality issue has been addressed.
e. Building classifier
MapReduce based K-NN has been built to classify the microarray dataset. f. Testing the model
Models are tested using the various test dataset and the performance of the classifier is evaluated. 4. Distributed Computing
Distributed computing techniques such as grid computing and cluster computing are in use for many years. Most of these work based on the message-passing model, while systems that run on parallel algorithms, such as the graphics processing unit (GPUs), are based on shared-memory model. The efficient working of these machines, calls for an interface enabling them to access shared file systems as well as maintain proper communication with other machines in the grid/cluster. Thus network bandwidth becomes a bottleneck for such machines. Hadoop addresses this problem by minimising the communication between different nodes.
4.1 Hadoop framework
Hadoop is an open-source software framework that provides for storing and processing of large data sets in a distributed fashion10. It has been designed to store data across all the nodes (servers) in a cluster, in a distributed manner by dividing the file into smaller entities called blocks. This enables each node to work according to the principle of proximity, i.e., to process the data available locally, leading to less network transmissions. In addition to this, it provides a low-cost and scalable architecture designed to scale up from a single server to a large number of servers. It’s design allows for detecting and handling failures at the application layer, thus, providing service even in error prone systems. There are three core components of the Hadoop framework. They are:
Hadoop Distributed File Systems (HDFS):It is a Java-based distributed file system that can store all kinds of data without prior organization, unlike in relational databases. Though it is similar to the existing distributed systems, there are significant differences. It can be deployed on low-cost commodity hardware. It consists of a Namenode and several Datanodes. The Namenode keeps the directory tree of all files in the file system, and tracks where, across the cluster, the file is stored. It does not physically store these files itself. In addition to this, the files stored in a Datanode are replicated on other Datanodes, thereby, allowing for speedy recovery in case of failure of a node18.
YARN:It is a resource management framework for scheduling and handling resource requests from distributed applications. YARN combines a central resource manager that manages the way applications use Hadoop system resources with node-manager agents that monitor the processing operations in individual cluster nodes. In the case of failure of a node, it reschedules the job to some other node19.
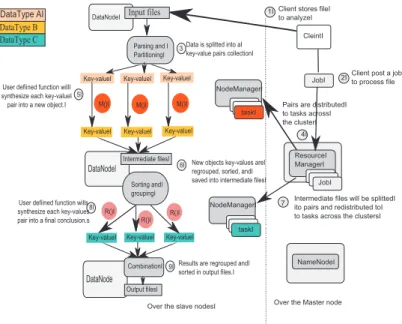
MapReduce:It is a programming model, developed by google, for processing large datasets in a distributed manner on clusters of commodity hardware20. It consists of 3 steps:
• Map step:Each node applies the map function (M()) to the local data, and writes the output to a temporary storage with a key value associated with the output.
• Shuffle step:Here the nodes redistribute data based on the output keys (produced by the map function), such that all data belonging to one key is located on the same node.
• Reduce step:Each node now processes each group of output data, per key, in parallel using reduce function (R()) and the output is then written to the HDFS.
Figure 1 shows the architecture of MapReduce and its life cycle. 4.2 Execution on Hadoop
To run the algorithms on Hadoop framework, they are divided into two phases viz., map and reduce. In the map phase, a mapper reads a line from the file (stored as blocks in the node). The mappers processes the input and calculates the required output (e.g. F-value in ANOVA or distance in K-NN, as discussed in Section 5). These values, along with their corresponding keys (Feature Id. in case of feature set), are written to an intermediary file. These are then sorted, shuffled and are sent to the reducers. The reducers process the input and write the obtained results into the HDFS.
Fig. 1. Life cycle of MapReduce.
For instance, if the input file is of size 550 MB and the HDFS has a block size of 128 MB, when the dataset (input file) is uploaded in to HDFS, it gets divided into 5 (550/128) blocks. The first four blocks will be of size 128 MB each, and last block will have a size of 38 MB. Further assuming that, split size is equal to block size, corresponding to five blocks, five mappers are formed. Mappers are executed on all Datanodes simultaneously and write their output to an intermediary file in the HDFS. The reducers perform further operations on the result obtained from the mappers and write the final result into the HDFS. The working of Map-Reduce is explained in the Fig. 1.
5. Implementation
In this section, the implementation of the proposed algorithms using MapReduce programming model on Hadoop framework is discussed.
5.1 Feature selection using MapReduce based ANOVA test
ANOVA test is used to compare the ‘multiple means’ values of the dataset, and visualize whether there exists any significant difference between mean values of multiple groups (classes). The statistic for ANOVA is called the F-statistic, which can be calculated using following steps:
(1) The variation between the group is calculated as:
Between sum of squares (BSS)=n1(X¯1− ¯X)2+n2(X¯2− ¯X)2+ · · · (1)
Between mean squares (BMS)=B SS/d f (2)
(2) The variation within the groups is calculated as:
Within sum of squares (WSS)=(n1−1)σ12+(n2−1)σ22+ · · · (3)
Within mean squares (WMS)=W SS/d fw (4)
whered f =degree of freedom,d fw=(N−k),σ=standard deviationN=Number of samples,k=Number of groups, andnk=no. of samples in groupk.
Algorithm 1. MapReduce based ANOVA.
(3) F-test statistic is calculated as:
F= B M S/W M S (5)
Algorithm 1 shows the implementation of ANOVA based on MapReduce paradigm.
The input to the algorithm is a matrix of the formN×M, whereNis the total number of feature sets andMis the number of samples in the dataset. As discussed earlier, the algorithms are divided into two parts, the map phase and the reduce phase. In the map phase each mapper, running on a Datanode, reads a line (feature set fi) from the block and calculates the required test statistic (Fi) and p-value along with the feature Id. (i) as a key-value pair (i, (Fi,pi)). It emits this pair into a intermediary file. The reducer then, based on the p-value, decides on whether to select or discard a feature set. It then emits out the selected feature set Ids ((f s1,f s2,f s3, . . . )).
5.2 MapReduce based K-nearest neighbor (K-NN) classification technique
The training dataset is loaded into all the mappers. Each mapper reads a sample data from the testing set and calculates theEuclideandistance between testing and training samples. It accumulates all the distance values from each training sample along with their class label. The mapper then emits the Id. of the testing sample and the distances into the file system. The reducer then sorts the distances in ascending order and selects theKnearest training samples. The testing instance is assigned to a class corresponding to the modal class ofKtraining samples as shown in Algorithm 2. The reducer then yields the instance Id. and the assigned class of testing sample.
6. Results and Interpretation
In this section, the obtained results are discussed for the proposed algorithms (Section 3) on various microarray datasets. The performance of the classifier are measured using the various parameters like:
• Classification matrix:It provides the statistics for the number of correct and incorrect predictions made by a classification model compared with the actual classifications of the samples in the test data.
• Accuracy: It measures the percentage of samples in the dataset that the classifier has correctly classified.
• Processing efficiency:It is defined as the number of features processed per second. It is calculated by dividing the total number of features by the total time taken for processing by the system (Hadoop cluster or conventional system).
Algorithm 2. MapReduce based K-nearest neighbor.
6.1 Experimental setup
The proposed algorithms have been executed on a Hadoop cluster consisting of one master node and four slave nodes. Five commodity PCs connected with 10/100 M switch are used in the experiment, the configuration is as follows:
• Hardware configurations
– The Master node: Name Node 1, CPU intel core i5, 3.2 GHz×4, RAM 8 GB, Hard disk 250 GB – The Slave node 1: Data Node 1, CPU intel core i7, 3.4 GHz×8, RAM 12 GB, Hard disk 500 GB – The Slave node 2: Data Node 1, CPU intel core i7, 3.4 GHz×8, RAM 10 GB, Hard disk 500 GB – The Slave node 3: Data Node 1, CPU intel core i5, 3.2 GHz×4, RAM 8 GB, Hard disk 250 GB – The Slave node 4: Data Node 1, CPU intel core i5, 3.2 GHz×4, RAM 8 GB, Hard disk 250 GB • Software requirements – Ubuntu 14.04 – JDK 1.7 – Hadoop 2.6 – Python 2.7 6.2 Dataset used
The proposed algorithms ate tested against publicly available large datasets taken from NCBI GEO. The summary of dataset is tabulated in Table 1
6.3 Analysis of feature selection using MapReduce based ANOVA test
To select relevant features from the datasets, ANOVA-test is applied. This method is applied separately on each feature of the microarray data, assuming that there is no interaction between the classes (or groups). The statistical tests
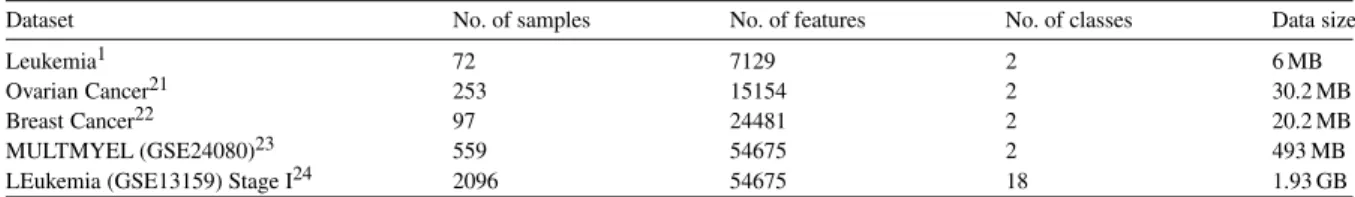
Table 1. Microarray dataset used.
Dataset No. of samples No. of features No. of classes Data size
Leukemia1 72 7129 2 6 MB
Ovarian Cancer21 253 15154 2 30.2 MB
Breast Cancer22 97 24481 2 20.2 MB
MULTMYEL (GSE24080)23 559 54675 2 493 MB
LEukemia (GSE13159) Stage I24 2096 54675 18 1.93 GB
Table 2. Execution details of ANOVA feature selection methods on Hadoop cluster. Dataset (Block size) Number of
Mapper/ Reducer Time (each Mapper) Time (each Reducer) Total Time (Hadoop cluster) (S) Conventional time Processing efficiency (Hadoop) (S−1) Processing efficiency (Con. Mac. (S−1)) No. of Reduced features Leukemia (16 MB) 2/1 2 4 17 2 419.35 3564.5 568 Ovarian (16 MB) 2/1 4 3 22 5 688.80 3030.80 5352 Breast (16 MB) 2/1 4 1 22 6 1112.80 4080.30 231 MULTMYEL (16 MB) 15/1 5 4 27 26 2025 2187 83 LEukemia (32 MB) 28/1 5 7 58 100 976.30 719.40 43604
Fig. 2. Comparison of execution time on Hadoop cluster (#) and conventional system (∗).
consider two hypothesis, i.e., Null hypothesis and alternate hypothesis. The Null hypothesis assumes that the mean of the classes are same, i.e., there is no significant difference between the proprieties of various groups; while the alternate hypothesis is that, there exists some significant difference between the groups (or classes). The Null hypothesis (H0)
implies that the features do not affect the classification result. Hence, these features can be discarded. On the contrary, the alternate hypothesis (H1) implies that the features have significant difference between their properties. Hence they
are accepted.
ANOVA test has been applied on each feature and the corresponding p-value is a measure of how effective it is at separating groups. By considering the 99.9% of confidence interval (CI), if the p-value is less than 0.001, the null hypothesis is rejected and alternate hypothesis is accepted. Sorting these features according to theirp-values helps to identify the features with strong representation.
The proposed feature selection technique is executed on Hadoop cluster and on a conventional system. The execution details like the block size, number of mapper, time taken by each mapper and reducer, total time in seconds (S) taken by Hadoop cluster and conventional system is tabulated in Table 2. This Table also shows the number of selected features, which have strong discriminating capacity to distinguish the samples into different classes.
The comparison between the time taken by the Hadoop cluster and a conventional system is given in Fig. 2. From this figure, it is clear that when data size is small, the time taken by the Hadoop cluster is more than the time taken by a conventional system. But, as the size of data grows, the time taken by the Hadoop cluster is much less than that for the conventional system.
6.4 Analysis of MapReduce based KNN classifier
After feature selection, the proposed classification algorithm MapReduce based K-NN has been applied to classify the datasets. However, unless one has some knowledge of the dataset, it is difficult to decide on the optimal number of
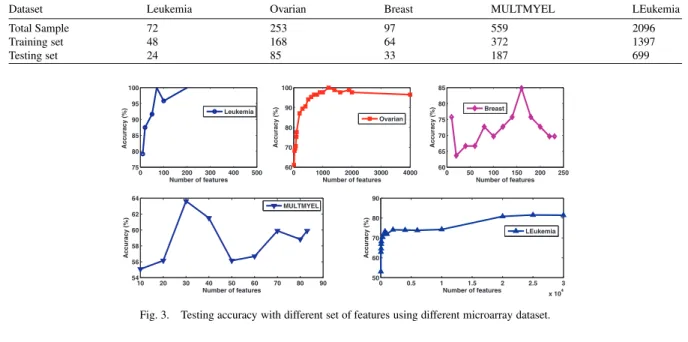
Table 3. Number of training and testing samples.
Dataset Leukemia Ovarian Breast MULTMYEL LEukemia
Total Sample 72 253 97 559 2096
Training set 48 168 64 372 1397
Testing set 24 85 33 187 699
Fig. 3. Testing accuracy with different set of features using different microarray dataset. Table 4. Classification matrix for K-NN classifier with ANOVA feature selection method using various dataset.
features required for classification. To overcome this problem, the forward feature selection method is considered, in which top ranked features corresponding to ascending p-values are used. Different subsets of the top ranked features are used to classify the microarray dataset using MapReduce based K-NN and their corresponding classification accuracies are computed.
When the samples are sequentially selected, the model designed may be over-trained or under-trained. This is because the samples selected for training may contain either only cancerous or only non-cancerous samples. To avoid this, the reduced datasets are divided for training and testing purposes in the following way: every third sample is extracted for testing purpose and the rest of the data samples are used for training samples. After partitioning the dataset into a training set and testing set, model selection is performed by varying the parameterK∈[1,N] of K-NN whereNis the number of samples in the training set. By varying the value ofK, the best model (with high accuracy or minimum error) is selected for the corresponding dataset.
The details about the total number of samples and their distribution into training and testing is given in Table 3. Figure 3 gives the variation of accuracy for different cancer datasets, obtained by varying the value ofK. The peak accuracy is obtained when the number of features are 70, 1200, 160, 30, 25000 atk =3, 1, 15, 7, 19 for Leukemia, Ovarian, Breast, MULTMYEL and LEukemia cancer dataset respectively. After attaining the peak, the accuracy of K-NN classifier either remains constant or reduces from maximum accuracy. Therefore, to avoid the curse of dimensionality problem, the features corresponding to the peak accuracy are used and the performance parameters are evaluated. The classification matrices corresponding to the peak accuracies for the datasets are drawn and shown in Table 4. Table 4a, 4b, 4c, 4d and 5 represent the classification matrix for Leukemia, Ovarian, Breast, MULTMYEL, and LEukemia cancer dataset respectively.
Table 5. Classification matrix for K-NN classifier with ANOVA using LEukemia dataset (K=19, f=25,000).
Table 6. Execution details of K-NN classifier on Hadoop cluster (with 4 slaves) and conventional system. Dataset (Block size) Number of
Mapper/ Reducer Time (each Mapper) Time (each Reducer) Total Time (Hadoop cluster) (S) Conventional time Processing efficiency (Hadoop) (S−1) Processing efficiency (Con. Mac. (S−1)) Lukemia (16 MB) 1/1 2 2 14 0.79 5 88.67 Ovarian (16 MB) 1/1 11 2 31 21.5 38.7 55.81 Breast (16 MB) 1/1 3 5 20 0.8 8 200 MULTMYEL (16 MB) 1/1 3 5 18 2.96 1.67 10.1 LEukemia (16 MB) 15/1 1361 1782 3302 24279 7.57 1.02
Table 6 represents the execution details, i.e., number of mappers and reducers, time taken by each mapper and reducer, and total time taken in seconds (S) of K-NN classifier on the Hadoop cluster with four slave nodes. The block size is taken as 16 MB. Then, the total time taken by K-NN on Hadoop cluster is compared with the time taken by a conventional system. From the obtained result, it is inferred that, when the data size is small, Hadoop cluster takes more time than the conventional system to complete the job, but as the size of data increases, Hadoop cluster take very less time than a conventional system.
7. Conclusion
In this paper, an attempt has been made to design the classification model for classifying the samples of various datasets into their respective class labels. A K-NN classifier and feature selection using ANOVA test based on MapReduce programming model have been developed. The proposed approach works in a distributed manner on scalable clusters. The performance of the classifier for various datasets are evaluated by varying the value of Kand number of features (f). The major contributions of this paper are
i. Harnessing the power of distributed computing for better storage and faster processing of datasets.
ii. Comparative analysis between the size of datasets and the time taken for processing using a conventional system vs. Hadoop cluster.
Further, this work can be extended by considering the applicability of machine learning techniques such as support vector machine (SVM), Logistic regression (LR), and Naive Bayes, etc. using MapReduce programming paradigm on Hadoop framework.
References
[1] T. R. Golub, D. K. Slonim, P. Tamayo, C. Huard, M. Gaasenbeek, J. P. Mesirov, H. Coller, M. L. Loh, J. R. Downing, M. A. Caligiuri, et al., Molecular Classification of Cancer: Class Discovery and Class Prediction by Gene Expression Monitoring,Science, vol. 286(5439), pp. 531–537, (1999).
[2] Y. F. Leung and D. Cavalieri, Fundamentals of CDNA Microarray Data Analysis,TRENDS in Genetics, vol. 19(11), pp. 649–659, (2003). [3] M. Flores, T. Hsiao, Y. Chiu, E. Chuang, Y. Huang and Y. Chen, Gene Regulation, Modulation, and their Applications in Gene Expression
Data Analysis,Advances in Bioinformatics 2013, pp. 360678–360678, (2013).
[4] G. Lee, C. Rodriguez and A. Madabhushi, Investigating the Efficacy of Nonlinear Dimensionality Reduction Schemes in Classifying Gene and Protein Expression Studies, Computational Biology and Bioinformatics,IEEE/ACM Transactions on, vol. 5(3), pp. 368–384, (2008). [5] K. E. Lee, N. Sha, E. R. Dougherty, M. Vannucci and B. K. Mallick, Gene Selection: A Bayesian Variable Selection Approach,
Bioinformatics, vol. 19(1), pp. 90–97, (2003).
[6] Y. Peng, W. Li and Y. Liu, A Hybrid Approach for Biomarker Discovery from Microarray Gene Expression Data for Cancer Classification, Cancer Informatics, vol. 2, pp. 301, (2006).
[7] L. Wang, F. Chu and W. Xie, Accurate Cancer Classification using Expressions of very Few Genes, IEEE/ACM Transactions on Computational Biology and Bioinformatics (TCBB), vol. 4(1), pp. 40–53, (2007).
[8] K. Deb and A. Raji Reddy, Reliable Classification of Two-Class Cancer Data using Evolutionary Algorithms,BioSystems, vol. 72(1), pp. 111–129, (2003).
[9] J. C. H. Hernandez, B. Duval and J.-K. Hao, A Genetic Embedded Approach for Gene Selection and Classification of Microarray Data, In: Evolutionary Computation, Machine Learning and Data Mining in Bioinformatics, Springer, pp. 90–101, (2007).
[10] T. White, Hadoop: The Definitive Guide,O’Reilly Media, Inc., (2012). [11] C. Lam, Hadoop in Action, Manning Publications Co., (2010).
[12] D. J. Sheskin, Handbook of Parametric and Nonparametric Statistical Procedures, crc Press, (2003).
[13] M. Kumar and S. K. Rath, Microarray Data Classification using Fuzzyk-Nearest Neighbor, In: International Conference on Contemporary Computing and Informatics (IC3I),IEEE, pp. 1032–1038, (2014).
[14] A. T. Islam, B.-S. Jeong, A. G. Bari, C.-G. Lim and S.-H. Jeon, Mapreduce based Parallel Gene Selection Method,Applied Intelligence, pp. 1–10, (2014).
[15] S. Wang, I. Pandis, D. Johnson, I. Emam, F. Guitton, A. Oehmichen and Y. Guo, Optimising ParallelrCorrelation Matrix Calculations on Gene Expression Data using Mapreduce,BMC Bioinformatics, vol. 15(1), pp. 351, (2014).
[16] Y. K. Jain and S. K. Bhandare, Min Max Normalization based data Perturbation Method for Privacy Protection,International Journal of Computer & Communication Technology (IJCCT), vol. 2(8), pp. 45–50, (2011).
[17] M. Kumar and S. Kumar Rath, Classification of Microarray Data using Kernel Fuzzy Inference System, International Scholarly Research Notices 2014 (Article ID 769159), pp. 18, (2014).
[18] D. Borthakur, The Hadoop Distributed File System: Architecture and Design, Hadoop Project Website, vol. 11, pp. 21, (2007).
[19] A. C. Murthy, V. K. Vavilapalli, D. Eadline, J. Niemiec and J. Markham, Apache Hadoop YARN: Moving Beyond MapReduce and Batch Processing with Apache Hadoop 2, Pearson Education, (2013).
[20] J. Dean and S. Ghemawat, Mapreduce: Simplified Data Processing on Large Clusters,Communications of the ACM, vol. 51(1), pp. 107–113, (2008).
[21] E. F. Petricoin III, A. M. Ardekani, B. A. Hitt, P. J. Levine, V. A. Fusaro, S. M. Steinberg, G. B. Mills, C. Simone, D. A. Fishman, E. C. Kohn, et al., Use of Proteomic Patterns in Serum to Identify Ovarian Cancer,The Lancet, vol. 359(9306), pp. 572–577, (2002). [22] L. J. van’t Veer, H. Dai, M. J. Van De Vijver, Y. D. He, A. A. Hart, M. Mao, H. L. Peterse, K. van der Kooy, M. J. Marton, A. T. Witteveen,
et al., Gene Expression Profiling Predicts Clinical Outcome of Breast Cancer,Nature, vol. 415(6871), pp. 530–536, (2002).
[23] M. Consortium, et al., The Microarray Quality Control (maqc)-ii Study of Common Practices for the Development and Validation of Microarray-Based Predictive Models,Nature Biotechnology, vol. 28(8), pp. 827–838, (2010).
[24] T. Haferlach, A. Kohlmann, L. Wieczorek, G. Basso, G. Te Kronnie, M.-C. B´en´e, J. De Vos, J. M. Hern´andez, W.-K. Hofmann, K. I. Mills, et al., Clinical Utility of Microarray-Based Gene Expression Profiling in the Diagnosis and Subclassification of Leukemia: Report from the International Microarray Innovations in Leukemia Study Group,Journal of Clinical Oncology, vol. 28(15), pp. 2529–2537, (2010).