Evaluation of inspection intervals based on Damage Tolerance Analysis
improved by XFEM Method
Ralf Trieglaff1, Detlef Rieck2, Axel Schulz3 and Robert Wernicke4
1Senior Expert, TÜV NORD SysTec GmbH & Co. KG, Hamburg, Germany ([email protected]) 2Senior Expert, IGN NORD GmbH & Co. KG, Greifswald, Germany
3Senior Expert, TÜV NORD SysTec GmbH & Co. KG, Hamburg, Germany
4Dr., Head of Dept. Strength Analysis, TÜV NORD SysTec GmbH & Co. KG, Hamburg, Germany
INTRODUCTION
The evaluation of inspection intervals for thick-walled thermo-cyclic loaded components in nuclear power plants often is based on a Damage Tolerance Analysis. In general a Standard Damage Tolerance Analysis is based on simplified fracture mechanics models (plate, cylinder) and simplified initial crack assumptions. The loads to be considered are forces/moments of piping calculations and stress profiles through the thickness as result of linear-elastic finite element analyses. Requirements for the non-destructive in-service inspection regarding the potential crack location are usually based on the results of strength calculations and of testing experience.
New requirements from the worldwide energy supply
The worldwide energy supply will become a highly dynamic field in the near future due to a strongly increasing feed-in of volatile, renewable energy (photovoltaic and wind power). Nuclear power plants are therefore required to contribute to a compensation of load fluctuations. Consequently steep load gradients and high numbers of cycles are demanded from nuclear plants.
Within the main power range (60 to 100 %) these load changes are conducted with constant, medium coolant temperature. Exceeding load changes can be conducted easily but require a decrease of the coolant temperature, Ludwig et al. (2010).
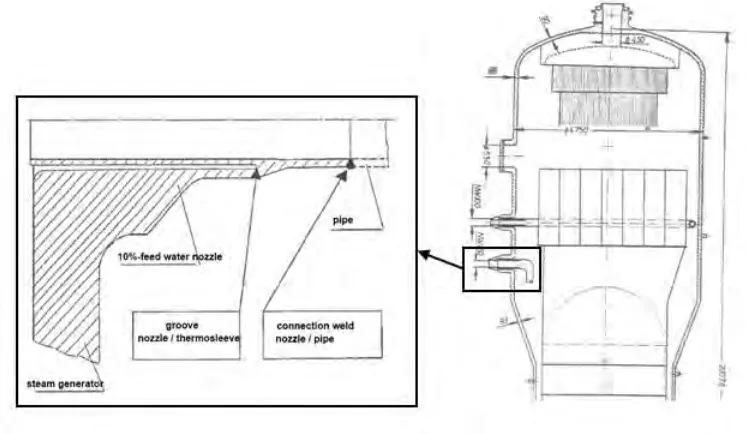
Hence, the loads increase particularly for the pressurizer, the volume control system and the steam generator. The mastering of numerous load changes has already been considered during the conception phase of nuclear power plants (installation of thermo-sleeves in the nozzles).
Following an example of a 10%-feed water nozzle of a steam generator with integrated thermo sleeve shows that the Damage Tolerance Analysis, in addition to the usual fatigue assessment, effectively contributes to the assessment of transient loads.
The crack propagation analysis as part of the Damage Tolerance Analysis is an effective way to assess high fatigue utilization of components through methods of the linear-elastic fracture mechanics. The crack propagation analysis allows including further life-cycle reserves of components beyond the fatigue analysis. It is done by calculating the in-service inspection intervals mathematically.
New requirements in the German nuclear code KTA 3201.4
It is a general requirement in the German nuclear code KTA 3201.4 “In-service inspections and operational monitoring of the reactor coolant pressure boundary of light water reactors” that operational data that are important regarding the integrity of the components of the reactor coolant pressure boundary shall be monitored.
If operating conditions occur that are not covered by the specified load regime, their causes shall be determined and these operating conditions shall be evaluated with special regard to their safety-relevant effects. If these operating conditions may affect component fatigue, it is necessary to recalculate the predicted cumulative usage factor in accordance with the calculation procedure of the German nuclear code KTA 3201.2 “Design and analysis of components of the reactor coolant pressure boundary of light water reactors”. In KTA 3201.4 levels of attention related to the cumulative usage factor are introduced in order to consider the environmental affected fatigue issue.
If the influence of the fluid on component fatigue is to be expected and in accordance with KTA 3201.2 the exclusive measure to consider the fluid influence was the incorporation of the relevant component areas in a monitoring program to KTA 3201.4, for austenitic steels the levels of attention is D = 0.2 and for ferritic steels D = 0.4. If the influence of the fluid on component fatigue can be excluded, the levels of attention is D = 0.9.
When these levels of attention are reached, it shall be ensured that the progress of fatigue is kept within safe permissible limits by appropriate measures taken with respect to operation, operational monitoring or in-service inspections, or by a combination of these measures.
To this end, proof shall be rendered that no crack formation has been detected by non-destructive testing and fracture mechanic analyses of postulated incipient cracks in due consideration of the fluid influence prove that there will only be a limited crack propagation in the time period until the next, maybe premature, in-service inspection.
A tool to fulfill these requirements is to perform a Damage Tolerance Analysis presented in the following.
GUIDELINES FOR THE ASSESSMENT PROCEDURE
The target of our investigation is with a combined application of XFEM methods and downstream crack propagation analyses to evaluate inspection intervals and test specifications for components in nuclear power plant. The XFEM (Extended Finite Element Method) represents a modern, elegant technique for determining the potential crack location, the crack geometry and the crack propagation to be expected in the component. In the process, the location and the arrangement of a crack are determined independently of the mechanism of the damage (plastic deformation as a consequence of permanent stress or dislocation creep due to load changes). As a result, reliable input parameters for the successive crack growth analyses are provided.
Figure 1 shows at the right side the steps of the assessment procedure and at the left side the required fracture mechanics input parameter.
This assessment procedure is demonstrated at a 10%-feed water nozzle of a steam generator (see fig. 2).
Figure 2. 10%-feed water nozzle of a steam generator
To note is that alternatively to a CFD-flow simulation it is possible to calculate in finite element programs directly the temperate distribution based on derived “sample transients” developed with the knowledge about the operation condition and a comparison with specified transients.
CFD-FLOW SIMULATION AND STRESS ANALYSIS BASED ON FEM (FSI)
In the first step of our assessment procedure we usually use Fluid/Structure Interaction (FSI) capabilities to simulate real-world heat transfer conditions within plant components. The results are more realistic assessments of component stresses.
FSI utilizes transients of temperature, pressure and mass flow as input parameters. This data is gathered through the evaluation of the operational instrumentation or, if available, on the basis of the measurements of an online monitoring system (see fig. 3).
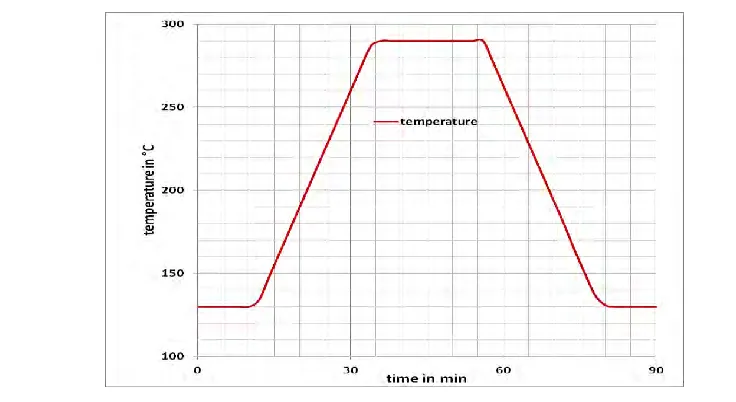
Figure 3. Measured transient developments
Figure 4. Derived "threshold transients"
Based on the flow simulation, the flow velocity and thus the heat transfer cycles and inner wall temperatures at each location of the wall surfaces are determined for each point in time. For this purpose, the complete recording of the real geometry and the exact calculation of the temperature and pressure depending material parameters of the medium are required. Based on this flow simulation, the temperature distributions are determined for each point in time of the transient in the component wall. We have presented this procedure for a cross-type valve of a main steam line of a coal-fired power plant in Rieck et al. (2012).
For the 10%-feed water nozzle of a steam generator the analyzed load event shows high mass flow condition and an axi-symmetric load distribution. For that reason we performed directly a transient temperature analysis in Abaqus®. Figure 5 shows the finite element model idealized in the finite element
software Abaqus®.
Figure 5. Finite element model in Abaqus®
With this procedure, the real component geometry and the temperature-dependent material parameters are considered.
Figure 6. Temperature distribution in the component at 34 min
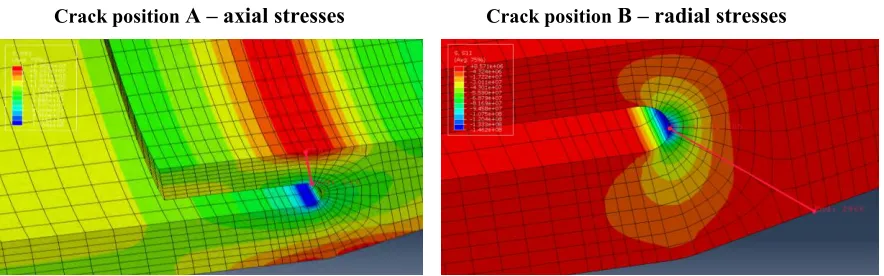
In figure 7 and figure 8 the stress distribution in the component determined in this manner is shown based on a defined point in time (34 min) of the "threshold transient". To calculate the stress range of the load event in figure 9 is shown the stress along the stress classification line (red lines in figure 7,8).
Crack position A – axial stresses Crack position B – radial stresses
Figure 7. Maximum stress distribution close to the groove – cold feed
Crack position A – axial stresses Crack position B – radial stresses
Figure 8. Maximum stress distribution close to the groove – hot feed
Crack position A Crack position B
Figure 9. Stress distributions along the stress classification lines
FRACTURE-MECHANICS ANALYSES – XFEM
Using the XFEM method the location and the arrangement of the crack are determined independently of the mechanism of the damage (plastic deformation as a consequence of permanent stress or dislocation creep due to load changes). As a result, reliable input parameters for the successive crack growth analyses are provided.
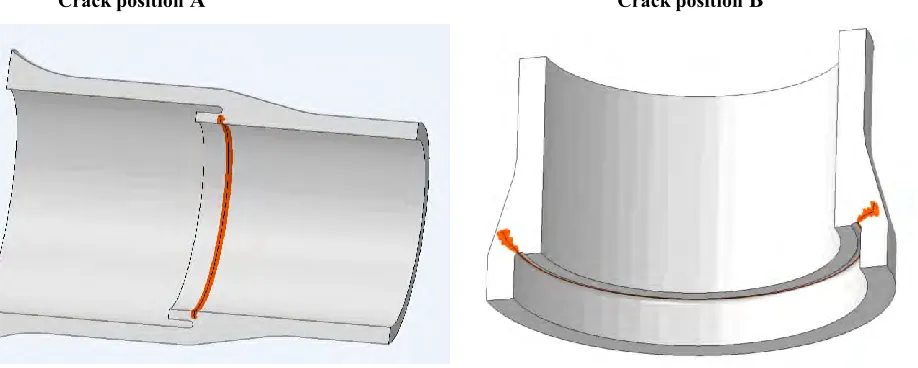
For the load scenario of a cooling transient investigated here, the crack initiation criterion (crack initiation stress MAXPS) is reduced to the extent that the crack formation is initiated by computer. For the crack position A the crack starts from the internal surface of the thermo sleeve and for the crack position B the crack initiates in the groove.
After the crack initiation, the XFEM calculation shows an intensive crack growing through the wall of the thermo sleeve (crack position A) and through the nozzle (crack position B), due to the rather axi-symmetric stress field.
The calculated crack growth very precisely follows load-type “Mode-I” as a result of the dominance of the axial stresses near the interior surface for the crack position A and a combination of axial and radial stresses for crack position B. The XFEM calculation additionally comprises potential changes of the crack growth direction with increasing crack lengths.
Crack position A Crack position B
The location of the crack initiation as well as the resulting shape of the crack proved to be relatively independent of the selected value of the crack initiation stress MAXPS (200– 600 MPa) for the present application. This is significant for the applicability of XFEM within the procedure.
Moreover, the transfer of the crack shape characteristics determined by means of XFEM as a starting point for the successive crack growth analyses is supported by the thesis that the quasi-static loads of the XFEM calculation produce at least a comparable, similar crack shape as the cyclic loads of the crack growth analysis.
FRACTURE-MECHANICS ANALYSES – J INTEGRAL
In the procedure presented here, XFEM is used to determine the potential crack position, the crack geometry and the expected propagation of the crack, but not for the quantification of the J integral and the stress intensity factor KI along the arising crack front. For this the contour-integral calculation in
Abaqus® could be used. But this approach requires the remodeling of the crack geometries determined
with XFEM in the scope of the "classic" FEA.
The calculation of the J integral values serves for the adjustment and verification of the analytical fracture-mechanics calculations by means of IWM-VERB. We have presented this procedure in Rieck et al (2012). In that paper is shown a comparison of the stress intensity factors at the crack tip determined from the contour-integral solutions in Abaqus® with the solutions generated for various crack half-axis
ratios by using the analytical facture mechanics program IWM VERB® on the basis of the stress
distribution determined with a FE- model without a crack.
In the approach described here, this way was not necessary, because the idealization of a cylinder with a full circumferential internal surface crack is very close to the real problem.
FRACTURE-MECHANICS ANALYSES - FATIGUE CRACK PROPAGATION
For the implementation of numeric crack growth analyses with justifiable computing time, only analytical calculation programs are currently available, such as IWM VERB®; a direct crack propagation
simulation with cyclic loads does not currently appear to be possible with XFEM. This is the fundamental motivation for the interaction of FEM, XFEM and analytical fracture-mechanics analysis presented in the current application example, as shown on the right side of figure 1. However, this also reveals the obvious motivation for the continuation of research like Mutschler et al. (2012) for the further development and application testing of XFEM.
For the crack propagation rate as necessary input for the crack growth calculations we used the well-known curves and equations for ferritic steels exposed to water environments from ASME Boiler and Pressure Vessel Code, Section XI, Appendix A (2010 Edition).
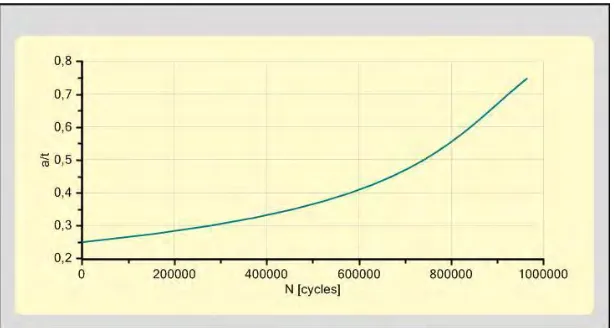
Figure 11 includes the results of the crack propagation calculations for a circumferential crack in crack position A. For the postulated crack in position B the propagation characteristics are quite similar.
As an initial crack depth, a = wall thickness t / 4 was postulated and in the end of the calculation the planned operating time was surpassed more than 100 times over with the excessive value 106 as the
number of load cycles till the allowable crack depth of ¾ t is reached.
Moreover, the very small crack propagation rate increases only slightly with increasing crack depth. This effect becomes more clearly when looking at the differential crack propagation rate da/dN as shown in figure 12.
Figure 12. Differential crack propagation rate for crack position A
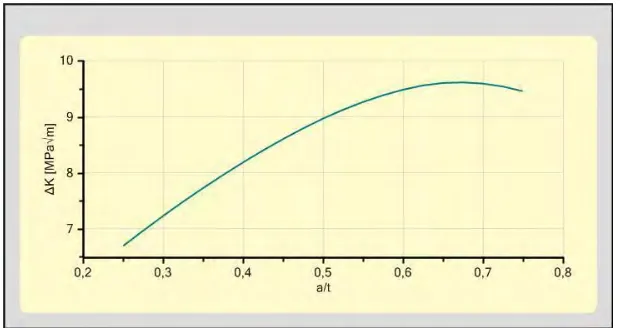
The cause for the decreasing crack propagation rate at increasing crack depth is the reduction of the range of the stress intensity factor K(a), recognizable in Figure 13 for greater crack depths. This is a result of the fact that thermal stress peaks only occur in the inner wall areas and rapidly drop to the wall centre towards the exterior surface, as shown in figure 9.
Figure 13. Stress intensity factor range depending on crack depth for crack position A
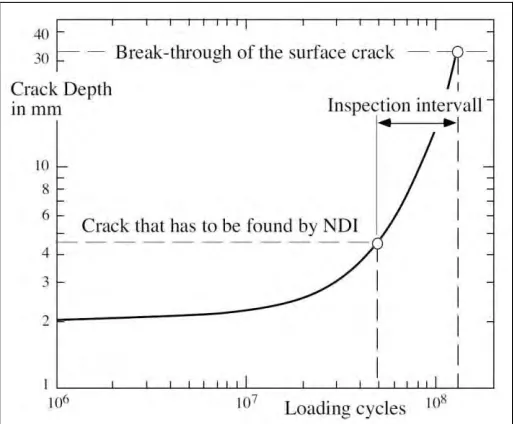
The dominance of local thermal stresses is clearly a beneficial factor for the applicability of the Damage Tolerance concept for thermo-cyclic loaded structures, which becomes even more obvious when comparing figures 11 to 13 with other representations of the fatigue crack propagation, such as figure 14 (from Zerbst (2005)).
Figure 14 shows the typical outlines of an optimization of the intervals of the in-service inspection in the scope of a Damage Tolerance Analysis.
strongly increasing crack propagation velocity at larger crack depths – in contrast to our present case as shown in figures 11 to 13.
Figure 14. Crack growth analysis and determining of inspection interval (from Zerbst (2005)) In our present study the defined initial crack configurations cannot actually reach the critical crack depth by fatigue crack propagation, which is larger than ¾ t and only insignificantly below the wall thickness.
So, in our case the safety margin between maximum possible grown crack depth after the last in-service inspection and the critical crack depth is not necessary to be defined – it is intrinsic!
For the detectable crack depths, the safety against crack instability is guaranteed, also with respect to further fatigue crack propagation. Therefore, a shortening of in-service inspection intervals is not necessary, even if the fatigue levels of attention acc. to the rules (KTA 3201.4) are passed. Following that, the inspection intervals can be retained on the basis of the standard in-service inspection program of the steam generator.
CONCLUSIONS
This assessment procedure gives the possibility for focused non-destructive in-service inspection and a more accurate Damage Tolerance Analysis, which is particularly suitable for thermo-cyclic loaded structures. On the basis of fracture-mechanics analyses, an evaluation of the risk potential can take place in regard to the crack fatigue propagation of highly stressed component areas. Based on these results, an optimization of the in-service inspection intervals and measures is possible.
REFERENCES
Abaqus®/CAE 6.11-1 (2011). Dassault Systèmes, USA
ASME Boiler and Pressure Vessel Code, Section XI, (2010 Edition). “Rules for In-service Inspection of Nuclear Power Plant Components American Society of Mechanical Engineers”
IWM VERB® Version 8.0, 2009, Failure Assessment Software, IWM Fraunhofer-Institut für
KTA 3201.4 (2010-11). “Components of the Reactor Coolant Pressure Boundary of Light Water Reactors Part 4: In-service Inspections and Operational Monitoring”
KTA 3201.2 (1996-06). “Components of the Reactor Coolant Pressure Boundary of Light Water Reactors; Part 2: Design and Analysis”
Ludwig, H., Salnikova, T., Waas, U. (2010) “load change ability of German nuclear power plants“, atw magazine no. 55, issue 8/9
Mutschler, P., Schulz, A., Rieck, D., Sander, M. (Feb. 2012) „Determining the Permissible Inspection Interval for an Optimised Twistlock on the Basis of Fracture Propagation Analyses with ABAQUS (XFEM)”, 44th DVM-AK Fracture Processes Conference, Darmstadt
Rieck, D., Schulze, A., Schulz, A., Trieglaff, R. (2012). “TÜV NORD GROUP strategy concept COOP - an answer for the new requirements of the power plant flexibilisation”, PVP2012-78345, ASME PVP 2012, July 15-19, Toronto, CANADA