A b s t r a c t
SHEIK NAINAR, MOHAMED ASHRAF ALI. The Effects of Gain Adaptation for QoS Deterioration in Internet-based Teleoperation Involving Use of a Virtual Reality Interface. (Under the direction of Dr. David B.Kaber)
The goals of this study included evaluating the affects of different types of communication network delays on remote-control rover (telerover) performance, operator telepresence experiences and workload. The study also evaluated the utility of gain adaptation for communication delays on telepresence, performance and workload. Finally, the work examined the relationship between performance and subjective presence in an Internet-based teleoperation scenario utilizing a virtual reality (VR) interface. Telepresence has been identified as a design ideal for teleoperation systems; and task environment factors, such as disturbances in human-machine interaction, have been identified as potential underpinnings of presence experiences.
telerobotic control mode. Subject exposure to various network conditions was randomized. Presence questionnaire and the NASA Task Load Index were used to capture subjective telepresence and workload ratings, respectively, at the end of each test trial.
Results revealed that LOA, delay, adaptation and the interaction of LOA and a variable describing the overall network condition (a combination of delay and adaptation) significantly affected TTC. The telerobotic control mode produced the best TTC irrespective of the delay type and adaptation. Both delay types combined with adaptation produced the worst TTC within each LOA, as compared to all other network conditions. Performance errors/collisions were significantly affected by LOA, delay and adaptation. The telerobotic control mode produced the greatest number of errors and the adaptation conditions were superior to no-adaptation conditions. The constant delay produced more errors than the random delay type.
Both telepresence and workload were significantly affected by LOA and individual differences with telerobotic control producing higher telepresence ratings along with lower workload scores.
achieving and sustaining telepresence. Although changes in telepresence across the adaptation and no-adaptation conditions under telerobotic control were inline with this hypothesis, similar results were not found with teleoperation control.
THEEFFECTSOFGAINADAPTATIONFORQOS
DETERIORATIONININTERNET-BASEDTELEOPERATION
INVOLVINGUSEOFAVIRTUALREALITYINTERFACE
by
MOHAMEDSHEIKNAINAR
A thesis submitted to the Graduate Faculty of North Carolina State University
in partial fulfillment of the requirements for the Degree of
Master of Science
COMPUTER ENGINEERING
Raleigh 2002
D e d i c a t i o n
B i o g r a p h y
Mohamed Ashraf Sheik Nainar was born in a small town called Nagore, in the state of Tamil Nadu in the southern part of India. He was raised in Madras (now called Chennai), where he completed his high school education in 1994. He later joined the University of Madras for a Bachelor of Engineering in Mechanical Engineering and graduated in 1998. Following graduation, he joined Caborundum Universal Ltd., an abrasive manufacturing company as a Graduate Engineer Trainee.
A c k n o w l e d g e m e n t
TABLE OF CONTENTS
List of Tables...vii
List of Figures ...viii
Glossary...ix
1. Introduction...1
1.1 Computers and Virtual Environments...3
1.2 Communication Medium...5
1.3 Disturbances from the Real-World Environment ...7
1.4 Task Factors ...7
2. Internet-based Telerobotics...8
2.1 History of Internet-based Telerobots...8
2.2 Communication Protocols...9
2.3 General Limitations of the Internet...10
2.4 Internet-based Teleoperation versus Conventional Teleoperation ...11
2.5 Quality of Service ...12
3. Motivation and Problem Statement ...13
4. Virtual Reality Interface...16
4.1 Schematic of the VR Interface...16
4.1.1 Main Controller...16
4.1.2 Local Controller ...18
4.1.3 Telerover ...18
4.1.4 Network...18
4.2 Main Controller Adaptation...19
4.3 Interface Design ...19
5. Methodology...22
5.1 Task...22
5.2 Independent Variables...24
5.3 Dependent Variables ...26
5.4 Subjects...27
5.5 Experimental Design ...27
5.6 Procedures ...28
7. Results...35
7.1 Performance ...35
7.1.1 Time-to-Task Completion ...35
7.1.2 Number of Errors/Collisions ...37
7.1.3 Potential Advantages of Gain Adaptation ...40
7.2 Telepresence...41
7.3 Workload ...42
7.4 Correlation Analysis...44
8. Discussion ...46
8.1 Performance ...46
8.1.1 Time-to-Task Completion ...46
8.1.2 Number of Errors/Collisions ...47
8.2 Telepresence...49
8.3 Workload ...50
9. Conclusion ...52
9.1 Limitations of Current Research ...52
9.2 Design Implications...54
9.3 Future Research Directions...54
10. References...56
Appendix A: Mathematical Model of the System ...62
Appendix B: Presence Questionnaire...69
Appendix C: NASA-TLX Workload Survey ...70
Appendix D: Anthropometric Data Survey...72
Appendix E: Subject Instructions...73
Appendix F: Informed Consent...83
L i s t o f T a b l e s
Table 5.1 Data collection table based on experimental design...28
Table 5.2 Training protocol ...29
Table 5.3 Testing protocol ...29
Table 7.1 F-values and p-values from ANOVA on error as response
measure – Full Model...38
Table 7.2 F-values and p-values from ANOVA on error as response
measure – Reduced Model ...39
Table 7.3 Pearson product moment coefficients for telepresence and
workload ratings ...44
L i s t o f F i g u r e s
Figure 4.1 Schematic of the VR interface...17
Figure 4.2 Zones in aerial window for view panning and destination selection using crosshairs...21
Figure 4.3 VR interface for telerover navigation...21
Figure 5.1 Exocentric view of telerover navigation...24
Figure 5.2 Aerial view of telerover navigation...24
Figure 5.3 Histogram of random delays generated for the experiment...26
Figure 7.1 Mean TTC for LOA groups by each network condition...36
Figure 7.2 Mean TTC under various network conditions grouped by LOA ...37
Figure 7.3 Average collisions for different LOA groups by network condition..39
Figure 7.4 Average collisions for different network conditions grouped by LOA ...40
Figure 7.5 Effects of gain adaptation on TTC and errors under the two LOAs ...41
Figure 7.6 Average telepresence ratings for different LOAs grouped by Network conditions...42
Figure 7.7 Average workload index for different LOAs grouped by Network conditions...43
Figure A.1 Block diagram of Main controller and Local controller...62
G l o s s a r y
ADAC Advanced Diagnosis and Control Laboratory
ANOVA Analysis of Variance
ATM Asynchronous Transfer Mode
CA Constant delay with adaptation
CNA Constant delay with no-adaptation
DOF Degree of Freedom
FPS Frames Per Second
GUI Graphical User Interface
HMD Head Mounted Display
HSD Honestly Significant Difference
IEC International Engineering Consortium
IPV6 Internet Protocol Version 6
ISO International Standards Organization
ITU-T International Telecommunication Union – Telecom
Standardization
LOA Level of Automation
MPLS Multi-Protocol Label Switching
ND No-delay
PQ Presence Questionnaire
QoS Quality of Service
RA Random delay with adaptation
RNA Random delay with no-adaptation
RSVP Resource Reservation Setup Protocol
SE Synthetic Environments
SBM Subnet Bandwidth Manager
SSQ Simulator Sickness Questionnaire
TCP Transmission Control Protocol
TLX Task Load Index
TTC Time-to-Task Completion
UDP User Datagram Protocol
VE Virtual Environment
VR Virtual Reality
C h a p t e r 1
INTRODUCTION
Synthetic Environments (SE) have been defined as computer-generated worlds used to facilitate human interaction with an environment that is physically separate from the user and to allow human perceptual, cognitive and psychomotor capabilities to be projected into normally inaccessible, hostile or simulated situations (Draper, Kaber & Usher, 1999). Virtual Environments (VE) and teleoperation interfaces have been classified as forms of SE. In 1965, Ivan Sutherland presented a program of research in computer graphics, which has challenged and guided the field of VE research and development (Sutherland, 1965). According to Sutherland, the display screen is a window through which one can behold a virtual world. Real-time interactive graphics with three-dimensional models, combined with a display technology that gives the user immersion in the model world and direct manipulation of virtual objects, is called Virtual Reality (VR) (Bishop & Fuchs, 1992). Teleoperation means to operate a system from a remote location. The remote location may be in the next room (e.g., a “hot cell” in a nuclear laboratory) or may be on another planet (e.g., space exploration). The first teleoperator, a mechanical pantograph, was developed in Argonne National Laboratory in 1940 by a group headed by R. Goertz. Since then, teleoperation research has advanced rapidly with innovations in computation and communication. Typical applications include space exploration, military surveillance and reconnaissance, medical surgery, industrial mining, etc.
environments like the exploration of the sunken Titanic, surveying of the collapsed reactor in Chernobyl, etc.
Traditionally, the remote work-package, or robotic system, as part of a teleoperator integrates video cameras, which provide visual feedback to the operator through a visual display. The operator plans the motion of the system based on telemetry data and sends motion control commands to the remote system. Typically, these types of systems have minimal on-board intelligence and hence, performance is largely dictated by the remote operator.
The drawbacks associated with video-based feedback in teleoperation include performance problems due to temporal disturbances in communications (long delays). For example, communication delays in earth-based control of the NASA Mars rover, Sojourner, were estimated to be as great as tens of minutes (Hine, Hontalas, Fong, Piguet, Nygren & Kline, 1995).
To alleviate the above-mentioned problem, sophisticated interfaces for teleoperation have become increasingly important. In applications like exploration or remote reconnaissance, human-robot interaction is the main feature driving the application (Fong, Thorpe, & Baur, 2001). Thus, it is critical to design effective interfaces to create truly integrated and efficient human-robot systems (Fong et al., 2001). Virtual environment or VR technology have been used in recent researches to create multi-modal, intuitive and effective interfaces to teleoperation systems by taking advantage of the bandwidth of human sensory channels to a greater extent than it is possible with conventional display technologies (Hine et al., 1995).
performance of tasks. This sensation has been labeled as telepresence. Telepresence, the perception of presence within a physically remote or simulated site, has been identified as a design ideal for VEs and SEs in general, including interfaces for teleoperation systems (Draper, Kaber & Usher, 1998). It has been hypothesized by many researchers that telepresence shares a positive relationship with virtual task performance or teleoperation and, consequently, SEs and teleoperator design for telepresence has been advocated. Researchers have performed numerous studies to investigate the sense of presence (telepresence) within virtual environments in order to identify underlying factors in the phenomenon (Nash, Edwards, Thompson & Barfield, 2000). Work had focused on display factors that influence or enhance the feeling of actually being part of a VE (Nash et al., 2000).
Sheridan (1992) identified five variables that potentially contribute to inducing a sense of telepresence. Three of them are technological, including the extent of sensory information, control of sensors relative to the environment and the capability to modify the physical environment. The other two are context based, including the task difficulty and the level of system automation. Nash et al. (2000) also developed a classification scheme for the factors affecting presence, including five major categories – computers and virtual environments, communication medium, individual characteristics, disturbances in the real-world (surrounding) environment and the task. Each of the following subsections provides a description of these major categories and specific factors in telepresence experiences:
1.1 Computers and Virtual Environments:
the modalities in order to control the work package. The VE interface, in addition to being a tool for remote space visualization, serves as a model of the robot’s world and, thus, can be used to display the current status of the system and real-world objects in the remote environment (Simsarian, 2001). Some of the VR system factors potentially influencing telepresence include the breadth and depth of information presentation through system interfaces, as well as the responsiveness of the VE interface and the extent to which it represents the real remote environment. Each of these factors is discussed here.
1.1.1 Breadth. Breadth is the number of sensory channels used simultaneously to present information to a user (Steuer, 1992). The more sensory modalities used, the greater telepresence experiences are expected to be. This is because more information is provided to the user and because the individual is more isolated from the external world (Witmer & Singer, 1994).
1.1.2 Depth. Depth refers to the resolution of each sensory stimuli provided to a user (Steuer, 1992). It is hypothesized that more depth could lead to greater presence in a SE, if the depth provided through a sensory modality is essential to the task (Barfield & Weghorst, 1993).
1.1.3 Resolution. Resolution refers to the realism of the information presented through the SE (Simsarian, 2001). This quality of the VE or teleoperator interface may be manipulated through each sensory modality. As an example of the visual modality, Riley and Kaber (1999) recommended that high-resolution displays be used to maximize user perceptions of VE vividness and telepresence. Hendrix and Barfield (1996) reported that high-resolution stereoscopic cues along with head tracking increased presence significantly in an exploration type task.
Singer, 1994). This means that the context of the VE interface is predictable in its behavior such that the user can adapt to it.
1.1.5 Speed. The update rate of the controls and the displays can affect presence. A frame time of 50ms or 20 fps (frames per second) is acceptable for many applications.
1.1.6 Range. The range of interactivity refers to the number of attributes of the SE that can be manipulated and the amount of variation possible within each attribute (Steuer, 1992). The greater the capability of the user to affect and change the VE, the greater is the expected telepresence (Witmer & Singer, 1994).
1.1.7 Mapping. Mapping refers to the capability of a system to map its controls to changes in the mediated environment (SE) in a natural and predictable manner (Steuer, 1992). It is assumed that better mapping will lead to better telepresence because the user will not have to think about how to create the control actions he or she wishes to perform to achieve a specific teleoperation goal.
1.2 Communication Medium
1.2.1 Individual (User). No matter how good the hardware or simulation, the sense of presence is still ultimately dependent on the person who must perceive and interpret the information as part of a SE. Limited data is available on how different individuals feel present even in the real world, so it is difficult to come to a consensus on the concepts purported to affect virtual presence in an individual (Nash et al., 2000).
1.2.2. Adaptability. Adaptability refers to the speed at which persons adjust to new circumstances, such as moving to a new country, experiencing a new form of travel for the first time, etc. (Slater & Usoh, 1993). Researchers have found a strong negative correlation between the sense of presence and human adaptability to change. Quick adapters take greater notice of their surroundings and, thus, may notice more faults in the VE than slow adapters do, ultimately leading to lower reported levels of presence (Slater & Usoh, 1993).
1.2.3 Experience and practice. It has been suggested that the sense of virtual presence might increase with more experience and practice in a virtual task or in use of a VE. It has been shown that presence has a positive correlation with VR system and VE familiarity (Barfield & Weghorst, 1993).
1.2.4 Motivation. The willingness of the individual to interact with the environment and accept the environment are both important determinants of presence. It has been hypothesized that more motivation will lead to a greater sense of presence and a greater allocation of attentional resources (Witmer & Singer, 1994).
1.3 Disturbance from the real-world (surrounding) environment
A user’s sense of immersion and presence in a VE may be degraded when real-world stimuli are present. These stimuli may serve as an attentional distraction; thus, less attention is focused on the VE (Draper et al., 1998). Alternatively, the computer and VE itself could be affected if the computer is connected to a corporate network and the network becomes busy or slows down (Nash et al., 2000). The current research will focus on this particular type of disturbance. More details on the potential role of network parameters in telepresence experiences in using SEs for teleoperation are provided later.
1.4 Task
C h a p t e r 2
INTERNET BASED TELEOPERATION
The Internet connects millions of computers all over the world, giving access to communication, data storage, banking, commerce, video conferencing and numerous such services and applications. It can eliminate traditional communication barriers, such as long-distance and time constraints, and, therefore, provide us with a new working environment where people living in different parts of world can work together collaboratively (Song & Kaber, 2000). The Internet, on account of its affordability, widespread usage, exten-sive applications and well-developed infrastructure, has been investigated as an alternative for remotely controlling real-time systems including robotic systems for teleoperations such as tele-manufacturing, tele-training, tele-services, etc.
2.1 History of Internet based-Telerobots
telerobot at Manchester (Nehmzow, Buhlmeier, Durer & Nolte, 1996), an interactive 3D art viewing system (Goldberg, Becky, Akatsuka & Bressanelli, 1998), the VISIT telerobot system (Kosuge, Kikuchi & Takeo, 1998) and “MAX” wireless teleoperation system (Ferwon, Roque & Vecchia, 1999).
Hu, Yu, Tsui and Zhou (2001) classified all of the above mentioned teleoperation system as first generation Internet-based telerobots, since they were directly controlled by human operators and they have minimal “on-board automation.” Future Internet-based telemanipulation systems are expected to integrate human control with some system autonomy to promote overall web-based teleoperation performance and user control satisfaction. Teleoperators with some degree of “on-board” automation are often referred to as telerobots. Simsarian (2001) claims that these “semi-autonomous” telerobots are far more superior in complex task performance in unstructured environments than, for example, fully autonomous robots.
2.2 Communication Protocols
Internet-based control systems must rely on available communication protocols to exchange real-time data between local and remote sites. Today, most network protocols provide transparent and reliable support for data exchange among computers using the Transmission Control Protocol (TCP). This protocol provides a full-duplex stream service, with automatic error handling, retransmission, packet re-ordering and guarantee of safe delivery. However, from the point of view of a real-time application, like Internet-based teleoperation and telerobot control, this protocol has the drawback of unpredictable data arrival times.
receiving processes, and therefore it is not a blocking protocol. However, UDP does not guarantee data delivery, since it provides no feedback from the receiver about lost data packets.
Unfortunately, the TCP mechanisms ensuring data delivery cannot be de-activated or ignored and therefore real-time applications cannot be implemented using the TCP protocol. The UDP is a potential protocol for real-time applications, since it is designed for single-datagram exchange and offers faster access to networks (Comer, 2000). However, the UDP also relies on packet-switched techniques to send data over the network, and is therefore affected by delay jitter on data arrival. That is, data sent at a constant rate over a packet-switched network may arrive to destinations with a variable inter-arrival time. This jitter is due to the combined effects of buffering in routers and of different routing policies.
2.3 General limitations of the Internet
Beyond these specific problems with Internet protocols, other general drawbacks of the Internet that may negatively affect teleoperation performance and the potential for human operator telepresence experiences include:
Throughput: Bandwidth may be limited and vary depending upon network congestion.
Delay: Random time varying delay (jitter) may occur depending upon network traffic.
This research will focus on the delay limitation in teleoperation applications. More details on the types of protocols and delays to be studied are provided later.
2.4 Internet-based teleoperation versus conventional teleoperation:
Many of the problems in Internet-based teleoperation applications are not prevalent in conventional teleoperation scenarios involving the use of dedicated network links between a local control station and a remote work package.
Hu et al. (2001) differentiated Internet-based teleoperation from conventional teleoperation as follows:
1. The delay and the throughput of the Internet are highly unpredictable, unlike traditional teleoperation, where the interfaces have fixed and guaranteed delays.
2. Web-based teleoperation requires a high degree of tolerance to possible data packet loss due to packet discard when there is no existing remedy.
3. Internet robots need innovative mechanisms for coping with shared control among multiple web users with different applications in mind.
4. Internet robots are remotely operated by people with little expertise and skills, while traditional telerobots are typically handled by trained operators.
The current research will also examine specific differences in Internet-based teleoperation and conventional teleoperation on remote task performance and user telepresence experiences.
2.5 Quality of Service
C h a p t e r 3
MOTIVATION AND PROBLEM STATEMENT
Unfortunately, few, if any current studies on Internet-based telerobotics have considered a human factors perspective in designing or evaluating approaches to system compensation or adaptation to network delays. For example, research has not been conducted on the human performance or telepresence implications of a gain adaptation scheme in an Internet-based teleoperation. Beyond this, the integration of intuitive VE interfaces in teleoperation systems for facilitating presence experiences and performance with complex gain adaptation schemes has not been considered. The general objective of the current research was to evaluate one such implementation from a human factors perspective.
The Advanced Diagnosis and Control Laboratory (ADAC) at North Carolina State University has developed a networked mobile robot using the gain adaptation technique proposed by Tipsuwan and Chow (2001). According to this technique, when there is a change in the network delay or throughput, the adaptation scheme automatically adapts the gain of the system controller in order to reduce the impact of lag on system performance. The current research evaluated this adaptation scheme as to its effectiveness in terms of human performance and presence. A three-dimensional high fidelity VR interface was developed, which was run as a stand-alone application for conducting experiments. The specific objective of the experiment was to establish the effectiveness of the adaptation scheme under a variety of time-delay conditions, which have been identified through previous research to cause problems in human performance.
degradation in performance compared to no-adaptation and would also greatly influence the sense of presence perceived by the user.
This research tested three types of delay including, no-delay (a control condition), constant delay and random delay. The no-delay condition is the idealistic condition and was studied to provide optimal points of comparison in terms of performance and presence. The constant delay condition simulated a dedicated network with predictable, deterministic delay. Finally, the random delay condition was used to study the effect of a simple model of Internet-based telerobot control. The constant and random delay conditions were tested with and without the use of the adaptation scheme. Each subject experienced all the delay conditions in random order under either of two modes of remote robot control – teleoperation and telerobotic. More details on these control modes are presented later in the Methodology section.
C h a p t e r 4
VIRTUAL REALITY INTERFACE
The VR interface used in this research was developed using Sense8’s WorldUpTM VE development software. The package integrates an easy-to-use graphical user interface for object creation, property specification and simulation design along with a BasicScript editor to add behaviors to objects. The VR simulation was based on the telerover developed by the ADAC laboratory. The mathematical model of the rover kinematics and the gain adaptation scheme were based on the model developed by Tipsuwan and Chow (2001) and are presented in Appendix A. This model was applied in the development of the VE interface.
4.1 Schematic of the VR Interface
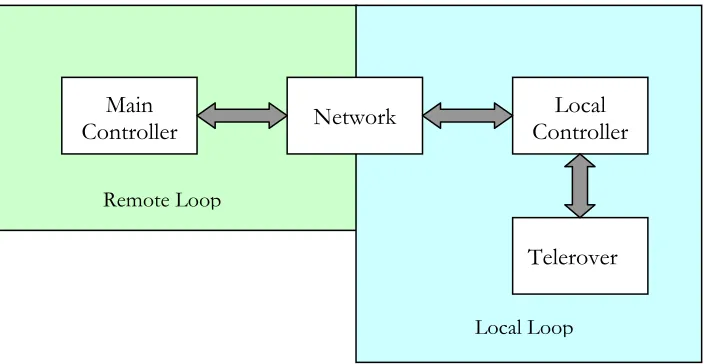
The VR interface developed was a self-sufficient simulation, including the main controller, network, local controller and the telerover. Figure 4.1 shows a schematic of the functions implemented in the VR simulation. The following sub-sections present detailed descriptions of each of the components of the VR interface and the overall teleoperation system
4.1.1 Main Controller
Figure. 4.1. Schematic of the VR Interface.
In the case of the telerobotic control mode, the user specified a target location and the controller computed the motion path using a quadratic path-tracking algorithm (Yoshizawa, Hashimoto, Wada & Mori, 1996). This algorithm lends itself to real-time applications because of its simplicity in computation with a minimal amount of information (Tipsuwan & Chow, 2001). The algorithm works as follows:
(1) identify initial distance between current robot position and reference point. (2) compute error between them and transform error into telerover
coordinates.
(3) find a quadratic curve between robot’s coordinate and reference point. (4) compute reference linear and angular velocities of telerover along quadratic
curve.
(5) update distance for next sampling time.
(6) compute velocity of reference point along desired path based on actual velocity of telerover; and
Main Controller
Telerover
Network Local
Controller
Remote Loop
(7) compute new reference point on desired path based on current reference point velocity;
The mathematical representation for the above algorithm can also be found in Appendix A. In this control mode, the telerover did not have the capability to automatically detect and avoid collision with task objects in the VE.
4.1.2 Local Controller:
The local controller was composed of two Proportional-Integral (PI) controllers. Each PI controller controlled the speed of one driving wheel of the rover. The control gains used to control both motors were set to be the same since the motors at both wheels were assumed to have the same characteristics. The signals from the main controller were the reference angular velocities of the wheels.
4.1.3 Telerover:
The telerover was a differential drive mobile robot with two driving wheels and one caster wheel. The kinematics of the telerover and its parameters are given in Appendix A.
4.1.4 Network:
4.2 Main Controller Adaptation
In order for the telerover to track the path properly under a nominal network QoS condition and constraints on performance, three adaptation parameters α, β, and dmax were set appropriately. These parameters represented the main controller adaptation, the reference position projection, and maximal distance between the robot and reference point, accordingly, and are explained in detail in Appendix A. When QoS deterioration occurred, the settings of the gains might not remain suitable for the network condition and robot state. The telerover might deviate from the reference path to an unacceptable track because of improper speed and projected reference points. Thus, the telerover has to gracefully degrade its performance by adapting itself to maintain its stability as much as possible under the current network QoS. This adaptation was applied to the main controller of the teleoperation system. Extensive experiments were conducted to determine a range of values for α, β, and dmax within the delay bounds of 700ms – 1300ms. Linear approximation was then used to arrive at a particular value based on the average delay observed between time periods. The general objective of the adaptation was to limit system performance errors and maintain system safety. This research was expected to demonstrate the effectiveness of gain adaptation under the different rover control modes and delay conditions for maintaining accurate performance and promoting operator telepresence.
4.3 Interface Design:
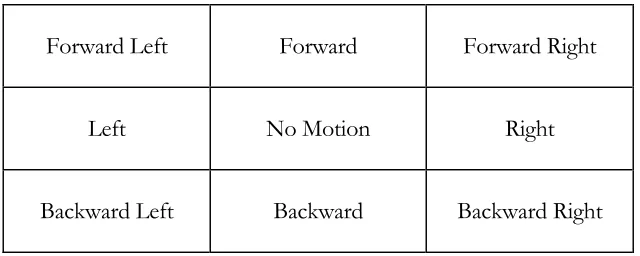
The aerial view was integrated to provide a better overall sense of the environment and to facilitate operator judgments of the position of the rover relative to task objects. It also provided features like panning and zooming of the displayed view. When the right mouse button was clicked and held down over the aerial window, the display panned based on the position of the cursor such as forward, backward, left and right, as well as combinations of these directions. The aerial view could be zoomed by clicking and holding the middle mouse button in the upper-half of the window for zoom-in or lower-half of the window for zoom-out. Additionally, this window was utilized in the telerobotic control mode to select a destination for the rover to navigate. This was done by moving virtual crosshairs on the display. Clicking and holding the left mouse button in the appropriate position on the display produced the desired motion. The direction of motion of the crosshairs was dependent on the position of the cursor on the aerial window as depicted in Figure 4.2. The crosshairs are visible in Figure 4.3 as an “x” in the aerial window and main window (see the virtual object to the front-right of the rover).
Forward Left Forward Forward Right
Left No Motion Right
Backward Left Backward Backward Right
Figure 4.2 Zones in aerial window for view panning and destination selection using crosshairs.
C h a p t e r 5
METHODOLOGY
In an attempt to further knowledge on how factors external to VE simulations affect the sense of presence and performance of tasks through SEs, an experiment was designed to study the various network-induced delays and the use of the different levels of automation in a teleoperation scenario. In this study, the participants were asked to perform a simulated teleoperation task using the telerover connected to a simulated Internet or private network. Performance data was collected during the experiment, which included time-to-task (TTC) completion and the number of control errors (collisions). The VR interface was presented using Virtual Research (VR8) head-mounted display to provide binocular depth cues on the VE to subjects.
5.1 Task
nearest red neighbor to a blue obstacle, a user was still required to navigate between the blue and black obstacle to clear the blue obstacle (i.e., turn it green). The goal of the task was to convert all blue obstacles in the environment to green. The total time required to complete a set of obstacles and the number of collisions were recorded during simulation trials.
In the teleoperation control mode, the joystick navigation control was used to control the speed and direction of the rover. The speed could be increased or decreased by a left click or right click of mouse button, respectively and by pointing the cursor at the top of the arrow representing the desired direction of navigation. Five clicks of the left mouse button throttled the rover to its maximum speed, while five clicks of the right mouse button brought the rover to a stop. Additionally, the left or right mouse button could be clicked at the center of virtual joystick control to stop the rover.
Figure 5.1. Exocentric view of telerover navigation.
Figure 5.2. Aerial view of telerover navigation.
5.2 Independent Variables
manual control, and telerobotic, or shared control. Finally two settings of control gain adaptation were used including adaptation (ON) and no-adaptation (OFF).
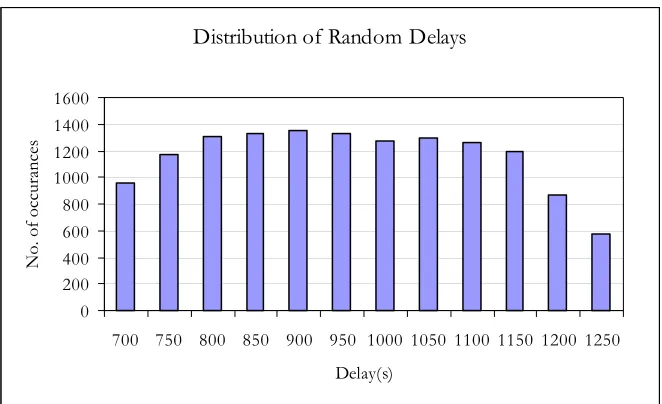
Typical delays in teleoperation system communication networks cause lag between the time the user initiates an action and the time the action is reflected at the remote work package. It has been demonstrated in a number of studies that increased lag results in decreased performance and presence. MacKenzie and Ware (1993) argued that lag has been shown to degrade human performance in motor-sensory tasks with interactive systems. They found that at 75ms lag, an effect can be easily measured, and at 225ms, performance is substantially degraded. Watson, Walker, Ribarsky and Spaulding (1998) claim that a mean delay of 259ms, with a standard deviation of 83ms, has a major negative effect on performance. Eberst, Stoffler, Barth & Farber (1999) said that a delay of 250ms is easily recognized by human operators, while a delay of about 1000ms tremendously impairs performance. The lag, which was explored in this study, was on the order of 1000ms ± 300ms. A lag of 1000ms was used for constant delay, while a lag of 700ms – 1300ms was used for random delay.
Distribution of Random Delays
0 200 400 600 800 1000 1200 1400 1600
700 750 800 850 900 950 1000 1050 1100 1150 1200 1250
Delay(s)
No. of
occurances
Figure 5.3. Histogram of random delays generated for the experiment.
5.3 Dependent Variables
The dependent measures of interest in this study included performance, telepresence and workload. As previously mentioned, both the efficiency and effectiveness of teleoperation task performance were recorded during the experiment. The time-to-navigate through the entire set of obstacles and the number of navigation errors/collisions with obstacles were captured by the workstation running the simulation.
In order to assess the task workload experienced by subjects during the test trials, the NASA-Task Load Index (TLX) subjective workload survey (Appendix C) was administered. Subjects completed a subjective comparison of demand factors (mental, physical, temporal, performance, frustration and effort) once before the beginning of the test trials and rated the subjective perceived workload at the end of each test trial. The rankings and ratings of the demand components were used to compute a composite index of workload for the telerover navigation task (a weighted sum of the ratings across all demands).
5.4 Subjects
Thirty-two subjects were recruited from the graduate and undergraduate student population at NC State University for participation in this study on a voluntary basis. Appendix D presents an anthropometric data survey that was used in the study to record subject characteristics, such as personal computer (PC) and PC-based video game experiences. This information was used to characterize the subject sample. There were 29 male subjects and 3 female subjects. The average age was 23.72 years. All the subjects had 20/20 vision without correction. As part of the anthropometric data survey, the subjects were asked to rate their prior experience with PCs, in general, and PC-based video gaming using a five-point scale with “1” equal to no experience and “5” equal to frequent experience. The average rating for PC usage and PC games were 3.125 and 5.0, respectively.
5.5 Experimental Design
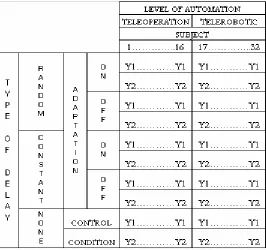
control mode. Half of the subject sample experienced teleoperation control mode and the remaining half used telerobotic control mode. LOA was handled as between-subjects variable in order to limit the potential of training carry over effects from one mode of control to another. The entire experimental design was replicated once. Thus, two trials were conducted under each delay– adaptation combination, which produced 10 trials per subject. Table 5.1 shows the complete data collection table for the experiment and specifically the distribution of subjects across the experimental conditions.
Table 5.1. Data collection table based on experimental design.
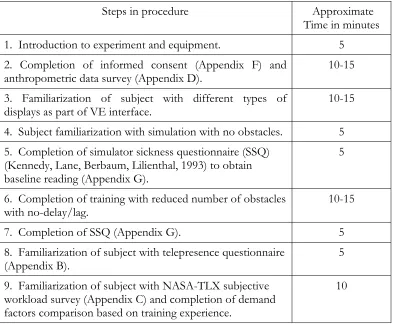
5.6 Procedures
Steps in procedure Approximate Time in minutes
1. Introduction to experiment and equipment. 5
2. Completion of informed consent (Appendix F) and anthropometric data survey (Appendix D).
10-15
3. Familiarization of subject with different types of
displays as part of VE interface. 10-15
4. Subject familiarization with simulation with no obstacles. 5 5. Completion of simulator sickness questionnaire (SSQ)
(Kennedy, Lane, Berbaum, Lilienthal, 1993) to obtain baseline reading (Appendix G).
5
6. Completion of training with reduced number of obstacles with no-delay/lag.
10-15
7. Completion of SSQ (Appendix G). 5
8. Familiarization of subject with telepresence questionnaire
(Appendix B). 5
9. Familiarization of subject with NASA-TLX subjective workload survey (Appendix C) and completion of demand factors comparison based on training experience.
10
Table 5.2. Training Protocol.
Step in procedure Approximate
Time in minutes 1. Each subject experienced 10 trials of approximately 5-7
minutes. Trials were separated by a 2-minute break.
50-70
2. At the end of each trial, the telepresence questionnaire
and NASA-TLX rating form were administered. 20-30
3. After the 5th trial, the SSQ was administered followed by
a 5-minute break. 5-10
complete the entire experiment. The specific instructions to subjects as part of the experiment are presented in Appendix E. Each of the steps presented in Tables 5.2 and 5.3 is covered in the Appendix E.
5.7 Hypotheses
This research primarily assessed the impact of network/communication delays in teleoperation on human operator performance, presence experiences and perceived workload. It was expected that when there was an increase in delay/lag, performance would degrade, or TTC and the number of errors would increase, with a corresponding decrease in presence and increase in workload.
To offset the impact of lag on user performance and perceived presence, the concept of gain adaptation was explored. When network delays increased, the telerover controller would automatically adapt its gain (or speed) to maintain safe and accurate performance and system stability. This adaptation of gain was expected to increase TTC, but limit the number of performance errors (collisions) in comparison to the conditions involving no-adaptation. It was also hypothesized that when there was deterioration in the network QoS, adapting the gain would result in a less significant decrease in presence ratings than when no-adaptation was used to account for the lag. Thus, the adaptation conditions were expected to result in higher presence ratings compared to the no-adaptation conditions.
telerover and hence when there was an adaptation to network QoS deterioration, the user perceived a drop in navigation speed. This would increase task completion time and was expected to cause user frustration with system performance resulting in reduced presence and increased workload. In general, it was hypothesized that subjects using telerobotic control would experience less deterioration of presence and lower workload compared to those using teleoperation control.
C h a p t e r 6
DATA ANALYSIS
According to the experimental design, LOA was treated as between-subjects variable, and network delay and adaptation were handled as within-subjects variables. All statistical analyses were performed using SAS. They included multi-way analyses of variance (ANOVA) applied to the dependent variables to investigate the influence of the delay type, LOA and adaptation on the sense of telepresence and task performance. The entire experiment was replicated once. The full statistical model is as follows:
k j k i j i i l k j i m l k j
i LOA D A SUB LOA LOA D LOA A D A
Y, , ,, =µ+ + + + ( )()+ ⋅ , + ⋅ , + ⋅ ,
+D⋅SUB(LOA)j,l(i)+A⋅SUB(LOA)k,l(i) +LOA⋅D⋅Ai,j,k
+D⋅A⋅SUB(LOA)j,k,l(i)+εm(i,j,k,l)
where,
µ = Mean
m l k j i
Y, , ,, = Response variable.
i
LOA = Level of Automation.
j
D = Delay type.
k
A = Adaptation.
) (
)
(LOA li
SUB = Subject nested within LOA.
j i D
LOA⋅ , = Interaction between LOA and Delay.
k i A
LOA⋅ , = Interaction between LOA and Adaptation.
k j A
D⋅ , = Interaction between Delay and Adaptation.
) ( ,
)
(LOA jli
SUB
) ( ,
)
(LOA kli
SUB
A⋅ = Interaction between Adaptation and Subject
nested within LOA.
k j i A D
LOA⋅ ⋅ , , = Interaction between LOA, Delay and Adaptation. ) ( , , )
(LOA jkli
SUB A
D⋅ ⋅ =Interaction between Delay, Adaptation and
Subject nested within LOA.
) , , ,
(ijkl
m
ε = Error
i = 1, 2
j = 1, 2
k = 1, 2
l = 1,….,32
m = 1, 2
This model was used to make comparisons between teleoperated and telerobotic control under the various lag conditions. Since adaptation was not relevant to the no-delay control condition, data collected on this setting of the delay type was not analyzed using the full statistical model (i.e., there wasn’t a complete crossing of the delay type and adaptation settings). The full statistical model allowed for separate analyses of the delay and adaptation main effects.
where,
i
LOA = Level of Automation.
j
NC = Network condition – combination of type of
delay and adaptation, which include no-delay (ND), constant with adaptation (CA),
constant with no-adaptation (CNA), random with adaptation (RA) and random with no- adaptation (RNA).
) (
)
(LOA k i
SUB = Subject nested within LOA.
j i NC
LOA⋅ , = Interaction of LOA and Network condition.
) ( ,
)
(LOA jki
SUB
NC⋅ = Interaction of Network condition and Subject nested within LOA.
C h a p t e r 7
RESULTS
7.1 Performance
The two measures used to assess the performance of subjects in the virtual telerover navigation task – TTC and number of collisions were analyzed using both the full statistical model and reduced statistical model (for comparison of the various network settings with the control condition).
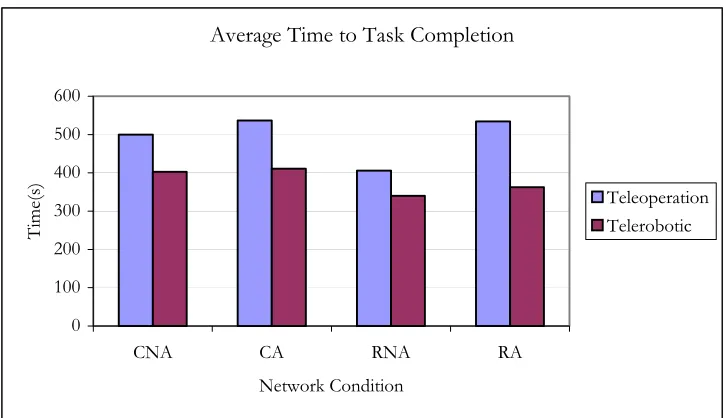
7.1.1 Time-to-task completion
The results of ANOVA on the full statistical model revealed significant main effects of LOA (F(1,255) = 44.61, p<0.0001), delay (F(1,255) = 8.54, p<0.01) and adaptation (F(1,255) = 8.88, p<0.01) on TTC. Figure 7.1 shows the TTC across different network conditions under the two LOAs. The network condition in the plot is the combination of delay type and adaptation. There were four different network conditions compared in the analysis including: CNA, CA, RNA, and RA.
Average Time to Task Completion
0 100 200 300 400 500 600
CNA CA RNA RA Network Condition
Ti
me(
s) Teleoperation
Telerobotic
Figure 7.1. Mean TTC for LOA groups by each network condition.
Average Time to Task Completion
0 100 200 300 400 500 600
Teleoperation Telerobotic Level of Automation
Ti
me(
s)
ND CNA CA RNA RA
Figure 7.2. Mean TTC under various network conditions grouped by LOA.
The two-way interaction between LOA and NC suggested that the NC has a different implication on performance under the teleoperation control mode, compared to the telerobotic control mode. Tukey’s HSD test was used to further analyze the significant interaction and revealed that RA and CA produced the worst TTC among all conditions except the CNA condition under the teleoperation mode. On average, the ND condition under the telerobotic mode produced the best TTC but it was not significantly different from the ND in teleoperation mode and the RNA and RA conditions in telerobotic mode. It was observed that regardless of the delay type or adaptation condition, the telerobotic mode resulted in higher performance in terms of TTC compared to the teleoperation mode.
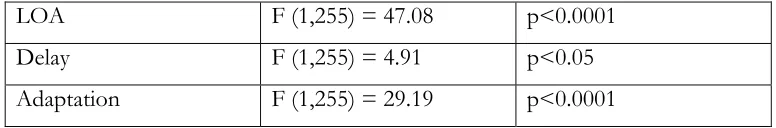
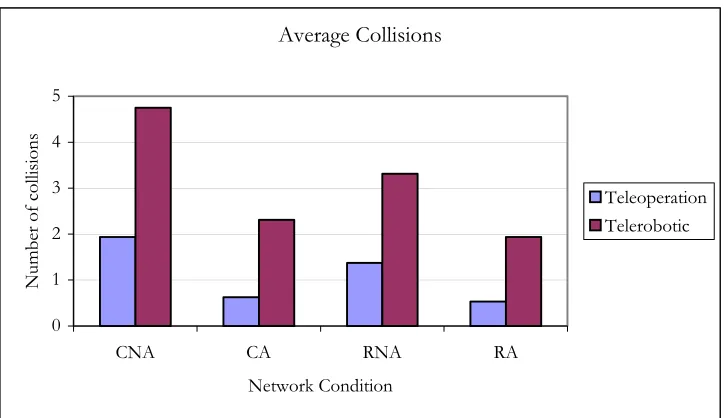
7.1.2 Number of Collisions/Errors
7.1 shows the F-values and the corresponding probabilities of significance for each main effect.
LOA F (1,255) = 47.08 p<0.0001
Delay F (1,255) = 4.91 p<0.05
Adaptation F (1,255) = 29.19 p<0.0001
Table 7.1. F-values and p-values from ANOVA on error as response variable – Full model.
Average Collisions
0 1 2 3 4 5
CNA CA RNA RA Network Condition
Nu
mber of
collisions Teleoperation
Telerobotic
Figure 7.3. Average collisions for different LOA groups by network condition.
Similar ANOVA results were obtained with the reduced model, considering the ND control condition. Table 7.2 presents the F-values and their associated significance probabilities for the LOA and NC main effects. Figure 7.4 indicates that there were considerably fewer errors under the teleoperation mode compared with the telerobotic mode for the majority of network conditions. However, there was no significant interaction of the LOA and NC manipulations.
LOA F (1,319) = 51.34 p<0.0001
Network Condition F (4,319) = 4.91 p<0.0001
Average Collisions
0 1 2 3 4 5
Teleoperation Telerobotic Level of Automation
No. of Collisions
ND CNA CA RNA RA
Figure 7.4. Average collisions for different network conditions grouped by LOA.
7.1.3 Potential Advantages of Gain Adaptation
Percentage increase/decrease in TTC and Errors -1 -0.75 -0.5 -0.25 0 0.25 0.5 0.75 1
TTC-Const Error-Const TTC-Rand Error-Rand
Percentage
Teleoperation Telerobotic Percentage increase/decrease in TTC and Errors
-100 -80 -60 -40 -20 0 20 40 60 80 100
TTC-Const Error-Const TTC-Rand Error-Rand
Percentage
Teleoperation Telerobotic
Figure. 7.5. Effects of gain adaptation on TTC and errors under the two LOAs.
7.2 Telepresence
Telepresence was measured by administering the 2-question PQ, developed by Draper and Blair (1996), after each test trial. An ANOVA on the sum of the ratings for questions (Appendix B) revealed that there were significant individual differences among subjects within the automation group. Comparable F-test values and p-values were obtained for the subject variable in both the full statistical model (F(2,255)=26.71, p<0.0001) and the reduced statistical (control condition) model (F(2,319)=32.64, p<0.0001).
(PQ1) were slightly greater for the adaptation conditions than the no-adaptation conditions under the telerobotic mode, however, there was no significant interaction of the LOA and NC manipulations.
Average Telepresence Rating
0.00 1.00 2.00 3.00 4.00 5.00 6.00 7.00
ND CNA CA RNA RA Network Condition
PQ
1 Sub
jective R
atin
g
Teleoperation Telerobotic
Figure 7.6. Average telepresence ratings for different LOAs grouped by Network conditions.
7.3 Workload
adaptation conditions, which was expected based on the lack of a significant NC main effect.
Average Workload Index
0 20 40 60 80 100
ND CNA CA RNA RA Network Condition
Pe
rcen
tag
e
Teleoperation Telerobotic
Figure 7.7. Average workload index under different LOA grouped by Network condition.
7.4 Correlation Analysis
Correlation analyses were conducted to explore the relationships between the various dependent variables. It was observed that TTC and the total telepresence rating (PQ1+PQ2) were significantly negatively correlated (r=-0.13663, p<0.05). This means as ratings of telepresence increased the TTC decreased. It was also observed that the overall workload index was positively correlated with telepresence ratings (r=0.20236, p<0.001). This linear association indicates that the subjective perception of workload increased with increases in the sensation of telepresence. Also the TTC was significantly positively correlated with frustration (r=0.19499; p<0.001) and physical demand (r=0.11883; p<0.05) and negatively correlated with performance (r=-0.10974; p<0.05) ratings. This indicates that as subject frustration increased and subjective perceptions of performance decreased, TTC increased.
The linear association of the telepresence ratings with other response measures was further analyzed by decomposing the ratings into PQ1 and PQ2 scores. This analysis revealed that PQ1 (r=-0.13541, p<0.05) was significantly correlated with TTC. Similarly, the overall workload index was broken-down into its demand components and the linear association of individual demand ratings with telepresence scores was analyzed. Table 7.3 presents a complete listing of all the correlations between the telepresence measures and the components of the workload index.
Mental Physical Temporal Performance Frustration Effort TLX
0.31433 0.36439 0.05320 0.11350 0.03634 0.12374 0.21335
PQ1
<0.0001 <0.0001 >0.05 <0.05 >0.05 <0.05 <0.001
0.24305 0.31845 0.06156 0.14348 -0.06100 0.06743 0.16388
PQ2
<0.0001 <0.0001 >0.05 <0.05 >0.05 >0.05 <0.05
0.31438 0.36583 0.06110 0.13659 -0.01094 0.10341 0.20263
PQ1+PQ2
From the table it is clear that the telepresence ratings have strong positive association with subject perceptions of mental workload, physical workload, and performance. From this analysis, it can be inferred that with increases in telepresence, the subjective perception of performance increases. There was also a negative correlation between telepresence and frustration, but it was not significant. Overall, it can be said, that subjective telepresence has an important role in the subjective perception of workload.
C h a p t e r 8
DISCUSSION
8.1 Performance
8.1.1. Time-to-task completion:
The results of the experiment showed that TTC was longer for the teleoperation control mode as compared to the telerobotic control mode. This is because the user controls the speed in the teleoperation mode as compared to the telerobotic mode.
It was hypothesized that the TTC for the random delay would be greater than the constant delay because the random delay varied between 700ms and 1300ms while constant delay was fixed at 1000ms. Based on the results, the TTC for the constant delay was actually greater than that of the random delay. This may be attributed to the nature of the random number generator used for setting the delay between the defined upper and lower limits. It was observed that many of the random delays generated were less than 1000 ms and hence a lower TTC was observed for the random delay mode (see Chapter 5, section 5.2 for more details about the random number generator).
The ability of the subjects to control the speed of the rover under the teleoperation mode most likely produced the significant individual differences within the automation groups. Interestingly, there was a two-way interaction between LOA and NC, meaning that performance under teleoperated control is affected by network conditions in a different manner than telerobotic control performance. This might be due to the differences in the extent of control of the speed available to the subjects under each LOA.
8.1.2. Errors
The performance errors under the teleoperation control were much lower than under telerobotic control. It is possible that this result was due to users having complete control over the speed of the rover in the teleoperation mode and the liberty to stop the rover at any time. This was not the case under the telerobotic control mode. Once the user selected the destination position for the rover, the vehicle only stopped if it had reached the destination, as marked by the crosshairs, or if it collided with some obstacle. This was a major difference between the teleoperation and telerobotic control mode that may explain the differences in the number of errors between the LOAs.
The difference in the number of errors between the no-adaptation and adaptation modes was inline with the research hypothesis. There were more errors in no-adaptation mode compared to the adaptation mode.
It was observed that the no-delay condition produced on average the fewest errors, compared to all other types and the reasons are obvious. The random delay combined with the gain adaptation was significantly different from the constant delay without adaptation, which reinforces the significance of delay types. There was no difference in the number of errors between the adaptation and no-adaptation mode within a delay type. There was a difference between constant delay and random delay network conditions but it was not significant as demonstrated by an ANOVA.
8.1.3. Correlation Analysis
The correlation analysis demonstrated that TTC was negatively correlated with the subjective telepresence ratings. It is possible that user telepresence experiences may have actually improved the performance in the telerover navigation task. Neither the TTC nor the number of errors had any significant relationship with the composite NASA-TLX. However, analysis of the individual demand components of the index revealed that several subjective ratings were significantly correlated with TTC including physical demand, performance and frustration perception. As TTC increased subjects perceived increased physical demand and frustration with a corresponding decrease in performance.
8.2 Telepresence
Only the LOA manipulation had a significant impact on subjective telepresence ratings (PQ1). It was hypothesized that the no-delay condition would produce a greater sense of telepresence as compared to other delay modes and that any degradation in telepresence under the random mode would be greater than for the constant mode. It was also expected that adaptation would result in higher ratings than the no-adaptation mode. The ratings across the network conditions did not support these hypotheses.
In the telerobotic control mode, users may have had greater attentional resources to concentrate on the details of the VE due to the off-loading of some task responsibility to the remote rover, which might have led to increased telepresence experiences. It might also be possible that increases in telepresence could have been due to lower impact of lag conditions on telerobot control since users were not required to control the speed of the rover.
control actions, as compared to those individuals who were risky in their actions and committed errors in order to finish the task faster. Related to this argument, there were considerable individual differences among subjects within the various control mode groups, as demonstrated by ANOVA results.
Telepresence had a significant positive correlation with the overall workload index. It is possible that greater task load may have led to increases in telepresence. Ma (2002) showed a positive correlation between telepresence and mental workload. It was also found that the telepresence ratings were significantly correlated with individual components of the NASA-TLX including mental demand, physical demand, and performance. Telepresence increased with increases in mental demand, physical demand, and user perception of performance.
8.3 Workload
The results demonstrated significant effects of LOA and individual differences on subjective perceptions of workload. The teleoperation mode resulted in higher workload that the telerobotic mode. This was consistent with the widely accepted notion that workload is greater for manual control of a system compared to automation assisted control modes. In this study, teleoperation referred to the manual/direct control mode and telerobotic referred to the automated assisted control mode. There was no apparent trend in workload across the adaptation and no-adaptation conditions.
C h a p t e r 9
CONCLUSION
The goals of this study were to: (1) evaluate the effects of different types of communication network delays (constant and random delays) on telerover control performance and operator telepresence experiences and workload; (2) evaluate the effects of gain adaptation on telepresence, performance and workload; and (3) examine the relationship between performance and presence in an Internet-based teleoperation scenario.
9.1 Limitations of current research:
Every research study has limitations that may form the basis for future work in an area. The limitations of the present study are related to the subject population, the VR simulation and the specific characteristics of the VE interface design. The subjects used in the experiment were students who were familiar with PC-based video games. These subjects cannot be compared to human operators of telerobotic devices who have received dedicated training on a system and have applied experiences in real teleoperation scenarios. Such operators may take the task of driving a remote rover very seriously and may be more motivated to high performance.
task, such as mine excavation and neutralization (see Riley and Kaber, 2001) might also serve to promote higher perceived realism and affect subject behavior. It is important to note, however, that the relevance of VE interfaces to teleoperators is currently limited to structured and known task environments because of limitations in near real-time modeling methods, as observed by Ballantyne, Greenspan and Lipsett (1997).
Finally, in regard to the specifics of VE interface features, it was observed during the experiment that under the teleoperation control mode subjects tended to use the exocentric view more extensively than the aerial view, save a few subjects who solely used the aerial view for task completion. One disadvantage of focusing on the aerial view was that the orientation of the telerover continuously changed with respect to the joystick navigation control and, as a result, subjects lost their sense of direction relative to the joystick control. For example, when subjects wanted to make the telerover turn right, they steered it to the left. With the current joystick display design, there was a lot of eye movement required back and forth between the main window and joystick display; that is, the user observed the direction of the desired motion and clicked on the corresponding arrow in the joystick control display. It is possible that using a real joystick would result in reduced distraction from the task possibly promoting more telepresence and performance.
mode might serve to reduce the visual requirements of the simulation and possibly improve performance.
9.2 Design Implications
Given the results of the current research, a number of design recommendations can be offered for implementing gain adaptation in teleoperation systems, including:
1. When the number of performance errors is more important than the time to complete the task, teleoperated control is more suitable than telerobotic control. Teleoperated control is applicable to this type of task goal irrespective of the nature of the network condition (i.e., constant, random or no-delay).
2. When the task completion time is more important than the number of errors, then a telerobotic control mode is more appropriate. This is true for constant, random and no-delay network conditions.
3. When the task involves higher workload, utilizing the telerobotic control mode can distribute the overall load between the user and rover.
4. When the task requires high level of attention from user promoting higher telepresence, a telerobotic mode can be used to best exploit the user’s state in terms of overall system performance.
9.3 Future research directions
under LOAs and NCs. The study identified gain adaptation as an important concept for human factors research in promoting performance and maintaining system safety in mission critical and dangerous situations.
Based on the results of the experiment and the caveats, it would be interesting to integrate the VR interface with a real teleoperator using the Internet and study the effects of gain adaptation on system stability and human performance and presence experiences. In addition, the use of a more complex task, representative of an actual teleoperation task, might improve the utility to generalize the research results.
Based on the VE interface design issues discussed above, it would also be interesting to explore user preferences in exocentric and aerial viewpoint use in controlling a telerover by allowing subjects to customize the interface before testing. In addition, the use of a natural control, like a joystick, instead of a keyboard and mouse might eliminate additional interface-affects on user performance.
R e f e r e n c e s
Anderson, R. J. & Spong, W. (1989). Bilateral control of teleoperators with time delay. IEEE Transaction on Automatic Control, 34(5), 494-501.
Ballantyne, J., Greenspan, M. & Lipsett, M. (1997). Virtual Environment for Remote Operation. In proceedings of ANS 7th Tropical Meeting on Robotics and Remote
Systems (pp.545-549). Augusta, GA: American Nuclear Society.
Barfield, W. & Weghorst, S. (1993). The sense of presence within virtual environments: A conceptual framework. In G.Salvendy and M.Smith (Eds.), Human-computer interaction: Software and Hardware interfaces (pp.699-704). Amsterdam, Netherlands: Elsevier Science Publisher.
Bishop, G. & Fuchs, H. (Eds.) (1992). Research Directions in Virtual Environments, Report of an NSF Invitational Workshop. Chapel Hill, NC: University of North Carolina.
Cheong, F. & Lai, R. (1999). QoS specification and mapping for distributed multimedia systems: A survey of issues. The Journal of Systems and Software, 45(2), 127-139.
Comer, D. E. (2000). Interconnecting with TCP/IP, Upper Saddle River, NJ: Prentice Hall.
Cox. M. J. & Baruch, J. E. F. (1994). Robotic Telescopes: An Interactive Exhibit on the World Wide Web. In the Proceedings of the Second International Conference of the World Wide Web. Chicago, IL: Elsevier Science Publishers.
Draper, J. V. & Blair, L. M. (1996). Workload, Flow and Telepresence during Teleoperation, In Proceedings of the IEEE International Conference on Robotics and Automation (Vol.2, pp.1030-1035). Minneapolis, MN: IEEE Robotics and Automation Society.
Draper, J. V., Kaber, D. B. & Usher, J. M., (1998). Telepresence. Human Factors, 40(3), 354-375.
Draper, J. V., Kaber, D. B. & Usher, J. M., (1999). Speculations on the value of Telepresence. Cyberpsychology and Behavior, 2(4), 349-362.
partially unknown environments.In Proceedings of International conference on Robotics and Applications - IASTED '99 (pp.163-168). Santa Barbara, CA: International Association of Science and Technology for Development.
Eusebi, A. & Melchiorri, C. (1995). Stability analysis of bilateral teleoperation robotic systems. In Proceedings of 3rd European Control Conference (ECC '95). Rome, Italy: European Control Conference.
Ferwon, A., Roque, R. & Vecchia, I. (1999). MAX: Wireless teleoperation via the World Wide Web. In Proceedings of IASTED Conference on Robotics and Applications (pp.158-162). Santa Barbara, CA: International Association for Science and Technology Development.
Fong, T., Thorpe, C. & Baur, C. (2001). Advanced Interfaces for Vehicle Teleoperation: Collaborative Control, Sensor Fusion Displays, and Web-based Tools. Autonomous Robot, 11(1).
Göktas, F. (2000). Distributed control of systems over communication networks. Unpublished doctoral dissertation. University of Pennsylvania, Philadelphia, PA.
Goldberg, K., Mascha, M., Gentner, S., Rothenberg, N., Sutter, C. & Wiegley, J. (1995). Desktop Teleoperation via the World Wide Web. In the Proceedings of IEEE International Conference on Robotics and Automation (ICRA) (pp. 654-659). Nagoya, Japan: IEEE Robotics and Automation Society.
Goldberg, S., Bekey, G., Akatsuka, Y. & Bressanelli, M. (1998). DIGIMUSE: An interactive telerobotic system for remote viewing of 3D art objects. In Proceedings of SPIE (Vol.3524, pp.196-200). Telemanipulator and Telepresence Technologies, Mathew. V. & Stein. R. (Eds.).
Held, R. M. & Durlach, N. I. (1992). Telepresence. Presence: Teleoperators and Virtual Environments, 1 (1).
Hendrix, C. & Barfield, W. (1996). Presence within virtual environments as a function of visual display parameters. Presence: Teleoperators and Virtual Environments, 5(3), 274-290.