University of Windsor University of Windsor
Scholarship at UWindsor
Scholarship at UWindsor
Electronic Theses and Dissertations Theses, Dissertations, and Major Papers
2014
Development of Quality Cost Models within a Supply Chain
Development of Quality Cost Models within a Supply Chain
Environment
Environment
Lutfi A. Aniza University of Windsor
Follow this and additional works at: https://scholar.uwindsor.ca/etd
Part of the Operations Research, Systems Engineering and Industrial Engineering Commons
Recommended Citation Recommended Citation
Aniza, Lutfi A., "Development of Quality Cost Models within a Supply Chain Environment" (2014). Electronic Theses and Dissertations. 5267.
https://scholar.uwindsor.ca/etd/5267
This online database contains the full-text of PhD dissertations and Masters’ theses of University of Windsor students from 1954 forward. These documents are made available for personal study and research purposes only, in accordance with the Canadian Copyright Act and the Creative Commons license—CC BY-NC-ND (Attribution, Non-Commercial, No Derivative Works). Under this license, works must always be attributed to the copyright holder (original author), cannot be used for any commercial purposes, and may not be altered. Any other use would require the permission of the copyright holder. Students may inquire about withdrawing their dissertation and/or thesis from this database. For additional inquiries, please contact the repository administrator via email
Development of Quality Cost Models within a Supply Chain Environment
By
Lutfi A Aniza
A Dissertation
Submitted to the Faculty of Graduate Studies
through the Department of Industrial and Manufacturing System Engineering
in Partial Fulfillment of the Requirements for
the Degree of Doctor of Philosophy at the
University of Windsor
Windsor, Ontario, Canada
2014
Development of Quality Cost Models within a Supply Chain Environment
By
Lutfi Ali Aniza
APPROVED BY:
__________________________________________________
E. Orady, External Examiner
The University of Michigan - Dearborn
__________________________________________________
F. Rieger
Odette School of Business
_________________________________________________
W. Abdul-Kader
Mechanical, Automotive and Materials Engineering
__________________________________________________
G. Zhang
Mechanical, Automotive and Materials Engineering
__________________________________________________
M. Wang, Advisor
Mechanical, Automotive and Materials Engineering
iii
DECLARATION OF CO-AUTHORSHIP / PREVIOUS
PUBLICATION
I. Co-Authorship Declaration
I hereby declare that this dissertation incorporates material that is result of joint research,
as follows: In all cases, the key ideas, primary contributions, data analysis and
interpretation, were performed by the author, and the contribution of co- authors and Dr.
Micheal Wang as advisor.
In chapter three, four and five Dr. Rieger Fritz has reviewed and provide feedback about
the contents.
I am aware of the University of Windsor Senate Policy on Authorship and I certify
that I have properly acknowledged the contribution of other researchers to my dissertation,
and have obtained written permission from each of the co-author(s) to include the above
material(s) in my dissertation.
I certify that, with the above qualification, this dissertation, and the research to
which it refers, is the product of my own work
II. Declaration of Previous Publication
This dissertation includes two original papers that have been previously published /
submitted for publication in peer reviewed journals, as follows:
Dissertation
Chapter
Publication title/full citation Publication
status*
Chapter 3,4 Lutfi Aniza .,Micheal H. Wang., Rieger Frits.(2013).
Development of Quality Cost Model within a Supply
Chain Environment. Applied Mechanics and Materials
Vol. 330 (2013) pp 737-742
iv
Chapter 4,5 Aniza L., Michael H. Wang., Rieger Fritz (2013).
Quality Cost Model As A Tool for managing
Continuous improvement. Journal of Engineering
Management and Competitiveness.
Accepted
I certify that I have obtained a written permission from the copyright owner(s) to include
the above published material(s) in my dissertation. I certify that the above material
describes work completed during my registration as graduate student at the University of
Windsor.
I declare that, to the best of my knowledge, my dissertation does not infringe upon
anyone’s copyright nor violate any proprietary rights and that any ideas, techniques,
quotations, or any other material from the work of other people included in my dissertation,
published or otherwise, are fully acknowledged in accordance with the standard
referencing practices. Furthermore, to the extent that I have included copyrighted material
that surpasses the bounds of fair dealing within the meaning of the Canadian Copyright
Act, I certify that I have obtained a written permission from the copyright owner(s) to
include such material(s) in my dissertation.
I declare that this is a true copy of my dissertation, including any final revisions, as
approved by my dissertation committee and the Graduate Studies office, and that this
dissertation has not been submitted for a higher degree to any other University or
v
ABSTRACT
Determining the quality cost is one of the best ways that can assist industrial or business
organizations to know clearly the investment and return of their quality improvement
efforts. The information provided by accurate quality cost calculation is also a significant
tool that can assist our assessment of the effectiveness of quality management system, as
well as identification of quality issues within the organization and creation of opportunities
for improvement.
It has been noted that there is insufficient research regarding calculating cost of quality
using a standard cost elements model .There is a need for a methodology to describe and
develop a quality cost model using international standard.
The purpose of this research is to show the development of a quality cost model that
includes all possible quality cost components such as Prevention, Appraisal and Failure
(P.A.F). This research studies various quality cost models, based on reviewing and
analyzing these models a generic quality cost model is developed. The proposed model
can be used as a tool to calculate various quality costs. In addition, it is used to determine
the most failure cost. A case study is used to validate the proposed model. In this case, the
implementation shows that the model is able to identify and quantify the hidden cost related
to the quality in products assembly plant. Also, it identify the potential improvement
opportunities within the plant.
The expected significance of this research is to develop a quality cost model that can bring
a light to the status of a quality system .The analysis of the outcome will be a significant
vi
DEDICATION
To my parents, my wife, my children Lila, Omima, Sarah, Fatima, and Aisha,
vii
ACKNOWLEDGEMENTS
I would like express my sincere gratitude to my advisor, Dr. Micheal H. Wang for his
guidance, encouragement, and support during my Ph.D program.
I am also thankful for my Ph.D. research and examination committee members;
Dr. W.Abdul-kader, E.Orady, G.Zhang and F. Rieger for their encouragement throughout
my doctoral program especially for their professional comments and advice that provided
me great help in the preparation of this dissertation. In addition, I would like to thank Dr.
Waguih ElMaraghy for all the support he provided me during my study at the University
of Windsor. My deepest gratitude is extended to my parents, brothers, sisters and my wife
for their encouragement and support. My rewards would not have been possible without
viii
TABLE OF CONTENTS
DECLARATION OF CO-AUTHORSHIP / PREVIOUS PUBLICATION ... iii
ABSTRACT ... v
DEDICATION ... vi
ACKNOWLEDGEMENTS ... vii
LIST OF TABLES ... xi
LIST OF FIGURES ... xii
Chapter 1 Introduction ... 1
1-1 Background ... 1
1-2 Motivation ... 2
1-3 Objective and problem statement ... 2
1-4 Research scope and limitations ... 3
1-5 Organization of the dissertation ... 3
Chapter 2 Literature Survey ... 4
2-1 Introduction to Quality Cost Development. ... 4
2-2 Quality Cost Definitions ... 7
2-3 Review of Cost of Quality Models ... 7
2-3-1 P-A-F Model concept ... 10
3- P-A-F Model curves ... 11
2-3-2 Crosby’s quality cost Model concept ... 13
2-3-3 Opportunity and intangible costs concept ... 14
2-3-4 ABC Model concept ... 14
2-4 Economics cost Model ... 15
2-5 Manufacturing cost model ... 15
2-6 Cost of quality and accounting system ... 18
2-7 Benefits of quality improvement ... 19
ix
Chapter 3 Proposed Quality Cost Model Methodology ... 22
3-1 Introduction ... 22
3-2 Quality Cost Model ... 22
3-3 The objective of the proposed quality cost model are: ... 23
3-4 the steps of implementing the model ... 23
Chapter 4 Case studies ... 31
4-1 Introduction ... 31
4-2 Field of the case study ... 31
4-3 Authorities and responsibility of the management ... 32
4-4 The production system: ... 33
4-5 The Components of the TV’S ... 36
4-6 Material flow ... 36
4-7 quality cost study at the factory ... 37
4-8 Data collection and calculation and analysis: ... 39
4-9 Cost Collecting ... 45
4-10 Elements of Cost of quality calculation and reporting ... 47
4-11 Prevention Costs ... 47
4-12 Appraisal costs ... 53
4-13 Internal failure costs ... 58
4-14 External failure cost. ... 62
Chapter 5 Cost analysis and Recommendations ... 64
5-1 Introduction ... 64
5-2 Analyzing prevention cost. ... 67
5-3 Analyzing Appraisal cost. ... 69
5-4 Analyzing the internal failure cost. ... 70
5-5 Analyzing the External failure cost. ... 71
5-6 Performance Measurement ... 72
5-6-1 Internal comparison ... 73
x
Chapter 6 Conclusions and Future Research ... 77
6-1 Conclusions ... 77
6-2 Recommendations for future work ... 78
References ... 79
Appendix ... 86
xi
LIST OF TABLES
Table 1 Classified quality costs approach ... 8
Table 2 Generic cost of quality models and cost categories ... 9
Table 3 Components of T.V... 36
Table 4 Value and quantity of losses for 1st quarter of year 2009 ... 38
Table 5 Model 2126 ... 38
Table 6 Value and quantity of losses due to after sales maintenance ... 38
Table 7 Summary of the losses quantity for the 1st Quarter of year 2009 ... 39
Table 8 The quantity of used material maintenance during 1st Quarter of year 2009 ... 39
Table 9 BS 6143 Quality costs elements ... 47
Table 10 Prevention costs at auto insertion stage ... 50
Table 11 Prevention costs at manual insertion stage ... 51
Table 12 Prevention costs at final assembly stage ... 52
Table 13 Appraisal costs at auto insertion stage ... 55
Table 14 Appraisal costs at manual insertion stage ... 56
Table 15 Appraisal costs at final assembly stage ... 57
Table 16 Internal failure costs at auto insertion stage ... 59
Table 17 Internal failure costs at manual insertion stage ... 60
Table 18 Internal failure costs at final assembly stage ... 61
Table 19 External failure costs ... 63
Table 20 The Percentage of each actual category of quality cost ... 64
Table 21 Percentage of each category of quality cost ... 65
Table 22 Summary of prevention cost ... 67
Table 23 Summary of Appraisal cost ... 69
Table 24 Summary of Internal Failure cost ... 71
Table 25 Summary of external Failure cost ... 72
Table 26 Internal compassion result ... 74
xii
LIST OF FIGURES
Figure 1 quality cost elements ... 12
Figure 2 Juran's Model Revised (Juran and Gryna, 1993) ... 14
Figure 3 Components of manufacturing cost ... 16
Figure 4 Manufacturing cost/price relationships ... 17
Figure 5 Effect of poor quality on financial benefits ... 20
Figure 6 Quality cost model ... 23
Figure 7 Organization structure ... 35
Figure 8 Material Flow in Production System ... 37
Figure 9 Auto insertion stage flow chart ... 42
Figure 10 Manual assembly stage flowchart ... 43
Figure 11 Final assembly stage flowchart ... 44
Figure 12 Source information for quality costing ... 45
Figure 13 The collection costs flow chart ... 46
Figure 14 Cost of quality ... 66
Figure 15 Bar chart for cost of quality ... 66
Figure 16 Summary of prevention cost ... 68
Figure 17 Summary of Appraisal cost ... 70
Figure 18 Summary of Internal Failure cost ... 71
Figure 19 Summary of external Failure cost ... 72
1
Chapter 1 Introduction
1-1Background
Quality improvement program such as total quality management (TQM) and six sigma are
systematic approaches to solving production problem. There are many tools and techniques
management can use in order to compete in market share .Cost of quality is just one of
these tools. The main goal of quality management system and six sigma technique is
customer satisfaction by providing a defect free product and reducing failure rate.
Manufacturing a quality product, providing a quality service or doing a good job with a
high degree of customer satisfaction is not enough. The cost of achieving these goals must
be known. For all successful organizations, making the customer accept and buy its product
is not an easy job. They need to work harder to design a quality system for the whole
organization and also they need to spend a lot of money to make sure that every process
during the production line is within the required standard. At the end, the goods or the
service must meet the customer requirements. On the hand, organizations want to get some
profit from its business. As they produce better products, they get a higher profit. So the
logical questions here would be how much they should spend to meet the customer’s
expectations and at the same time make a profit. This is because it is not reasonable to say
that the organizations have to spend money to make excellent goods without focusing on
how they can get back the money that they have already spent during the manufacturing
process. If they don’t take this into account they may lose their business. Determining the
cost of quality is one of the best ways that help the organizations to know clearly about
2
1-2Motivation
In response to the growing competition many manufactures have been forced to reassess
their quality and production system and search for new ways to produce higher quality
products while reducing operating costs. Adopting and implementing quality costing
program is one of the tools manufacturers can use to achieve these goals. Quality costing
is a measurement of improving quality performance. Cost of quality is generally believed
to be one of the powerful methods to evaluate the customer satisfaction and helps justify
and steer investment in preventing activities which lower the entire cost of the company.
It has been noted that there has been insufficient research regarding the modeling of quality
cost. There is a need for a methodology to describe and develop quality cost model to
measures the improvement process.
1-3 Objective and problem statement
Many companies are promoting quality as the central customer value and regard it as a key
concept of their strategy in order to achieve the competitive edge. Measuring and reporting
quality cost is the first step in quality improvement programs.
The objective of this research is to develop a quality cost model that would include all
possible cost elements using British standard as cost guidance .The analysis of the results
will bring a light about the status of a quality system .Also it will help determining the
problem area, opportunities, saving and action priorities and the most effective factor of
3
1-4 Research scope and limitations
The scope of this research focuses on measuring and collecting quality costs that associated
within any business process in a manner consistent with the pursuit of continuous
improvement and concept of total quality management and lean manufacturing. The cost
model represented the only costs elements that listed in the British standard.
1-5 Organization of the dissertation
The dissertation is arranged as follows, chapter one presents the introduction and the
objective of this research. In chapter two literature survey is discussed. Then the proposed
quality cost methodology has been described in chapter three. A case study has been
implemented to validate the model in chapter four. Chapter five presents the cost analysis
4
Chapter 2 Literature Survey
2-1 Introduction to Quality Cost Development.
One of the earliest writings pertaining to the general concept of cost of quality can be found
in Dr. J.M. Juran’s first quality control book (1951) chapter 1, “ The Economics of quality”
most other papers and articles of that time dealt with more narrow economic applications.
Among the earliest articles on quality cost system is Dr. W. J Masser’s 1957 “the quality
manager and quality cost”. In 1963 the U.S Department of Defence issued MIL-Q-9858
A, a quality program requirement, making cost of quality a requirement for many
Government contractors .This document helped to focus attention on the implementation
of cost of quality measurement. In 1967, ASQ quality cost committee published “Quality
Costs –what and how to detail what should be contained in a quality cost program. Moen
(1998) proposed an approach focusing on customer requirements for computing the cost of
poor quality of the manufactured product. He divided poor quality cost into two groups:
direct poor quality cost and indirect poor quality cost. Direct poor quality costs are costs
that are directly perceived and both internally (before shipment) and externally (after
shipment) by the company. The composition of this direct poor quality cost is made up by
direct failure cost, consequence cost and lack of process efficiency cost. Taguchi’s loss
function is used for estimation of direct failure cost, Activity Based Costing (ABC) is used
for the consequence cost, and comparing to the main competitors or to theoretical
performance or using competitive/functional benchmarking is used for the lack of process
efficiency cost. The indirect poor quality cost contains three categories: customer incurred
cost, intangible cost and environmental cost. DeFeo (2001) presented four majors steps in
5
decide how to estimate cost; (3) collect data and estimate cost; (4) analyze results and
decide on next step. In the identification of the activities step, he suggested using keywords
such as rework, waste, fix, return, scrap, complaint, repair, expedite, adjust, refund,
penalty, waiting, and excess. In second step, two strategies for estimating costs can be used
both individually and together: the total resource approach and unit cost approach. He also
proposed to collect personal opinions and judgment about the relative magnitude of time
spent or costs for poor quality in addition to generally recorded data. At the final step, the
result of cost of poor quality estimation can be adopted for further activities such as making
decision in selecting the quality improvement project and identifying the most costly
aspects of a specific problem. Williams and Amber (2002) determined the way to solve the
tradeoff between the protecting customers from a failure product and controlling
manufacturing cost by developing the mathematical cost model. They considered and
minimized the cost of overall manufacturing test that are comprised of the cost of the
testing in the manufacturing process and the cost of the test escapes. The cost of test escape
in their research has been assembled from the cost of repair failure product and cost to the
cost that customers experience. Oppermann Ele (2003) put an effort into decreasing quality
cost of an electronic production by using a mathematical model of quality cost consisting
of defect subsequent cost, inspection cost and rejection cost as a measurement system in
the selection of the inspection strategies (no inspection/statistical process control
(SPC)/100% inspection) for different technological processes. Chen and Tsou (2003)
developed the economically mathematical model, which works on the process of quality
improvement to maximize net earnings. The model was established using the function of
6
decision-making support in allocating inspection stations in a manufacturing system that
produces products with rapidly changing customer requirements. The criterion in his
research was the minimum unit cost of the product sold to the customer. The unit cost
contains the cost of manufacturing the products, cost of inspection and cost of
nonconforming product (i.e., rework cost, discard cost, replacement cost, repair cost and
quality loss cost). He calculated quality loss cost by employing Taguchi’s quadratic loss
function. Duffuaa (2004) improved the quality of a chemical process by reducing process
variability with respect to saving manufacturing cost. They calculated cost of poor quality
by adopting Taguchi’s quadratic loss function. The Taguchi’s quality engineering was
integrated with statistical process control (SPC), engineering process control (EPC) to find
the optimum point at which corrective action should be taken after the output variables
deviate from the target. Their case study results showed the significant percentage of saving
of poor quality loss. Sharma (2005) presented the method in estimation of cost of poor
quality used for prioritizing Six Sigma project. He tried to solve the shortcoming of
inadequate measurement at the initial of the project. His approach was performed by
deployment of FMEA. The estimated cost of poor quality of failure was calculated from
risk priority number, average cost to resolve failure, effort hours to resolve failure and the
potential reduction in failure. Khataie (2013) introduces a novel cost of quality (COQ)
decision support model (DSM), which can help management to track the effect of changing
each incorporated value added (VA) and non-value added (NVA) activity on each other's
cost as well as on the quality costs in real time. Heravi (2014) explained how to achieve a
7
2-2 Quality Cost Definitions
A cost of quality defined in BS 54778: Part 2 BS 6143 Part 1 and 2 and as “The expenditure
incurred by the producer, by the user, by the community associated with product or
service”. Quality related cost is defined in BS 4778: as “the expenditure incurred in defect
prevention and appraisal activities plus losses due the internal and external failure”.
The definition of cost quality has been changing in recent years. In early 1980, the cost of
quality were perceived as the cost of running the quality assurance department , plus scrap,
rework , testing and warranty costs , it is now widely accepted that they are the cost incurred
in the design , implementation , operation and maintenance of an organization’s quality
management system. Although , like many terms in Industrial Engineering there is no
specific definition for quality costing and most the writers are in disagreement on what
should be included in quality costing definition . Barrier (2002) noted that cost of quality
refers just to cost of non-conformance. Crosby (1986) stated that “quality costing is the
price of non-conformance or the price of poor quality. The ASQ Quality Costs Committee
(2013) stated that the "cost of quality" isn't the price of creating a quality product or service.
It's the cost of not creating a quality product or service. Every time work is redone, the cost
of quality increases.
2-3 Review of Cost of Quality Models
Many authors have developed quality costs models. These models are categorized
8
Table 1 Classified quality costs approach
Category Concept Publications developing or
dealing with the model Based on the relation
between cost of quality and quality level
Cost of quality decrease with higher quality level.
Wasserman and lindland 1997, Sower et al., 2007, Kim and Nakhai, 2008, Walid Abdul-kader ,Ozhand Ganjavi and Solaiman 2010, Mohamed Khaled Omar and
Sharmeeni Murgan 2013. Based on type of industry Cost of quality are more
popularly implemented in manufacturing as
compared to service industry
Bamford and land 2006,
Tiwari el al. 2007
Ramdeen et al. 2007,Green
and Trevor 2007,
Keqin Ai 2014 Based on
Quality metrics
The relation between cost
of quality and six sigma,
knowledge management,
supply chain and other
tools are very effective
Rajiv Kumarma and Dinesh
Kumar 2007
Steve Eldridge and
Mohammed Balubaid 2008
Rodin Wayne 2013 , Guangyu Mu 2013.
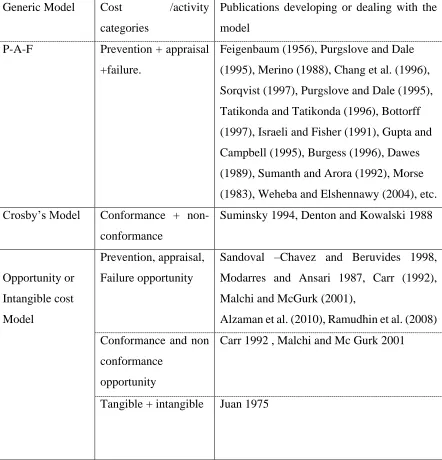
The other category is based on the interrelationship between costs components. Cost of
quality can be classified into four groups of generic models. These are P-A-F (Prevention,
appraisal, failure) or Crosby’s model, opportunity cost models process cost model, ABC
9
Table 2 Generic cost of quality models and cost categories
Generic Model Cost /activity
categories
Publications developing or dealing with the
model
P-A-F Prevention + appraisal
+failure.
Feigenbaum (1956), Purgslove and Dale
(1995), Merino (1988), Chang et al. (1996),
Sorqvist (1997), Purgslove and Dale (1995),
Tatikonda and Tatikonda (1996), Bottorff
(1997), Israeli and Fisher (1991), Gupta and
Campbell (1995), Burgess (1996), Dawes
(1989), Sumanth and Arora (1992), Morse
(1983), Weheba and Elshennawy (2004), etc.
Crosby’s Model Conformance +
non-conformance
Suminsky 1994, Denton and Kowalski 1988
Opportunity or
Intangible cost
Model
Prevention, appraisal,
Failure opportunity
Sandoval –Chavez and Beruvides 1998,
Modarres and Ansari 1987, Carr (1992),
Malchi and McGurk (2001),
Alzaman et al. (2010), Ramudhin et al. (2008)
Conformance and non
conformance
opportunity
Carr 1992 , Malchi and Mc Gurk 2001
10
ABC Model Value –added +
non-value added
Cooper,1989, Tasi 1998 Enkerlin 1992
Cooper (1988), Cooper and Kaplan (1988),
Tsai (1998), Jorgenson and Enkerlin (1992),
Dawes and Siff (1993), Hester (1993),
Feng et al. (1996), Qian and Ben-Arieh
(2008), Zhang and Fuh (1998), Ben-Arieh
and Qian (2003), Ou-yang and Lin (1997),
Park and Kim (1995), Lewis (1995),
Ozbayrak et al. (2004), Park and Simpson
(2005), Chen and Wang(2007), Tornberg et
al.
(2002), Tseng and Jiang (2000), H’Mida et al.
(2006), Cooper et al. (1992), Ong (1995),
Aderoba (1997), Niazi et al. (2006),
Creese et al. (1992), Khataie and
Bulgak (2013)
Taguchi loss
function model
Loss of sales revenue
due to poor
quality + process
inefficiencies + losses
when a quality
characteristic deviates
from a target
Soumaya and Jacqueline (1998), Chin-C et al.
(1998), Jia (2007), Johannes (2008),
Naidu (2008)
Source: Adopted from Schiffauerova and Thomson (2006)
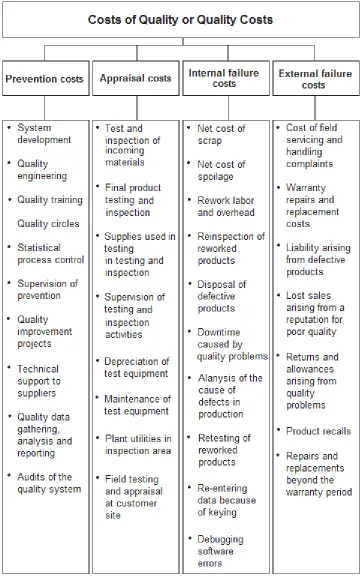
2-3-1 P-A-F Model concept
Most cost of quality models are based on P-A-F classification. This model Classified cost
of quality into four categories:
1-Prevention cost:
11
services, for example the cost of new product review, quality planning, quality
improvement and quality training.
2-Appraisal cost:
The cost associated with measuring, evaluating or auditing products or service to make
sure everything is in conformance to quality standard and performance requirement. These
costs include the costs of calibration of measuring and test equipment and the cost of
associated suppliers and materials.
Internal failure costs:
The costs that occur before delivering the product to the customer. These costs usually
happen on the production line for example, in scrap, rework, testing and material review.
External failure costs:
The costs occurring after delivering the product to the customer, for example, product
recalls, warranty claims, customer’s returns.
3- P-A-F Model curves
The prevention and appraisal cost are considering to be controllable quality cost while the
internal and external failure costs are uncontrollable. Figure 2 shows the relationship
between the controllable costs and uncontrollable costs.
As the controllable costs of prevention and appraisal costs increase, the uncontrollable
costs of internal and external failure decrease. At some point the cost of prevention and
appraisal defects exceeds the cost of correcting for product failure. This point is the
optimum quality cost point. There are some elements called indirect quality cost for
12
13
These costs are high when the defect level is high. These costs are affecting the total quality
cost. As shown by figure 2 the optimum point has moved to the right which indicates the
need for a lower product defect level. A lower product defect level can be obtained by
increasing the prevention and appraisal costs, which subsequently lowers the external
failure costs.
2-3-2 Crosby’s quality cost Model concept
Crosby defines the cost of quality as “the sum of price of conformance and price of
non-conformance (Crosby, 1975). The price of non-conformance is the cost involved in producing
a good quality in the first time. The price of non-conformance is the money wasted when
14
Figure 2 Juran's Model Revised (Juran and Gryna, 1993)
2-3-3 Opportunity and intangible costs concept
Intangible costs are costs that can be only estimated for example profit not earned losses in
productivity, customer goodwill or drops in employee morale. While these costs do not
have a firm value, managers often attempt to estimate the impact of the intangible costs
2-3-4 ABC Model concept
This model was developed by Coop (1980) .Under this model, accurate costs for various
cost objects are achieved by tracing resource costs to their respective activities and the cost
15
2-4 Economics cost Model
Quality costs have been covered under the broad headings of financial measures and
evaluation of quality management practices. Most of the studies considered quality costs
as an integral part of the quality system. In addition, there are numerous economics cost
models have applied operation research techniques or simulation approach to estimate the
quality cost. However, all these models deal with the subject as integrated cost model.
Since all the cost components are integrated into single model. Both the associated
manufacturing cost and quality losses are considered during model development.
2-5 Manufacturing cost model
Manufacturing Cost defined as the expenses assigned to specific convert or raw materials
into products. In order to estimate the selling price all the following costs and the margins
must be determined. The traditional cost and price structure for a manufactured product is
shown in figure3 and 4. Prime cost is the sum of direct labor and direct material. Prime
cost when summed manufacturing overhead yields factory cost or cost of goods
manufactured. The total product cost is obtained by adding selling expense, general and
administration expense, and contingencies to the factory cost.
16
Figure 3 Components of manufacturing cost
Manfuacuring
cost
cost of
products sold
Direct material
& labour
overheads cost
expenses
administration
17
Figure 4 Manufacturing cost/price relationships
1-Material cost is the cost of raw material required to manufacturing process
Material cost =direct material cost + indirect material cost + extra cost due to defective
product
2-Labour cost is the cost of direct labour and indirect labour involved in the production
activities and included wages and salaries.
Cost of labour = direct labour cost incurring from operation normal unit + direct labour
18
3-Machine and set-up cost .it included all the costs related to running the manufacturing
machine and the cost of preparing and setupthe machine.
In addition, material handling cost should be added to this category.
All these three costs are the major components of any cost model. Some researchers may
add another or remove cost elements.
Manufacturing cost model = labour cost + material cost +machine cost set-up cost
+ Material handling cost.
This manufacturing cost model does not express the issues of the quality or shows any
opportunities for improvement. It just helps the manufacturer to know how much it cost
to produce one unit. Also it will assist to estimate the margins profit.
2-6 Cost of quality and accounting system
Unfortunately accounting systems do not have the ability to measure cost of quality .They
were not designed to demonstrate the impact of the quality of performance on overall
operating costs. That is why some of costs have remained hidden. However,the support of
the accounting system is vital whenever financial and accounting matters are involved. In
fact, the accounting department is responsible for any accounting matters, including cost
of quality systems. The role of the quality department is to provide guidance and support
to the accounting department. The cost of quality system must be integrated into the
accounting system. This will speed the learning process and reduce confusion. Ideally, the
cost of quality will be so fully integrated into the cost accounting system that it will not be
viewed as a separate accounting system at all, it will be a routine part of cost reporting and
19
The ideal cost of quality accounting system will simply aggregate quality costs to enhance
their visibility to management and facilitate efforts to reduce them.
2-7 Benefits of quality improvement
Poor quality of products and processes has direct impact on the finance of the company in
both the company’s top line (revenues) and its bottom line (profits). During development,
i.e., the design and manufacturing phase (as depicted in Figure 4), poor quality causes late
delivery, added test time, added development time to correct problems found, and
additional people being added to try to overcome the problems encountered. This adds
significantly to development costs, reducing the bottom line. Once poor quality products
are delivered to customers, word of that poor quality quickly spreads, and results in reduced
sales, from some who will return products they are not satisfied with, and from others who
will never buy a poor quality product in the first place. This reduces ongoing revenues,
often significantly, thus impacting both the top and bottom lines. With poor quality product
in the field, customer support issues will quickly grow, and this will in turn require
additional engineering support people to be assigned. These added support and engineering
costs would add to development costs, often for prolonged periods of time, further reducing
the bottom line. Poor quality products also imply a poor quality company, affecting the
20
Figure 5 Effect of poor quality on financial benefits
With the fact that poor quality products tremendously affect monetary benefits, many
companies consider quality improvement as one of the most important business strategies
and adopt quality improvement program into their organization.
2-8 the significance of quality cost
Measuring cost of quality can enable companies to know the impact of their quality systems
on business performances. One of the reasons for tracking cost of quality is to translate
the Quality issues like number of defective parts to the language of dollars that
21
process and cost control (Evans and Lindsay 2002). Also it will help focusing on areas of
high expenditure and wastage and identifies potential problem area, cost reduction and
improvement opportunities. Juran and Godfery (1999) stated that the objective of
identification and measurement in cost associated with poor quality are:
● To quantify the size of quality problem in terms of money
● To identify the opportunities for reduction in cost of poor quality
● To identify the opportunities for customer satisfaction and associated threats to
sale revenues
● To provide a means of tracking the progress and results of quality improvement
activities
22
Chapter 3 Proposed Quality Cost Model Methodology
3-1 Introduction
Traditionally quality performance has been reported to management in terms of rejection
and defective products reports. This vital information is often difficult to analyze and
interpret in terms of cost. As a result. Cost saving opportunities may be overlooked.
Successful business requires financial planning and control. It is advisable that quality
failure be presented in financial terms.
3-2 Quality Cost Model
The model is based on BS 6143 standard and targeted to identify the opportunities for cost
reduction by focus on failure costs in attempt to drive them to zero also to invest in the
prevention activities in order to reduce the appraisal cost.
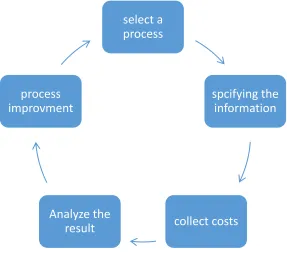
The proposed model goes through a series of steps:
1- Select a process and define its boundaries.
2- Specify resources and the date needed.
3- Collect the costs of each process using the BS6143 as guide of quality costs and the
proposedMathematical models Eq1 to Eq13 which represent the elements of quality cost.
23
Figure 6 Quality cost model
3-3 The objective of the proposed quality cost model are:
1- Quantify the size of quality problem in language that will have impact on upper
management.
2- Identify major opportunities for cost reduction.
3- Identify opportunities for reducing customer dissatisfaction and associated threats to
produce salability.
4- Expand budgetary and cost controls.
3-4 the steps of implementing the model
A quality model process goes through many steps as shown in figure 3;
1-Choose a process to be analyzed. It would be much better if the model is applied
primary to a specific area such as a production line or a department. So, we have
select a process
spcifying the information
collect costs Analyze the
24
opportunity to solve any issues which may occur in the quality cost calculation before
implementing in the entire factory.
2- Define the process and its boundaries. In this step, the study areas (production line,
department) is divided into sub area to make it the cost collection easier.
3 - Flowchart the process and identify the input and the output. In this step a flowchart is
used to illustrate the various operation, which is a method of describing a process in
picture.
4- Cost collection. When the study area is determined and flowchart is prepared the cost
collection process then start. It would be useful if a guide of cost elements is prepared
prior to collection process. The collection process requires cooperation and participation
from all departments in the organization especially from quality control department and
account department. This step consists of two phases:
A) Specifying the information resources
In this phrase information sources are determined whether it’s direct from department and
units or indirect by questionnaire (oral, written)
B) Coding
To make it easier to collect the various cost, a coding system is used which will divide
the cost into number of categories and each category will have a code represent the costs
as follows:
Prevention cost [A]
Appraisal cost [B]
Internal failure cost [C]
25
A number is added to the code to show the sub costs of each element for example
(A1) means quality planning
(B6) final inspection
The letter (A) is coding to prevention costs
The coding system has many advantages such as:
1-It distinguishes between various costs.
2-Easier the collecting process.
5- COST CALCULATION
Prevention cost: these costs mainly occurs with the quality control activities
department
These costs depend on the estimation of the time that spent on these activities
QEC: Quality engineering cost. These costs are including the activities related to quality
plans.
= Number of employees responsible on quality function
= Number of working hours.
= Percentage of the time developed to this activity.
= Average salaries.
QEC = (
2 4
X X
)
3
1 i
Xi (1)
CMC: maintenance and calibration of production equipment used to evaluate quality.
26
= The cost of maintenance and calibration of equipment.
= Number of equipment.
CMC =
6
5 i
X i
(2)SQC: Supplier quality assurance. These are the costs of any activities that confirm the
quality of the supplier
SQC =
8
7 i
X i
(3)= Number of employees.
= Average salaries.
TQC: Training. These are the costs of any quality training programs.
= Number of training staff.
= The cost of one hour training.
= Number of hours spent on training.
= The cost of training material.
=The cost of external training.
TQC=
11
9 i
X i
+ (X12+X13) (4)AQC: Audit. These costs are including the activities related to the auditing of the quality
system
= Number of auditors.
27
= The number of hours in one visit.
= Average salaries.
=Number of working hours in a month.
AQC= ( 17
18
X
X )
16
14 i
X i
(5)APPRAISAL COST these costs associated with the quality control activities such as
measuring, and evaluating the quality system
LAC: Laboratory acceptance testing. These costs associated with inspection of any new
material
= The cost of the lot.
= Percentage of the cost of the lot.
LAC=
20
19 i
X i
(6)INC: Inspection and test. These costs associated with the inspection process
= Number of full time employees.
= Average salaries.
= Number of senior staff.
= Number of working hour.
=The percentage of the time spent on performing this element.
28 INC= 22 21 i X i
+( 2624 X X ) 25 23 i X i
(7)IPC: In-process inspection (non-inspectors). These costs associated with the inspection
process during the production line
= Number of employees.
= Number of working hour.
= The percentage of the time spent on performing this element.
= Average salaries.
IPC= ( 30
28 X X ) 29 27 i X i
(8)RTC: Review of test and inspection. This cost included the cost of reviewing and
checking the quality reports.
= Number of seniors staff.
= Number of working hour.
= The percentage of the time spent on performing this element.
= Average salaries.
=Number of full time employees.
= Average salaries.
RTC= ( 34
32 X X ) 33 31 i X i
+ 36 35 i X i
(9)29
to requirement prior delivery to the customers.
SC: Scrap. These costs included the cost of the material, labor and overhead of any fail
to confirm quality requirement
= The value of the scrap.
= The overhead cost.
SC=
38
37 i
X i
(10)RRC: Rework and repair. These costs associated with any activity or rework or repair any
failure
= Number of employees.
= Average salaries.
= The total price of the units.
= The labor cost.
RRC=
40
39 i
X i
+ X41+X42 (11)External Failure cost. These costs included any failure cost may occur after
delivering the product or the service to the customers.
CMC: Complaints. The cost of dealing with the customers complains such as
investigating and solving any problem
= Number of employees.
30
= The percentage of the time spent on performing this element.
= Average salaries
CMC= ( 45
43
X
X )
44
42 i
X i
(12)WRC: Warranty replacement the expenses of repairing the product during the warranty
period.
= Number of products
= Price of the unit.
WRC=
47
46 i
X i
(13)Total quality cost
=QEC+MCC+SQC+QTC+LAC+INC+IPC+RTC+SC+RRC+CMC+WRC
31
Chapter 4 Case studies
4-1 Introduction
A case study has been done in a TV assembly factory located in Libya. The production
process for the model (2931) has been chosen. It has the following production line:
1-Auto insertion stage,
2 -manual insertion stage
3- Final assembly stage.
The data collection was gathered from different departments. The BS6143 guide has been
used to collect the costs. In order to achieve the most efficient quality costs, it was
necessary to analyze the different quality costs (i.e. prevention cost, internal failure, etc.).
4-2 Field of the case study
The company started businesses as trading company in 1990 with the capital worth is ten
million L.D. Its main business was importing and exporting electronic goods and service
after sales throughout the country.
In 1996 the company developed its business after carrying out feasibility study in the
Libyan market, which pointed out the need for producing TVs in Libya. Since then, the
company grew as trading and industrial company.
In 1998 the company had received two plants, one of them in ELZAWIA to produce
TV’s and the another one in TAJORA to produce DVDs
32
1. Computer set plant in Tripoli.
2. PC board and speakers in ELMAYA.
3. Radio set plant in JADO.(closed since 2009)
The TV assembly factory
The factory produces TV sets. The product has a very good reputation in the market and
gained customers satisfaction. The following points give more details about factory:
1. The factory started operation in 1998.
2. The total area 80,000m2.
3. There are 570 employees.
The goal of the factory is to produce TV sets with high quality that satisfy the customer
and meet his expectation and requirement. To achieve this goal a quality system has been
applied through the following steps:
1. Prepared the factory to receive the ISO (9002)
2. Adopt the continuous improvement philosophy across all levels in the factory.
3. Each employee is responsible for the quality of his work.
4. The factory is committed not to use any material of product that may cause any
environmental hazard.
4-3 Authorities and responsibility of the management
1. Selecting department’s managers.
2. To draw the quality policy and objective.
33
- Head of quality control department.
1. Design training program for and maintain the manpower assignment
2. Plan control quality activities.
3. Evaluating the production process.
- Head of production department.
1. Set up production plan for the factory according to objective.
2. Set up day to day production program.
3. Solving any problem that may occur in production line.
- Head of maintenance department.
1. Set up the maintenance department.
2. Provide the tools, equipment’s and spare parts maintenance.
- Head of material department.
1. Inventory management and select the material handle equipment
2. Managing the material flow during the production system
- Head of management administration department.
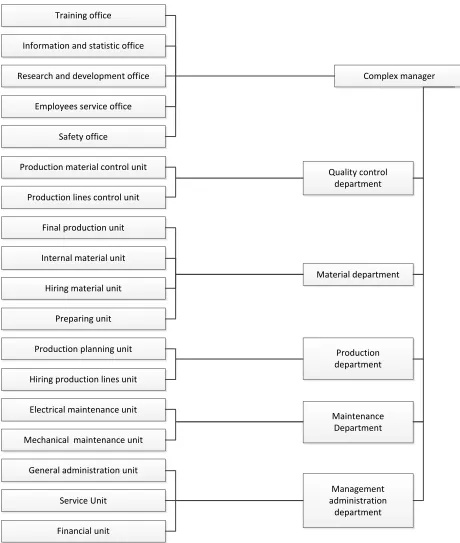
1. Implement the labour laws. Figure 7 shows the organization structure.
4-4 The production system:
There are some steps that the factory proceed with before starting manufacturing:
● A one year plan based on the market need and the budget
34
● Place the order from outsources
● When the material arrival, the production process well then start. The factory
applies batch production system by one shift a day to produce a specific amount
according to the production plan through the following production lines.
1. Auto – insertion stage – one line.
2. The manual insertion stage – four lines.
3. Final assembly stage – four lines.
35
Training office
Information and statistic office
Research and development office
Employees service office
Safety office
Production material control unit
Production lines control unit
Final production unit
Internal material unit
Hiring material unit
Preparing unit
Production planning unit
Hiring production lines unit
Electrical maintenance unit
Mechanical maintenance unit
General administration unit
Service Unit
Financial unit
Complex manager
Quality control department
Material department
Production department
Maintenance Department
Management administration
department
36
4-5 The Components of the TV’S
The TV is a device that combines a tuner, display, and speakers for the purpose of
viewing television. It made of the following components as showed in table 3
Table 3 Components of T.V
PARTS SOURCE
Plastic material Local
PCB and speaker PCB and speaker plant in ELMAYA
Electronic component International companies
Wax Local
Packaging the cover Local
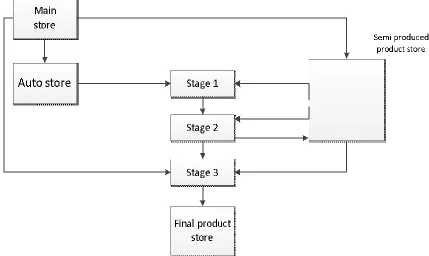
4-6 Material flow
The materials start move from the main storage to the auto insertion store, semi produced
product store and a final assembly line on daily or weekly basis. The final product is
37
Figure 8 Material Flow in Production System
4-7 quality cost study at the factory
The factory has done some quality costing study to determine the quality issues in terms
in money however, the following facts have raise:
● The study does not represent the real value of total quality costing to the top
management; therefore, a corrective action could not be taken.
● It does not explore the opportunities for improvements which may be gained by
identifying the high costs and the attempt to reduce it.
38
Table 4 Value and quantity of losses for 1st quarter of year 2009
NO. CODE
NO.
DESCRIPTION QUANTITY PRICE TOTAL
1 14-26- Screen 12 39.37 472.44 L.D
2 Main-1426 Main board 87 33.25 2892.75L.D
3 Speaker Speakers 29 0.27 7.83 L.D
3373.02L.D
Table 5 Model 2126
NO. CODE
NO.
DESCRIPTION QUANTITY PRICE TOTAL
1 21-26- Screen 2 33.25 66.50 L.D
2 Main-2126 Main board 26 27.78 722.28L.D
788.78
Table 6 Value and quantity of losses due to after sales maintenance
NO. DESCRIPTION QUANTITY PRICE TOTAL
1 Screen 2850 2 62.59 125.18 L.D
2 Screen 1471 1 18.32 18.32 L.D
3 Screen 4500 1 49.58 49.58 L.D
4 Screen 2070 1 14.18 14.18 L.D
5 Deviation coil 46 0.22 10.12 L.D
6 Font frame 1471 1 9 9.00 L.D
7 Screen 2126 2 55.56 111.12 L.D
39
Table 7 Summary of the losses quantity for the 1st Quarter of year 2009
NO. MODEL LOSSES NOTES
1 1426 3372.43 L.D
2 2126 788.77 L.D
3 After sale maintenance 337.50 L.D
Total losses 4498.70 D.L.
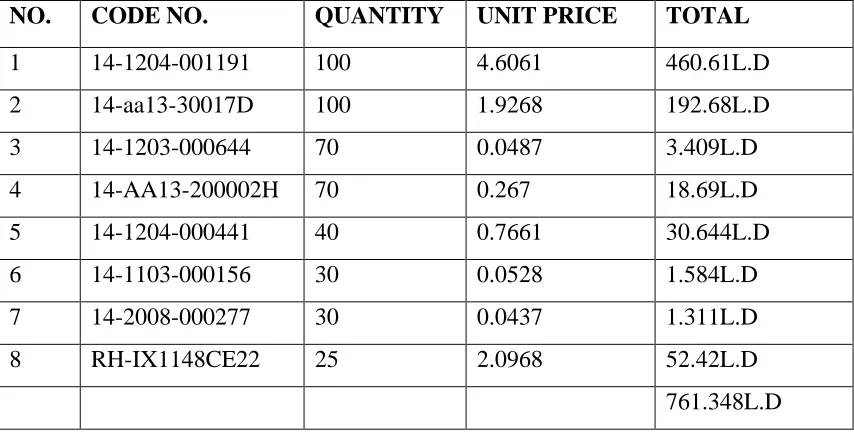
Table 8 The quantity of used material maintenance during 1st Quarter of year 2009
NO. CODE NO. QUANTITY UNIT PRICE TOTAL
1 14-1204-001191 100 4.6061 460.61L.D
2 14-aa13-30017D 100 1.9268 192.68L.D
3 14-1203-000644 70 0.0487 3.409L.D
4 14-AA13-200002H 70 0.267 18.69L.D
5 14-1204-000441 40 0.7661 30.644L.D
6 14-1103-000156 30 0.0528 1.584L.D
7 14-2008-000277 30 0.0437 1.311L.D
8 RH-IX1148CE22 25 2.0968 52.42L.D
761.348L.D
The cost of rework = number of workers* average salaries *total period + cost of material
= 15* 250 * 3 + 761.348
=12011 L.D
4-8 Data collection and calculation and analysis:
The process of the assembly lines were followed to determine the actual quality cost during
the period of one year from January 2010 to December 2010. The collection cost started
40
Select the model 2931 as the target product to calculate quality cost. The production
line has been chosen for the following reasons. This product has stable demand and
the production rate is almost constant.
Study the assembly process and understand the task at each work stations. The
production line for this model has three stages:
a- (Auto insertion) stage: It starts with receiving materials from sub-store and it ends by
handing out the PCBS to semi-completed product store. In this process the electronic
components are inserted automatically like (capacitors, transformers...etc.) which go
through the following procedures:
1. Eye-let rings are inserted using the eye-let machine.
2. Vertical assembly process for components such as transistors, capacitors ... etc.
3. Horizontal assembly process for components such as resistors, diodes ... etc.
4. The final inspection process where the inserted PCBs are inspected using computer
program.
b- The manual insertion stage: It starts by receiving PCB from auto insertion line. In this
process electronic components which require special technician are installed. Three
processes are made in this stage which are:
1. Assembly electronic components.
2. Soldering process.
41
c- Final assembly stage: At this stage, the TV set takes its final shape. The final assembly
stage consists of:
1. Hosting the screen into the front plastic cabinet.
2. Installing the electronic PCBs “main board – sub boards” into the cabinet.
3. Pre-trials of the assembled TV set are carried out to check the power supply and
the overall picture and sound.
4. Final adjustments to the power supply voltages and adjustments to picture
characteristics such as color – brightness –sound levels are provided at this stage.
5. Final inspection and packing and move to complete product store.
Preparing Flowchart for all manufacturing process and identify input, out and
control. In this step we use the process flowchart to point out the production,
inspection and testing operation at each stage of the production line as shown in
the flowchart. Auto insertion stage – Figure 9 Manual insertion stage – Figure 10
42
Start
Materials
Sample inspection
Sequencer assembling machine
First sample inspection test
Horizontal insertion machine
Visual inspection
Inspection
Vertical insertion machine
Visual inspection
Inspection using computer
10
Supplier
Rejected material procedures
Correction action
Troubleshooting and repair
Troubleshooting and repair refused
refused
refused
refused
refused refused
43
10
20 Manual insertion
Visual inspection
Automatic soldering
Inspection & checking of PCB
Visual inspection
Auto inspection
Checking & Adjustments
Inspection Corrective action
Corrective action
Repair & data collection
Troubleshooting & repair
Troubleshooting & repair Refused
Refused
Refused
Refused
Accepted
44 Start
20
Material
Preparing & supplying
Inspection
Housing of CRT & PCBs
Pre-checks Pre-operating
tests
Pre-heating (aging)
Adjustments (Picture & sound)
Final inspection 100%
Packing
Sample inspection
Complete product store
Marketing
End Cathode ray tube CRTs
Set repair
Refused
Refused
Refused
Refused
45
4-9 Cost Collecting
The quality cost data is collected from the following sources.
1. Financial department reports.
2. Production department reports.
3. Quality control department reports.
4. Accounting department reports.
5. Statistics and information reports.
The following figure shows source information for quality costing and process of
collection cost:
46
Start
Is the cost related to the prevention of poor quality in
products?
Is the cost related to evaluating the conformance of product to quality standard
and performance requirements?
Is the cost related to non conforming product?
Not a quality cost
Prevention
Appraisal
Found before shipment of
product
Internal failure
External failure No
No No
No Yes
Yes
Yes Yes
47
4-10 Elements of Cost of quality calculation and reporting
When the list of cost elements has been identified the collection of cost date can begin.
The BS 6143 has been used as a cost guidance
Table 9 BS 6143 Quality costs elements
BS 6143 Elements
A1 Quality control and process control engineering.
A2 Test and inspection equipment – maintenance and calibration.
A3 Supplier quality assurance.
A4 Training.
A5 Audit.
B1 Laboratory acceptance testing.
B2 Inspection and test.
B3 In – process inspection (non-inspectors).
B4 Review of test and inspection data.
C1 Scrap.
C2 Rework and repair.
D1 Complaints.
D2 Warranty replacement.
4-11 Prevention Costs
These costs are associated with personnel in planning, implementing and maintaining the
quality system. Prevention costs are incurred to reduce failure and appraisal costs to
48
are made up of a number of disparate elements carried out on part – time basis by personnel
from different departments. This cost depends heavily on estimates of apportionment of
time.
A1 Quality Engineering. These costs include the activities associated with the
creation of the overall quality plan, the inspection plan. It also includes the
implementation and maintenance of the plans. This work is carried out by quality
team who meet once a month and cumulative effort input is estimated to be
equivalent to 3 per cent of the time of each member.
A2 Calibration and maintenance of production equipment used to evaluate quality
The cost of calibration and maintenance of templates, jigs, fixtures and similar
measurement and evaluating devices should be included but not the cost of
equipment used to manufacture TV’s. This work is carried out by external
companies who calibrate production equipment used to evaluate quality once a
year.
A3 Supplier Assurance. The cost of evaluating supplier quality activities, auditing
the activities during the contract, and associated effort with suppliers. The cost of
three full time employees audit the supplier’s activities have been counted.
A4 Quality training. The costs incurred in the development and implementation of
formal training programs for the purpose of preventing errors, includes the total
cost (course preparation, instruction and necessary materials) of quality
improvement programs, new employee quality orientations, and other programs
designed to provide:
49
2. Tester training in new product design and testing procedures.
This cost covers the training of all employees in production lines which takes a
week at the beginning of production plus the training expenses and external training
for some employees.
A5 Auditing. The cost of evaluating the execution of activities in the overall
quality plan used in the plant. This work is done by internal auditor who visits the
plant twice a year; each visit takes a week. The prevention costs and findings at the
50 Table 10 Pre venti on co
sts at a
u to i ns ertion st ag e PR EV E NT ION C OS TS Data / 31.12.2010 Prepa red by / Report m onths / yea r 201 0 Stage / Auto inse rtion Rec or ded cos ts (L. D) Codin g Cost ele me nt s 1 st qt r 2
nd qt
r
3
rd qt
r
4
th qt
r Quality ann ual cost So ur ce Notes A1 Quality contr ol and pr ocess con tro l eng in eering 330 0 3300 3300 3300 13 200 Esti m ated ti me Th e qu alit y te am con sist o f Q.C., Pr od
. Mat. Dept.
51 Table 11 Pre venti on co
sts at m
anual i nser tion stag e PR EV E NT ION C OS TS Data / 31.12 .2010 Prepa red by / Report m onths / yea r 201 0 Stage / M an ual i ns ertion Re corded cos ts (L.D) Cod i ng Cost ele me nt s 1
st qt
r
2
nd qt
r
3
rd qt
r
4
th qt
r Pro ject ann ual cost So ur ce Notes A1 Quality contr ol and pr ocess con tro l eng in eering 33 33 33 33 13 200 Esti m ated ti me fro m Q.C. Dept. Th e qu alit y te am con sist o f Q.C. , P ro d. Mat. Dept. A2 Calibratio n and ma in tenan ce of pr od uction eq ui pm ent used to evaluate qu ality 6000 - - - 6000 Q.C. Dept. Main Dept. Calibratio n
once a y
ear. A3 Su pp lier assurance 500 500 500 500 2000 Q.C. Dept. A4 Quality traini ng 1126 - - - 1126 Training offic e
Internal and external train
52 Table 12 Pre vention co st
s at final
ass em bly stage PR EV E NT ION C OS TS Data / 31.12 .2010 Prepa red by / Report m onths / yea r 201 0 Stage / Fin al assem bly Rec or ded cos ts (L. D) Co d in g Cost ele me nt s 1
st qt
r
2
nd qt
r
3
rd qt
r
4
th qt
r Quality t ann ual cost So ur ce Notes A1 Quality contr ol and pr ocess con tro l eng in eering 3300 3300 3300 3300 13 200 Esti m ated ti me Th e qu alit y te am con sist o f Q.C., Pr od
. Mat. d
ep. A2 Ca libration and ma in tenan ce of pr od uction eq ui pm ent used to evaluate qu ality 3200 - - - 3200 Q.C. dep . Main d ep. Calibratio n
once a y