Several compaction methods are used to fabricate specimens for performance testing in the laboratory. As the physical properties of the specimens depend on the method of compaction used for fabrication, the compaction methods adopted in the laboratory should simulate the properties of the pavement in the field. The effects of different compaction methods on the performance of mixtures were investigated in this study. Laboratory compaction methods such as Superpave Gyratory Compaction (SGC) and Rolling Wheel Compaction (RWC) were compared with field compaction. Four field mixtures were selected. Various performance evaluation tests were conducted on the field cores and specimens fabricated using SGC and RWC. The mixtures were evaluated using the Shear tester, the Asphalt Pavement Analyzer (APA) and the NCSU Wheel Tracking Device.
The results indicate that the laboratory compacted mixtures tend to be superior in their performance than the field cores. The laboratory compacted mixtures have higher stiffness values and lower shear strain values than the field cores. The RWC seems to simulate field compaction better than the SGC. A good correlation was found between the results of the Repeated Shear tests at Constant Height tests, the APA tests and the NCSU WTD rut tests. The mixtures which failed to satisfy the RSCH test criteria had rut depths greater than 0.5 inch, as measured by the APA and NCSU WTD. The mixtures that passed the RSCH tests had rut depths less than 0.5 inch. The APA test and the NCSU WTD test can be used as a simulator to examine the rutting susceptibility of a mixture.
EVALUATION OF THE EFFECTS OF COMPACTION
METHODS ON THE PREDICTED PERFORMANCE OF
SUPERPAVE MIXTURES
By
SURIYANARAYANAN SADASIVAM
A dissertation submitted to the Graduate Faulty of North Carolina State University
in partial fulfillment of the requirements for the degree of
Doctor of Philosophy
CIVIL ENGINEERING
Raleigh
July 2004
Approved by:
___________________________________ __________________________________
Dr. N. Paul Khosla Dr. Michael L. Leming
Chair of Advisory Committee
Dedicated To Lord Nataraja !
¯Ä¦¸Ä¡õ ¯½÷ó §¾¡¾ü ¸Ã¢ÂÅý
¿¢Ä×ġŢ ¿£÷ÁÄ¢ §Å½¢Âý
«Ä¸¢ø §º¡¾¢Âý «õÀÄò ¾¡ÎÅ¡ý
ÁÄ÷ º¢ÄõÀÊ Å¡úò¾¢ ŽíÌÅ¡ý.
We praise and pray towards the lotus feet of the
One beyond comprehension of the whole worldly knowledge One wears the crescent Moon in the crown of matted hairs Where flows endlessly the waters
Performs his cosmic dance and
BIOGRAPHY
ACKNOWLEGMENT
With great pleasure, I express my sincere indebtedness to my research advisor Dr. N. Paul Khosla for his invaluable advice and incessant motivation. He has been a pillar of strength and support to me all through my doctoral program. I express my profound gratitude to him.
I express my special thanks to my committee members Dr. M.S. Rahman, Dr. M.L. Leming and Dr. Pierre A. Gremaud for their cooperation and valuable advice. I would like to thank all my course instructors who played a great role in shaping up my thoughts and knowledge.
I am greatly thankful to Dr. Glen A. Malpass for his gracious help that he offered at all stages of my research. The technical discussions with him were helpful. I would like to thank Mr. Prasad Kollipara for assisting me with the experiments. His assistance helped me to progress this research at a comfortable pace. I would like to thank Mr. Steve Wade, Mr. Bogdan Burlacu and Mr. Balaji Iyengar for their technical assistance.
TABLE OF CONTENTS
List of Tables……… vii
List of Figures………... ix
1. Introduction………... ……... 1
2. Literature Review ………... 4
2.1 Evaluation of Laboratory Compaction Methods………..4
2.1.1 Compaction………... 4
2.1.2 Different Types of Compaction Methods……….……… 5
2.1.3 Studies on different Compaction Methods………7
2.1.4 Effect of Compaction on the Internal Structure ………10
2.2 Accelerated Wheel Tracking Devices……….. ………15
2.2.1 Loaded Wheel Testers used in the United States……….. ………15
2.2.2 Effect of Test Parameters and Mixture Properties on LWT Results………….23
2.2.3 LWT Results Versus Field Performance………...………25
2.3 Gyratory Compaction of Superpave Mixtures………. ……... 29
3. Research Methodology………...……… 32
3.1 Problem Statement….………... ……... 32
3.2 Objectives and Scope of Study……….……... 32
3.3 Research Methodology and Approach………. ……... 33
3.4 Summary……….. ……... 38
4. Mixture Information……… ……... 39
4.1 Field Specimens……….. ……... 39
4.2 Loose Mixtures……… ……... 40
4.3 Characteristics of Mixtures……….. ……... 41
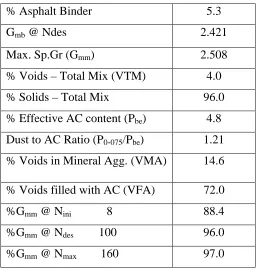
4.3.1 Auburn Coarse………..……… 41
4.3.2 Auburn Fine………..…….... 43
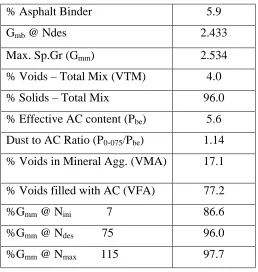
4.3.3 Charlotte ………... 43
4.3.4 Kinston……….. ……... 44
5. Performance Evaluation of Mixtures………. ……... 48
5.1 Performance Evaluation using the Simple Shear Tester………..…….... 48
5.1.1 Specimen Preparation………... 48
5.1.2 Selection of Test Temperature for FSCH and RSCH………... 48
5.1.3 Frequency Sweep Test at Constant Height………... ……... 49
5.1.4 Repeated Shear Test at Constant Height……….….. ……... 57
5.2 Asphalt Pavement Analyzer for Rutting Susceptibility………... ……... 61
5.2.1 Viscoelastic Models……….. ……... 67
5.3 Wheel Tracking Test………... ……... 73
5.3.2 Rolling Wheel Compaction of Slabs……….……... 77
5.3.3 Rutting Tests using the WTD………... ……... 78
6. Compaction Characteristics of Mixtures………... ……... 84
6.1 Compaction of Mixtures using the SGC……….. ……... 84
6.2 Gyratory Load Cell Plate Assembly……….... 88
6.3 Energy Indices………..……... 90
6.4 Gyratory Shear Compaction……….……... 94
6.4.1 Measuring Gyratory Shear……… ……... 95
6.4.2 Evaluation of Gyratory Shear Strength Curves……….……... 96
6.4.3 Draft AASHTO Procedure……… ……... 99
6.5 Correlation with Shear Strains………. ……... 101
6.6 Shear Tests at Different Compaction Levels………... 104
7. Mixture Performance Analysis……….. ……... 112
7.1 Analysis of Service Life of Pavement………..……... 112
7.2 SUPERPAVE Fatigue Model Analysis………... 112
7.3 SUPERPAVE Rutting Model Analysis………... ……... 118
7.4 Statistical Analysis of Experimental Data………... 122
7.5 Correlation of APA Test Results………. ……... 126
8. Discussion of Results and Conclusions………... 131
8.1 Discussion of Results………...…131
8.2 Conclusions………..139
LIST OF TABLES
Table 2.1 Recommended Criteria for LWT Devices……….……… 28
Table 4.1 Bulk Specific Gravity……… 40
Table 4.2 Target Bulk Densities and Air Voids of Mixtures…..………... 41
Table 4.3 Information about Auburn Coarse Mixture………42
Table 4.4 Information about Auburn Fine Mixture………... 43
Table 4.5 Information about Charlotte Mixture………. 44
Table 4.6 Information about Kinston Mixture………... 45
Table 4.7 Levels of Gyrations and Compaction Temperatures (SGC) ………. 46
Table 4.8 Compaction Summary (SGC)………... 46
Table 4.9 Compaction Summary (Pine SGC)……… 47
Table 5.1 Testing Temperatures……….49
Table 5.2 Results of Frequency Sweep Tests – Auburn Coarse ………50
Table 5.3 Results of Frequency Sweep Tests – Auburn Fine……….51
Table 5.4 Results of Frequency Sweep Tests – Charlotte………..51
Table 5.5 Results of Frequency Sweep Tests – Kinston ………... 52
Table 5.6 Results of Frequency Sweep Tests – SGC Specimens at 4% Air Voids…... 56
Table 5.7 Repeated Shear Test Results……….. 58
Table 5.8 Shear Strains of SGC Mixtures at 4% Air Voids………...60
Table 5.9 APA Tests: Final Rut Depths………. 63
Table 5.10 APA Tests: Rut Depths after 1000 cycles………..66
Table 5.11 Initial Rut Ratio………..67
Table 5.12 Summary of Viscoelastic Parameters……… 72
Table 5.13 Wheel Tracking Tests: Rut Depth………..80
Table 5.14 Rut Depths after 2000 Cycles……… 82
Table 5.15 Initial Rut Ratio………..83
Table 6.1 Compaction Summary………85
Table 6.2 Regression Equation of Compaction Curves………. 86
Table 6.3 Compaction Slope of Mixtures……….. 86
LIST OF TABLES (Contd.)
Table 6.5 Gyration Ratio of Mixtures……… 87
Table 6.6 Energy Indices………... 93
Table 6.7 Gyratory Shear Strength……… 97
Table 6.8 Determination of N-SRmax………...100
Table 6.9 R2 values of Correlation between Various Parameters……….. 102
Table 6.10 Shear Strains at Different Air Voids……….. 107
Table 6.11 Shear Strains at Different Air Voids……….. 107
Table 6.12 Shear Strains at Different Air Voids……….. 107
Table 7.1 Summary of Estimated Material Properties for Various Mixes……….114
Table 7.2 Summary of Fatigue Analysis Results (SHRP Surrogate Model)…………. 115
Table 7.3 Summary of Fatigue Analysis Results (AI Method)………..117
Table 7.4 Summary of Rutting Analysis Results (SHRP Surrogate Model)…………. 119
Table 7.5 Summary of Rutting Analysis Results (AI Method)………..121
Table 7.6 ANOVA: compaction methods vs mixtures (|G*|)……… 124
Table 7.7 ANOVA between two compaction methods………..124
Table 7.8 ANOVA: compaction methods vs mixtures (Phase Angle)……….. 125
Table 7.9 ANOVA: compaction methods vs mixtures (APA)………...126
LIST OF FIGURES
Figure 2.1 Horizontal X-ray Tomography Image of a SGC Specimen………... 13
Figure 2.2 Optical Digital Camera Image of a SGC Specimen………... 13
Figure 2.3 Void Distribution in a SGC Specimen………... 14
Figure 2.4 Projections of 3-D Images of Air Voids of a SGC Specimen………14
Figure 2.5 Model of APA ………17
Figure 2.6 Schematic Drawing of the APA………. 18
Figure 2.7 Model of HWTD……… 20
Figure 2.8 Model of LCPC……….. 21
Figure 2.9 Model of PURWheel………..22
Figure 2.10 Model Mobile Load Simulator………...23
Figure 3.1 Research Plan………. 33
Figure 4.1 Gradation Curves for 12.5mm Auburn Mixtures………... 42
Figure 4.2 Gradation Curves for 9.5mm Mixtures (Charlotte and Kinston)…………... 45
Figure 5.1 Frequency Sweep Test Results of Field Cores………...52
Figure 5.2 Frequency Sweep Test Results of RWC Specimens………..…53
Figure 5.3 Frequency Sweep Test Results of SGC Specimens………... 53
Figure 5.4 Comparison of G* @ 10 Hz……….. 54
Figure 5.5 FSCH Tests of SGC Specimens at 4% Air Voids………. 56
Figure 5.6 RSCH Test Field Cores……….. 58
Figure 5.7 RSCH Test RWC Specimens………. 59
Figure 5.8 RSCH Test SGC Specimens……….. 59
Figure 5.9 RSCH Test Results of Field Cores……… 61
Figure 5.10 Rutting of Field Cores ………... 63
Figure 5.11 Rutting of Rolling Wheel Compacted Mixtures……… 64
Figure 5.12 Rutting of SGC Compacted Mixtures ………... 64
Figure 5.13 Comparison of Final Rut Depths………... 65
Figure 5.14 Comparison of Initial Rut Rates……… 67
Figure 5.15 Typical Calculation of E, η and tc……….. 72
LIST OF FIGURES (Contd.)
Figure 5.17 Compaction Foot and Rubber Tire Resting on a Slab………... 76
Figure 5.18 Schematic Diagram of the Wheel and Specimen support table……….76
Figure 5.19 Typical Rut Test Using the NCSU WTD……….. 79
Figure 5.20 Laser Measurement Points on a Typical Slab……… 79
Figure 5.21 Comparison of Rut Depths……….81
Figure 5.22 A Typical Rutting Profile………...81
Figure 5.23 Rutting in Auburn Fine Mixture (RWC slab)……… 82
Figure 6.1 Densification Curves of Mixtures……….. 85
Figure 6.2 Gyratory Load Plate Assembly……….. 90
Figure 6.3 Energy Indices (CDI, CFI,TDI,TFI)……….. 92
Figure 6.4 Construction Indices……….. 93
Figure 6.5 Traffic Indices ………... 94
Figure 6.6 Simple Shear……….. 95
Figure 6.7 Gyratory Shear Strength vs Air Voids………... 96
Figure 6.8 Shear Strength vs Air Voids……….. 98
Figure 6.9 Shear Strength vs Number of Gyrations……… 98
Figure 6.10 Air voids vs Number of Gyrations………. 105
Figure 6.11 Densification Curve of Charlotte Mixtures………105
Figure 6.12 Shear Strains at Different Levels of Compaction……….. 108
Figure 7.1 Typical Pavement Structure and Loading……….. 113
Figure 7.2 Comparison of Fatigue Life………... 116
Figure 7.3 Comparison of Fatigue Life by AI Method………... 118
Figure 7.4 Comparison of Rut Depths……….120
Figure 7.5 Rutting on Subgrade by AI Method………... 121
Figure 7.6 Correlation of RSCH Rut Depth and APA Final Rut Depth………. 128
Figure 7.7 Correlation of RSCH Rut Depth and APA Initial Rut Depth……… 129
1. INTRODUCTION
The Superpave Mixture Design and Analysis System is one of the products of the Strategic Highway Research Program (SHRP). Superpave is a collection of new test methods and specifications for asphalt binders, aggregates, and mixtures. Superpave represents an improved system for specifying asphalt binders and mineral aggregates, developing asphalt mixture design, and analyzing and establishing pavement performance prediction. Superpave mix design has many features in common with traditional mix design methods. It incorporates principles of volumetric proportioning of mixture components long used in the Marshall and Texas gyratory mix design methods.
One of the important new features of Superpave mix design is the use of the Superpave Gyratory Compactor (SGC). Laboratory compaction is accomplished using the SGC. This device plays a central role in Superpave mixture design because it closely matches the density characteristics of mixtures after they have been compacted and subjected to project-specific conditions of climate and traffic. It is also used to fabricate specimens for mixture analysis.
Mixture analysis is a further extension of the mixture design process, which is recommended for heavy traffic and highly critical situation. The mixture analysis is the next major step after mixture design toward being able to predict specific levels of pavement performance and the expected types of distress in the newly designed mixture. It uses pavement structural response and distress modeling techniques to make performance predictions with time or traffic for the pavement containing the designed mixture in terms of rutting and fatigue cracking.
laboratory compaction process is to simulate, as closely as possible, the actual compaction produced in the field. Several different laboratory compaction methods can be used to fabricate specimens for APA testing including the Superpave gyratory compactor (SGC), vibratory, static and rolling wheel. Each of these methods may produce specimens that have very different aggregate particle orientation, voids and corresponding estimated performance. So it is imperative that the laboratory compaction method used be representative of the mixtures as they exist in the field.
As most highway agencies in the United States have adopted the volumetric mixture design method, it is necessary to identify practical and relatively economical laboratory methods to predict the performance of mixtures on the roadway. Currently, the Superpave volumetric design method contains no strength or ‘proof’ test for quality control and quality assurance of mixtures. Test procedures that are used in the Superpave intermediate and complete procedures are designed to obtain input parameters for the Superpave computer model and require expensive and complex test equipment. Accelerated wheel tracking systems, such as the Asphalt Pavement Analyzer (APA), may fulfill the need for a relatively simple and inexpensive performance test. These accelerated wheel-tracking systems are basically laboratory simulative testers and are not fundamental test methods such as the Simple Shear Tests (SST). Of the available laboratory simulative testers in the country, the APA is the most widely used. It would be prudent to compare the APA test results with the results for fundamental tests obtained on a large variety of asphalt mixtures. This would facilitate development of rut depth criteria for APA corresponding to similar criteria for fundamental tests.
consequently, the expected pavement performance. The parameters obtained from the gyratory compaction may be related to the permanent deformation of the pavements in service.
With respect to the performance evaluation of Superpave mixtures, several questions may be posed,
1. How well do specimens fabricated using laboratory compaction methods simulate the
properties of the pavements in the field ?
2. Can the densification curves generated by the SGC (Ndes and Nmax) during the mixture
design process be compared to the permanent deformation parameters of the mixtures ?
3. Can a performance evaluation device such as the APA be used to detect poorly
performing Superpave mixtures ?
4. How does mixture performance as measured by the APA correlate with that of other
performance evaluation procedures and devices ?
2. LITERATURE REVIEW
This chapter reviews the background literature that deals with the comparison of different compaction methods, different types of loaded wheel testers used to evaluate rutting and the performance of the Asphalt Pavement Analyzer (APA).
2.1 Evaluation of Laboratory Compaction Methods
The objective of a mix design system has always been to mix, compact, and test asphalt mixtures in the laboratory to determine its expected performance in service. The specimen prepared in the laboratory should be representative of a field-compacted specimen having the same properties as the prototype placed in the field and subjected to the compactive effects of traffic. The laboratory compaction of specimens should be a true indicator of field compaction.
2.1.1 Compaction
Pavement density is a function of traffic and climate (temperature). For pavements to be designed correctly, traffic and climate must be simulated in the laboratory for mix design. The heart of all mixture design methods is the laboratory compaction method (1).
RILEM 152 PBM (2) identifies the type and degree of compaction as one of the five preparatory steps in the basic testing methodology of bituminous mixture design. Compaction of an asphalt concrete mixture is defined as “…a stage of construction, which transforms the mix from its very loose state into a more coherent mass, thereby permitting it to carry traffic loads”. The efficiency of the compactive effort will be a function of the internal resistance of the bituminous concrete. The resistance includes aggregate interlock, friction resistance, and viscous resistance. Another reason for compacting the asphalt pavement is to make it water tight and impermeable to air.
aggregate interlock, void structure, and the number of interconnected voids should be considered in the selection of a compaction device (3).
2.1.2 Different Types of Compaction Methods The four basic types of compaction methods are
1. Impact Compaction 2. Kneading Compaction 3. Gyratory Compaction 4. Rolling Wheel Compaction
Impact Compaction:
Impact compaction is the oldest method of laboratory compaction. In the 1920s, Hubbard and Field used a Procter hammer to compact asphalt mixtures. In 1930s, Marshall developed the mechanical Marshall Hammer to simulate impact type compaction. The number of blows applied to each face of the specimen (35, 50 and 75 blows) was tied to general traffic levels. Higher energy levels (blows) were used for higher traffic levels. Unfortunately, different densities, because of the variability in Marshall hammers (mechanical, rotating, and manual hammers), will result when these compaction blows are applied (1).
Kneading Compaction:
The compaction method used by Hveem in his mix design procedure is kneading compaction. Kneading compaction applies forces through a roughly triangular-shaped foot that covers only a portion of the specimen face. Compacted forces by tamps are applied uniformly on the free face of the specimen to achieve compaction. The partial face allows particles to move relative to each other, creating a kneading action that densifies the mix. There are different kneading compactors including the California kneading compactor, Linear kneading compactor (LKC) and Arizona kneading compactor (1).
Gyratory Compaction:
Laboratory for Bridges and Roads (LCPC) in France. One of the final product of Strategic Highway Research Program (SHRP) was the Superpave Gyratory Compactor. Other types of gyratory compactors (4) are
§ Texas Roots of Gyratory Compaction
§ Corps of Engineers Gyratory Testing Machine
§ LCPC French Gyratory Compaction
Gyratory process involves applying a vertical load while gyrating the mold in a back-and forth motion. Gyratory compaction produces a kneading action on the specimen.
Superpave Gyratory Compactor
The decision to use gyratory compaction as the Superpave compaction is based on NCHRP Study 9-5. NCHRP 9-5, which was designed to be a lead-in to the SHRP, focused on compaction methods and developed a preliminary mix design and analysis system using pre-SHRP performance related tests. Midway through the pre-SHRP, as the Superpave method of mix design was being assembled, an evaluation of available gyratory compaction research was completed.
An underlying premise of the gyratory protocol selection was that material property parameters were not expected to come from the compactor. The primary objective of SHRP was to develop and validate material properties, and test methods to measure the properties, which could be used to predict performance. Therefore, the need for fundamental or empirical engineering properties from a compactor did not exist. Hence, the material properties, which can be measured with the Gyratory Testing Machine, were not required.
protocol. Subsequent work indicated that the rate of densification was not sufficient; hence, the final angle selected for Superpave was 1.25 degrees.
In the SGC, a mix is subjected to two kinds of stresses during compaction: one is the constant vertical stress and other is a shearing stress. The shearing stress must overcome the shear strength of the mix to compact it. Other compaction devices include
• Rolling Wheel Compactor
• APA Static and Vibratory Compactor • French Plate Compactor
2.1.3 Studies on Different Compaction Methods Early Research in Compaction:
In early 1950s, Vallerga made a comparative study on the influence of static load, impact and kneading compaction methods on bituminous mixtures. He reported that the method of compacting or fabricating laboratory test specimens of bituminous paving mixtures has a profound influence on stability and cohesion values as measured by the Hveem’s stabilometer and cohesiometer respectively. He found that different compaction methods gave different stability values even when the compacted mixes show the same density. This observation made him conclude that different compaction methods yield different “orientation” or “arrangement” of particles that influence the stability or resistance to deformation of the mass rather than simply changing the density or void ratio alone (5).
Studies by Von Quintus, et al:
A NCHRP sponsored study evaluated the ability of five compaction devices to simulate field compaction (6). The compaction devices evaluated were selected on the basis of their availability, uniqueness in mechanical manipulation of mixture and potential for use by agencies responsible for asphalt mixture design. The devices evaluated were
• Marshall impact hammer
• Arizona vibratory-kneading compactor
The ability of the five laboratory compaction devices to simulate field compaction was based on the similarity between engineering properties (resilient moduli, indirect tensile strengths and strain at failure, and tensile creep data) of laboratory-compacted samples and field cores. The test results show that although there is no single laboratory compaction method that always provided the best match with the results of the field compaction method, the Texas gyratory compactor demonstrated the ability to produce mixtures with engineering properties nearest those determined from field cores. The California kneading compactor and the mobile steel wheel simulator ranked second and third respectively, but with very little difference between the two. The Arizona vibratory kneading compactor and the Marshall impact hammer ranked as least effective in terms of their ability to produce mixtures with engineering properties similar to those from field cores.
Studies by Button et al
A similar study was carried out by J.W. Button, et al , as a part of the research project for SHRP program (7). Four types of compaction methods that were evaluated are
• Exxon Rolling Wheel • Texas Gyratory compactor • Rotating base Marshall hammer • Elf linear kneading compactor
observed difficulties in using the Exxon rolling wheel compactor in controlling air voids with the finished specimens compared to the other compaction methods. He concluded that the Texas gyratory compactor is more convenient for preparing laboratory specimens for routine mixture design and testing of asphalt concrete. This study indicated that gyratory method of compaction provides better results than the other compaction methods.
Studies by UCB Research Group
As a part of SHRP A-003 research program at the University of California, Berkeley, Sousa, et al investigated gyratory (Texas type), kneading and rolling wheel compaction procedures (3). The gyratory compactor was found to place excessive emphasis on the asphalt binder and to inaccurately portray the role of asphalt aggregate interaction in the performance of properly constructed pavements. Furthermore, the shape and dimension of specimens produced by gyratory compactors are limited. Although a kneading compactor is more adaptable for producing a larger variety of sizes and shapes, it creates a more stable aggregate structure than the commonly developed by conventional construction practice, thereby failing to capture the role of the asphalt binder in properly performing pavements. Because the response of rolling wheel specimens to test loads is typically between that of gyratory and kneading specimens, the study concluded that the rolling wheel compaction is best suited for preparing laboratory specimens. Among the methods investigated, it appears to duplicate field-compacted specimens. Based on these studies, it is strongly recommended that rolling wheel compaction be considered for the preparation of laboratory specimens of aggregate mixes which are to be evaluated as a part of a comprehensive asphalt-aggregate mix analysis system.
desirable because air voids can be more accurately measured, comparisons with specimens extracted from in-service pavements are more accurate, specimens are more homogeneous, and test results are likely to be less variable. Rolling-wheel compaction also has the advantage that specimens containing large-size aggregates can be produced without difficulty.
European experience has proven the practicality and superiority of rolling wheel compaction. It is the recommended form of specimen preparation in France and is a major component of the LCPC mix design and evaluation methodology. Studies in the United Kingdom as well as the Royal Dutch Shell Laboratory, Amsterdam, also demonstrate the effectiveness of rolling wheel compaction.
2.1.4 Effect of Compaction on the Internal Structure
The method of compaction has profound influence on the measured mechanical properties on the compacted asphalt concrete specimens. Earlier research indicated that gyratory, rolling wheel and kneading compaction produce specimens with significantly different permanent deformation responses to repeated shear loading. The effect of compaction procedure has been mainly attributed to the difference in the internal structure of the compacted mixes.
Internal structure refers to the distribution of aggregates and their associated voids. The air void distribution constitutes the first phase of the internal structure. The Superpave volumetric mixture design procedure focuses on average percent air voids for specifying and designing AC mixtures. Two specimens with the same average percent air voids may have a different distribution of air voids and intuitively are expected to respond differently under loading conditions. The next aspect of the internal structure of AC is aggregate distribution, orientation and contacts. Researchers have already established the relationship between the number of contacts and shear strength of granular assembly.
mathematical procedures to extract significant information from the picture. It is fast becoming a versatile tool for characterizing the internal structure of materials. The research group at UCB and Danish National Roads Laboratory (DNRL) used image analysis of plane specimens compacted using UCB rolling wheel, Texas Gyratory and California kneading compactors (8). Masad, et al, used DIP to quantify the internal structure parameters of specimens compacted using Superpave gyratory compactor and linear kneading compactor (9).
Aggregate Orientation:
The results of the image analysis of Masad, et al, show that the aggregates have preferred orientation toward the horizontal direction in SGC and they appear to have more of a random distribution in Linear Kneading Compactor (LKC) specimens. The average angle of inclination was found to be smaller for specimens compacted with the SGC than those compacted with the LKC.
DRNL’s image analysis confirms the hypothesis that a greater degree of aggregate orientation results from rolling wheel compaction compared with that produced by the Texas gyratory compactor. These findings support the hypothesis that Texas gyratory specimens’ lower resistance to permanent deformation under repetitive shear loads is at least partly related to the lack of a strong , oriented aggregate structure. On the other hand, the rolling wheel specimens’ greater resistance is a result of aggregate orientation and inter particle contact caused by the forces induced by the rolling alone because, unlike gyratory and kneading methods, rolling wheel compaction does not include any static leveling loading that might increase particle-to-particle contact by crushing aggregates together.
Contacts:
kneading compacted specimens is associated with the high number of coarse aggregate contacts.
Air voids distribution:
Asphalt aggregate mixtures compacted in the field usually have increasing air void contents from the top of the lift to the bottom. The reason for air-void gradients can be easily explained by the distribution of forces under a field compaction wheel which decrease with depth. Masad, et al, studied the air void distribution in SGC and LKC compacted specimens using X-ray tomography. The middle of the SGC specimen was compacted more than the top and the bottom. For the materials studied, the air voids were found to be relatively uniform between 20 and 100mm. In the LKC specimens, air voids were more concentrated at the bottom (Fig.2.1-2.4).
Rolling wheel compacted specimens would be expected to have increasing air void contents from the top to the bottom of the lift, as do field specimens. Air void contents are expected to be fairly homogeneous in the horizontal plane of the rolling wheel. Gyratory specimens are subjected to a high axial compressive stress, a side-to-side shear stress, and a torsional shear stress. Under high axial compressive stresses and many gyrations, it is expected that the interior of the specimen becomes better compacted. The torsional shear stress and the inability of aggregate to become oriented is thought to reduce compaction near the vertical walls of the specimen. As-compacted Texas gyratory and kneading compacted specimens appear to have different aggregate and air void structure near the mold surface than in their interior.
Figure 2.1 Horizontal X-ray Tomography Image of a SGC Specimen
Figure 2.3 Void Distribution in a SGC Specimen
2.2 Accelerated Wheel Tracking Devices
Accelerated laboratory rutting prediction tests are needed for design as well as quality control and quality assurance purposes. Laboratory wheel tracking devices potentially could be used to identify HMA mixtures that may be prone to rutting. Loaded wheel testers (LWT) are becoming increasingly popular with transportation agencies as they seek to identify hot mix asphalt mixtures that may be prone to rutting. The LWTs allow for an accelerated evaluation of rutting potential in the designed mixes (10)
2.2.1 Loaded Wheel Testers used in the United States
Several LWTs currently are being used in the United States. They include the Georgia Loaded Wheel Tester (GLWT), Asphalt Pavement Analyzer (APA), Hamburg Wheel Tracking Device (HWTD), LCPC (French) Wheel Tracker, Purdue University Laboratory Wheel Tracking Device (PURWheel), and one-third scale Model Mobile Load Simulator (MMLS3).
Georgia Loaded Wheel Tester
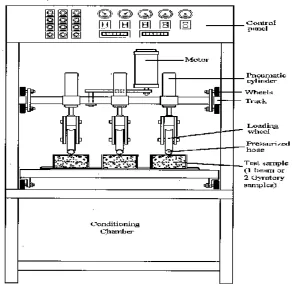
This load sequence was performed a total of four times. In 1995, Lai and Shami described a new method of compacting beam samples. This method utilized a rolling wheel to compact beam specimens. Laboratories prepared cylindrical specimens are generally 150 mm in diameter and 75 mm high. Compaction methods for cylindrical specimens have included the "loaded foot" kneading compactor and a Superpave gyratory compactor. Both specimen types are most commonly compacted to either 4 or 7 percent air void content. However, some work has been accomplished in the GLWT at air void contents as low as 2 percent (12). Testing of samples within the GLWT generally consists of applying a 445-N (100-lb) load onto a pneumatic linear hose pressurized to 690 kPa (100 psi). The load is applied through an aluminum wheel onto the linear hose, which resides on the sample. Test specimens are tracked back and forth under the applied stationary loading. Testing is typically accomplished for a total of 8,000 loading cycles (one cycle is defined as the backward and forward movement over samples by the wheel). However, some researchers have suggested fewer loading cycles may suffice. Test temperatures for the GLWT have ranged from 35°C to 60°C (95°F to 140°F). Initial work by Lai was conducted at 35°C (95°F). This temperature was selected because it was Georgia's mean summer air temperature. Test temperatures within the literature subsequently tended to increase to 40.6°C (105°F), 46.1°C (115°F), 50°C (122°F) (3, 8), and 60°C (140°F) (8). At the conclusion of the 8,000-cycle loading, permanent deformation (rutting) is measured. Rut depths are obtained by determining the average difference in specimen surface profile before and after testing. A template with 7 slots that fits over the sample mold and a micrometer is typically used to measure rut depth.
Asphalt Pavement Analyzer
by the Asphalt Vibratory Compactor. However, some have used a linear kneading compactor for beams. The most common compactor for cylindrical specimens is the SGC (13). Beams are most often compacted to 7 percent air voids; cylindrical samples have been fabricated to both 4 and 7 percent air voids. Tests can also be performed on cores or slabs taken from an actual pavement. Test temperatures for the APA have ranged from 40.6°C to 64°C (105°F to 147°F). Wheel load and hose pressure have basically stayed the same as for the GLWT, 445N and 690 kPa (100 lb and 100 psi), respectively.
Figure 2.6 Schematic Drawing of the APA
NCSU Wheel Tracking Device (CS 6000)
The NSCU Wheel Tracking Device (CS6000) was designed by James Cox & Sons. The NSCU Wheel Tracking Device was designed to simulate the field conditions of asphalt concrete pavements from construction to application. The system can compact a loose mixture to given density and then can quickly be configured to evaluate the compacted slab's rutting resistance. The NCSU WTD can also perform rutting analysis on slabs taken from field sections. A detailed explanation of the wheel tracking system is given in Chapter 5.
Hamburg Wheel-Tracking Device
from 25°Cto 70°C (77°F to 158°F), with 50°C (122°F) being the most common temperature. Loading of samples in the HWTD is accomplished by applying a 705-N (158-lb) force onto a 47-mm-wide steel wheel. The steel wheel is then tracked back and forth over the slab sample. Test samples are loaded for 20,000 passes or until 20 mm of deformation occurs. The travel speed of the wheel is approximately 340 mm per second.
The results obtained from the HWTD consist of rut depth, creep slope, stripping inflection point, and stripping slope. The creep slope is the inverse of the deformation rate within the linear region of the deformation curve after post compaction and prior to stripping (if stripping occurs). The stripping slope is the inverse of the deformation rate within the linear region of the deformation curve, after the onset of stripping. The stripping inflection point is the number of wheel passes corresponding to the intersection of the creep slope and the stripping slope. This value is used to estimate therelative resistance of the HMA sample to moisture-induced damage.
A slight modification of the HWTD was made by the Superfos Construction, U.S.(previously Couch, Inc.). This device was referred to as the Superfos Construction Rut Tester (SCRT). The SCRT used slab specimens with similar dimensions as the HWTD. The primary difference between the two was the loading mechanism. The SCRT applied an 82.6-kg (180-lb) vertical load onto a solid rubber wheel with a diameter of 194 mm and width of 46 mm. This loading configuration resulted in a contact pressure of approximately 940 kPa (140 psi) and contact area of 8.26 cm2(1.28 in2) which was applied at a speed of approximately 556 mm per second. Test temperatures ranging from 45°C to 60°C (113°F to 140°F) have been used with the SCRT. Recent research with the SCRT has used 60°C as the test temperature. An air void content of 6 percent was generally used for dense-graded HMA samples. Results from the SCRT are identical to those from the HWTD and include rut depth, creep slope, stripping slope, and stripping inflection point.
conducted in either wet or dry conditions. A 47-mm wide steel wheel is used to load specimens with 705 N (160lb) for 20,000 cycles or a 20-mm rut depth, whichever occurs first.
Figure 2.7 Model of HWTD
LCPC (French) Wheel Tracker
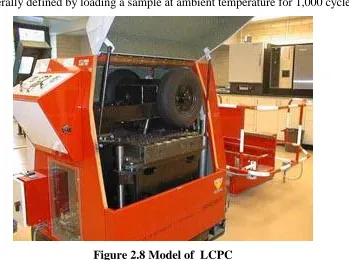
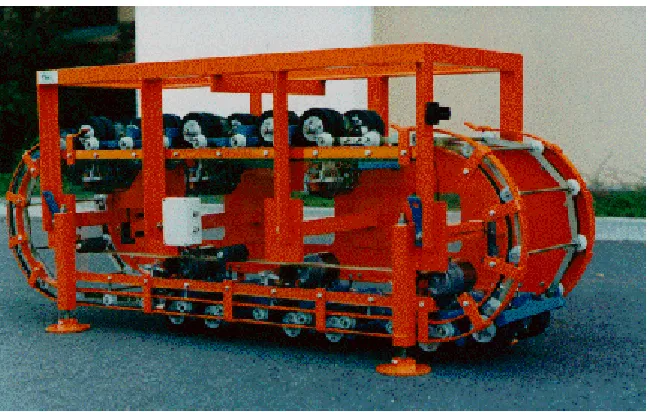
percentage of the original slab thickness. Deformation is defined as the average rut depth from a series of 15 measurements. These measurements consist of three measurements taken across the width of a specimen at five locations along the length of the slab. A "zero" rut depth is generally defined by loading a sample at ambient temperature for 1,000 cycles.
Figure 2.8 Model of LCPC
Purdue University Laboratory Wheel Tracking Device
The PURWheel, developed at Purdue University, tests slab specimens that can either be cut from the roadway or compacted in the laboratory. Slab specimens are 290 mm wide by 310 mm long (11.4 in x12.2 in). Thickness of slab samples depends upon the type mixture being tested. For surface course mixes, a sample thickness of 38 mm (1.5 in) is used while binder and base course mixes are tested at thickness of 51 mm and 76 mm (2 in and 3 in), respectively.
the ratio of the number of cycles to 12.7 mm of rutting in a wet condition to the 12.7 mm of rutting in the dry condition. The 12.7-mm rut depth is used to differentiate between good and poorly performing mixtures with respect to rutting. Loading of test samples in PURWheel is conducted utilizing a pneumatic tire. A gross contact pressure of 620 kPa (90 psi) is applied to the sample. This is accomplished by applying a 175-kg (385-lb) load onto the wheel that is pressurized to 793 kPa (115 psi). A loading rate of 332 mm/sec is applied. Testing is conducted to 20,000 wheel passes or until 20 mm of rutting is developed. PURWheel is very similar to the HWTD. However, one interesting feature about PURWheel is that it can incorporate wheel wander into testing. This feature is unique among the LWTs common in the United States.
Model Mobile Load Simulator (MMLS3)
The one-third scale MMLS3 was developed recently in South Africa for testing HMA in either the laboratory or field. This prototype device is similar to the full-scale Texas Mobile Load Simulator (TxMLS) but scaled in size and load. The scaled load of 2.1-kN (472-lb) is approximately one-ninth (the scaling factor squared) of the load on a single tire of an equivalent single axle load carried on dual tires, as shown in Figure 2.10. The MMLS3 can be used for testing samples in dry or wet conditions.
Figure 2.10 Model Mobile Load Simulator
An environmental chamber surrounding the machine is recommended to control temperature. Temperatures of 50°C and 60°C have been used for dry tests, and wet tests have been conducted at 30°C. MMLS3 samples are 1.2 m (47 in) in length and 240 mm (9.5 in) in width, with the device applying approximately 7200 single-wheel loads per hour by means of a 300-mm (12-in) diameter, 80-mm (3-in) wide tire at inflation pressures up to 800 kPa(116 psi) with a typical value of 690 kPa (100 psi). Wander can be incorporated up to the full sample width of 240 mm. Performance monitoring during MMLS3 testing includes measuring rut depth from transverse profiles and determining Seismic Analysis of Surface Waves moduli to evaluate rutting potential and damage due to cracking or moisture, respectively. Rut depth criteria for acceptable performance are currently being developed (17). Currently there is no standard for laboratory specimen fabrication, although research is being proposed to the Texas Department of Transportation.
2.2.2 Effect of Test Parameters and Mixture Properties on LWT Results
air voids and test temperature. This is primarily due to the fact that these two parameters have the most effect on test results, especially rut depths. As air voids increase, rut depths also increase. Likewise, as test temperature increases, rut depths increase.
Air void contents for each of the LWTs are generally specified based upon two concepts. First, some believe that specimen air void contents should be approximately 7 percent, since this air void content represents typical as-constructed density. Others believe that test specimens should be compacted to 4 percent air voids, as actual shear failure of mixes usually takes place below approximately 3 percent. Another test parameter that can significantly affect test results is the type and compaction method of test samples. The two predominant geometries of test specimens are cylinders and beams or slabs. For rutting, the literature indicates that the two sample types do provide different rut depths; however, both types generally rank mixes similarly. The primary reason is that these specimens are generally compacted by different methods. For instance, cylindrical specimens are typically compacted using the Superpave gyratory compactor while beam samples are generally compacted with a vibratory or kneading compactor. The method of compaction influences the density gradients, and aggregate orientation within samples.
Another test parameter that significantly affects test results is the magnitude of loading. A wide range of loadings are used in the different devices. Although a recent study indicated that small changes in the magnitude of loading may not affect LWT rut results, previous research has shown that significant differences in loadings can affect test results. For rutting, it has been shown that six hours at the test temperature is sufficient. If samples are not preheated sufficiently, low rut depths can be expected. Researchers have compared identical aggregates and gradations but using different binder grades in LWTs. When tested at similar temperatures, mixes containing stiffer grades of asphalt binder will provide lower rut depths.
2.2.3 LWT Results Versus Field Performance
Numerous studies have been conducted to compare results of LWT testing to actual field performance. Most of these studies have been to relate LWT rut depths to actual field rutting. In the development of the GLWT, the researchers used four mixes of known field rut performance from Georgia. Three of the four mixes had shown a tendency to rut in the field. Results of this work showed that the GLWT was capable of ranking mixtures similarly to actual field performance. A similar study conducted in Florida used three mixes of known field performance. One of these mixes had very good rutting performance, one was poor, and the third had a moderate field history. Again, results from the GLWT were able to rank the mixtures similar to the actual field rutting performance. The University of Wyoming and Wyoming Department of Transportation participated in a study to evaluate the ability of the GLWT to predict rutting. For this study, 150-mm cores were obtained from 13 pavements that provided a range of rutting performance. Results showed that the GLWT correlated well with actual field rutting when project elevation and pavement surface types were considered. The effect of elevation on rut depths was most likely due to different climates at respective elevation intervals. The Florida Department of Transportation conducted an investigation with the APA similar to the GLWT study described previously. Again, three mixes of known field performance were tested in the APA. Within this study, beams and cylinders were both tested. Results showed that both sample types ranked the mixes similar to the field performance data. A good correlation was found between the APA and the GLWT test results. The authors recommended that the average values within the ranges of 7 to 8 mm and of 8 to 9 mm may be used as a performance limiting criteria at 8000 cycles for beams and gyratory compacted specimens, respectively. Therefore, the authors concluded that the APA had the capability to rank mixes according to their rutting potential. Studies by Kandhal and Mallick (13) evaluated the APA for HMA mix design. They found that the APA had a fair correlation (R2 = 0.62) with the repeated shear constant height test with the shear tester.
testing to establish and validate the relationship between the performance of gyratory compacted and field compacted specimens.
The Colorado Department of Transportation and the FHWA's Turner FairbankHighway Research Center participated in a research study to evaluate the FRT and actual field performance. A total of 33 pavements from throughout Colorado that showed a range of rutting performance were used. The research indicated that the French rutting specification (rut depth of less than 10 percent of slab thickness after 30,000 passes) was too severe for many of the pavements in Colorado. Eleven of 15 sites failed the criteria despite good pavement performance. However, no sites that passed the French specification rutted in the field, and the sites that rutted in the field failed the specification. By reducing the number of passes for low-volume roads and decreasing the test temperature for pavements located in moderate to high elevations (i.e., colder climates), the correlation between the FRT results and actual field rutting was greatly increased.
which the pavement will be expected to perform. The second criterion is the assumption of laboratory compaction simulating field compaction. The authors quoted studies showing discrepancies between the field compaction and several laboratory compaction devices.
Three studies by the Texas Department of Transportation utilized the prototype MMLS3 to determine the relative performance of two rehabilitation processes and establish the predictive capability of this laboratory-scale device. For the first two studies, the MMLS3 tested eight full-scale pavement sections in the field adjacent to sections trafficked with the TxMLS. Field testing combined with additional laboratory testing indicated that one of the rehabilitation processes was more susceptible to moisture damage and less resistant to permanent deformation compared to the second process. This second process was less resistant to fatigue cracking. In addition, a comparison of pavement response under full-scale (TxMLS) and scaled (MMLS3) accelerated loading showed good correlation when actual loading and environmental conditions were considered. An ongoing third study aims to tie MMLS3 results with actual measured performance of four sections at WesTrack. A high testing temperature (60°C) was selected based on the critical temperature for permanent deformation during a 5-day trafficking period during which failure occurred for three of the four sections. Limited laboratory testing using the HWTD and the APA is also included in this study, but only the rankings from HWTD results show good correlation with actual performance. Results indicate that the MMLS3 is capable of correctly ranking performance of the four WesTrack sections.
Table 2.1 Recommended Criteria for LWT Devices Performance Tests Recommended Criteria Test Temperature
1st choice APA 8mm @ 8000 cycles High temperature for selected PG grade 2nd choice HWTD 10mm @ 20000 cycles 50oC
3rd choice FRT 10mm @ 30000 cycles 60oC
Based upon review of the laboratory wheel tracking devices and the related literature detailing the laboratory and field research projects, the following observations are provided.
* Both cylindrical and beam specimens, depending upon the type of wheel tracking device, can be used to rank mixtures with respect to rutting.
* Results obtained from the wheel tracking devices seem to correlate reasonably well to actual field performance when the in-service loading and environmental conditions of that location are considered.
* The wheel tracking devices seem to reasonably differentiate between performance grades of binders.
* Wheel tracking devices, when properly correlated to a specific site's traffic and environmental conditions, have the potential to allow the user agency the option of a pass/fail or "go/no go" criteria. The ability of the wheel tracking devices to adequately predict the magnitude of the rutting for a particular pavement has not been determined at this time.
2.3 Gyratory Compaction of Superpave Mixtures
enough for use in mixing facilities for quality control operations. Since no existing compactor achieved all these goals, the SGC was developed.
The primary device used in Superpave mix design is the Superpave Gyratory Compactor (SGC). The SGC is used to produce specimens for volumetric analysis, and it also records data to provide a measure of specimen density throughout the compaction procedure (19). The SGC consists of the following components:
* reaction frame, rotating base, and motor
* loading system, loading ram, and pressure gauge * height measuring and recording system
* mold and base plate
A loading mechanism presses against the reaction frame and applies a load to the loading ram to produce a 600 kPa compaction pressure on the specimen. A pressure gauge measures the ram loading to maintain constant pressure during compaction. The SGC mold has an inside diameter of 150mm and a base plate in the bottom of the mold provides confinement during compaction. The SGC base rotates at constant 30 gyrations per minute during compaction with the mold positioned at a compaction angle of 1.25 degrees.
Specimen height measurement is an important function of the SGC. Specimen density can be estimated during compaction by knowing the mass of material placed in the mold, the inside diameter of the mold, and the specimen height. Height is measured by recording the position of the ram throughout the test. Using these measurements, a specimen’s compaction characteristics are developed.
gyrations. However, if the mix is susceptible to loss of shear strength, its shear strength decreases after a certain number of gyrations.
A significant component of the Superpave Volumetric mix design protocol lies in the compaction process. The laboratory compaction process proceeds through three p: Nini which corresponds to the state of the mixture as the breakdown roller makes its first few passes, Ndes represents the anticipated state of density in the mixture after 3 to 5 years and Nmax represents a “factor-of-safety” condition should the traffic projections be seriously underestimated or the climate hotter than the anticipated (10). The densification curve (%Gmm vs. log N) would accurately represent the state of the mixture at any point in the anticipated life of the mixture, i.e., during construction and subsequently under traffic.
Bahia, et al, (20) introduced the concept of compaction energy indices by utilizing the SGC results to optimize the densification characteristics under construction and densification characteristics under traffic. The densification curves were separated into different regions to represent the construction compaction requirements and the traffic densification to selected air voids or to terminal densification. The compaction energy index (CEI) and the traffic densification index (TDI) are used to relate to construction and in-service performance of mixtures.
Based on the above concepts, new parameters incorporating gyrations, rate of change of height and gyratory shear were developed to relate gyratory compaction properties with the rutting behavior of mixtures. These parameters were either measured or derived from the data collected during compaction process. A few of these parameters is listed as follows (21):
1. Compaction slope (k)
2. Interaction of compaction slope with percentage of air voids (k x AV) 3. Number of gyrations to 92% density (N92)
7. Ratio of N98 to N95
8. Compaction Energy Index 9. Terminal Densification Index 10.Gyratory Shear Ratio (SR)
11.Number of gyrations for maximum shear ratio (N-SRmax)
3. RESEARCH METHODOLOGY
3.1 Problem Statement
The key components of Superpave system are the laboratory compaction methods using the SGC and performance prediction tests and models. The predicted performance should be a true indicator of field performance. The compaction method used in the laboratory should be symmetrical with field densification. So the effect of various compaction methods on the predicted performance of the mixtures is a critical research problem.
Due to the complexity and expensive of performance prediction tests such as shear tests, transportation agencies often use simple, less-expensive, loaded wheel testers such as the APA. These tests are simulation based tests unlike fundamental tests such as the shear tests. But the responses of the mixtures are believed to be related to the performance of the mixtures. These parameters are based on the change of density measured during the compaction process using the SGC as a function of number of gyrations. These surrogate measures should be compared to the results of fundamental tests.
3.2 Objectives and Scope of Study
In order to address the concerns and questions presented above, the primary objectives of this study are:
1. Evaluate the effects of compaction type (rolling wheel and Superpave gyratory
compactor) on mixture performance as measured by the APA, the NCSU Wheel Tracking
Device and the Repeated Shear Constant Height test (RSCH).
2. Evaluate the effects of changes in aggregate and asphalt source on mixture compaction
and predicted performance in the test systems listed in 1 above by using several
Superpave mixtures from different field sites in North Carolina.
3. Compare the predicted performance, as measured by the test systems listed above, of test
samples compacted in the field, to the same mixtures compacted using the laboratory
4. Evaluate and compare the densification characteristics of mixtures with varying degree
of compaction (in terms of number of gyrations) in the Superpave Gyratory Compactor
(SGC) and the Gyratory Load Cell Plate Assembly (GLPA).
3.3 Research Methodology and Approach
The research plan consisted of three main tasks. First, the field sites were selected from which test samples were collected. Secondly, loose mixtures using mixtures from these sites were compacted using Rolling Wheel Compactor (RWC) and Superpave Gyratory Compactor (SGC). Lastly, the performance of these laboratory compacted mixtures was compared to the performance of the field cores and slabs obtained from the selected sites. An outline of this work plan is given in Figure 3.1.
Figure 3.1 Research Plan
Task 1: Field Site Selection and Test Material Procurement
Since one of the objectives of this research was to evaluate how changes in aggregate and binder sources affect the performance evaluation of mixtures, typical mixtures were selected from different geographic regions in and out of North Carolina. Field specimens and loose mixtures were collected from these sites.
Field Mixtures
Test Systems
Lab Compaction
Field Cores
Field Slabs
Shear Tester
APA
NCSU WTD
GLPA
Rolling Wheel Compaction
Task 1.1 Site Selection:
The location and the total number of test sites were selected after consultation with NCDOT. Four test sites were selected in such a way that each test site had a different type of aggregate gradation (coarse or fine) and a nominal maximum size of aggregate (12.5mm or 9.5mm). The test sites were Auburn (NCAT research tracks), Kinston and Charlotte. NCDOT was the contractor for the North Carolina test sections in NCAT research tracks. The Kinston and Charlotte mixtures were from Kinston and Matthews counties in North Carolina. The aggregate sources for all the four mixtures were from the quarries in North Carolina. The detailed information about the mixtures is provided in the following chapters. These sites were the pavements that contain Superpave volumetrically designed mixtures being used in either new or overlay construction.
Task 1.2 Test Sample Procurement:
After the number and location of test sites were selected, test samples were gathered from each site. Test samples included field cores, field slabs and loose mixtures. Loose mixtures were procured for the compaction of the mixtures using SGC and Rolling Wheel compactor. Field cores and loose mixtures were taken from all four sites, whereas field slabs were available only for the Kinston and the Charlotte mixtures. Field cores were 150 mm in diameter. The thicknesses of field slabs were 75mm and 100mm for the Kinston and the Charlotte mixtures, respectively.
Task 2: Evaluation of Laboratory Compaction Methods
The central objective of this research was to evaluate how different laboratory compaction methods (RWC and SGC) differ from the field compaction in performance. The following subsections outline how each of these compaction methods was used to accomplish this phase of research.
Rolling Wheel Compaction using the NCSU Wheel Tracking Device:
lifts. Since the WTD rolling wheel compactor has been scaled and designed to match that of field compaction equipment, it is expected to simulate field compaction better than any other laboratory compaction method currently in use.
Cylindrical test specimens were cored out from the RWC slabs for repeated shear tests and APA tests. The test results of RWC specimens were then compared with the corresponding results of field cores and SGC compacted specimens. The rutting performance of rolling wheel compacted mixtures was evaluated by using accelerated test facility in the WTD and the results were compared to those from the APA.
Superpave Gyratory Compactor:
The SGC was used to fabricate cylindrical test specimens, with densities similar to those of the field mixtures, for testing in the SST and the APA. The rutting performance of these samples were compared to the samples compacted by the other laboratory methods and field cores. In addition to the use of the SGC as a compaction method for testing in the SST and the APA, one of the objectives of this study was to compare how the compaction curve of the SGC compares to the actual field density of the mixtures. Since the gyratory compactor is used to fabricate mixtures in the Superpave volumetric design procedure, Ndes should correspond to a mixture’s field density after construction, while the %Gmm should be 96%.
The compaction characteristics of the mixtures were studied and compared to the results from the Gyratory Load Plate Assembly (GLPA). The energy indices measured using the GLPA and the SGC better explains the compaction characteristics of the mixtures during construction and under traffic.
Task 3: Performance Evaluation
two other rutting evaluation tests: the NCSU wheel tracking device and the simple shear tester.
Asphalt Pavement Analyzer:
The APA basically consists of three parallel steel wheels, rolling on a pressurized rubber tube, which applies loading to beam or cylindrical specimens in a linear track. The test specimens, loading tubes and wheels are all contained in a thermostatically controlled environmental chamber. The depth of rutting in the test specimens is measured after the application of 8000 loading cycles. The predicted rutting measured by the APA is the central facet of the study. As mentioned above, Task 2 was to evaluate how the performance of sample fabricated using different laboratory compaction methods compared to that of the field specimens. The results of the APA tests were compared with the results of the Simple Shear Tester and the WTD at NCSU.
Simple Shear Tester:
The SST is a closed-loop system that consists of four major components: the testing apparatus, the test control unit and data acquisition system, the environmental control chamber, and the hydraulic system. In this proposed study, repeated shear test at constant height and frequency sweep test at constant height was used to analyze the performance of HMA mixtures. A full description of the test procedures can be found in AASHTO TP7. The rutting and fatigue analyses were then conducted using the test results.
The frequency sweep test at constant height was used to analyze the permanent deformation and fatigue cracking. A repeated shearing load was applied to the specimen to achieve a controlled shearing strain of 0.045 percent. The specimen was tested at each of the following loading frequencies: 10, 5, 2, 1, 0.5, 0.2, 0.1, 0.05, 0.02 and 0.01 Hz. The dynamic shear
modulus G* and phase angle φ were determined by this test.
to the specimen. The test specimens were subjected to load cycles of 5000 cycles or until the permanent strain reaches 0.045 percent that corresponds to the maximum allowable rut depth of 0.5 inch. One load cycle consists of 0.1-second load followed by 0.6-second rest period. The permanent shear strains are measured in this test.
NCSU Wheel Tracking Device:
In addition to providing a method to compact mixtures for further testing, the WTD is a sophisticated testing device to evaluate the rutting performance of mixtures. It has a rubber tire to apply a rolling pressure to a slab for a designed number of cycles. The amount of pressure applied by the wheel can be set constant or be variable, as can the wheel path itself (to simulate the effect of wandering traffic in the field). The rut depth is measured after a set number of cycles using a laser at predetermined points along the length of the slab. The test stops either at the set number of cycles or when the rut depth reaches a specified limit. The WTD not only ranks the performance of a mixture similar to the APA but also gives the rutting profile of the slab after every interval of rutting cycles.
Frictional Resistance by Gyratory Load Cell Plate Assembly:
A Gyratory Load Cell Plate Assembly (GLPA) was developed and initially tested at the University of Wisconsin, Madison. This device easily fits on most SGCs without modification and requires no deviation in the compaction procedure. The assembly consists of three load cells fixed between two parallel plates at an equal radial distance, 120o apart. The force on the three load cells is continuously monitored, along with sample deflection and height, throughout the fabrication process. The corresponding resultant force and eccentricity acting on the plates are then calculated.
potential of such a device to provide a measure of stability of asphalt mixtures. Furthermore, it offered an opportunity to see if the frictional resistance in the laboratory evaluation had any relationship to field performance.
3.4 Summary
∗ Four types of mixtures were selected for this study from different geographic locations in and out of North Carolina to study the effects of aggregate and binder type on the compaction of mixtures. Field slabs, field cores, and loose mixtures were procured from these test sites. The mixture densification information of mixtures was obtained.
∗ The laboratory compaction methods included the WTD rolling wheel compactor and the Superpave Gyratory Compactor. The cylindrical specimens fabricated using these compactors were tested using the SST and the APA. The test results were compared to the test results of field cores. Similarly the WTD rut test results of rolling wheel compacted slabs were compared to those of field slabs. The densification information generated by the SGC and the energy indices developed using the SGC and GLPA explained the compaction characteristics of the mixtures.