ISSN(Online): 2320-9801
ISSN (Print): 2320-9798
I
nternational
J
ournal of
I
nnovative
R
esearch in
C
omputer
and
C
ommunication
E
ngineering
(An ISO 3297: 2007 Certified Organization)
Vol. 4, Issue 8, August 2016
A Quantitative Approach to Measure
Effectiveness of Defect Prevention Process
Suvankar Dhar1, Suvra Nandi2
M. Tech, Nano Science & Technology, School of Material Science & Technology, Jadavpur University, Kolkata, India1 M.E Software Engineering, Department of Information Technology, Jadavpur University, Kolkata, India2
ABSTRACT: This article is a Proposal which provides a step-by-step guideline for ensuring a systematic defect prevention process and introduces a quantitative approach to measure the effectiveness of the process through a scoring model. It starts with identification of potential causes that usually impacts the defect prevention effectiveness. The proposed solution takes care of the most vital or critical causes as identified by the fish-bone-diagram analysis. The overall analysis method is segregated among five steps – fixing timeline, defect data collection, analysis technique, review process and reporting process. Each step is elaborated further with introduction of its own parameters. Especially, the review process introduces the scoring model on different aspects of defect prevention reporting which generates RAG (Red-Amber-Green) score for each independent entity. This RAG scoring is very helpful in portraying the current status of any project to senior management and helps in accurate judgment of improvement scope for the betterment of delivery quality and customer satisfaction.
KEYWORDS: Defect Prevention, Defect Density, Cost of Quality, Review, Defect, RAG Score,DP life-cycle,Quality
Managers
I. INTRODUCTION
The Defect Prevention process in any Software/IT organization is the back-bone of Deliverable Quality Management. In most of the cases this process suffers due to lack of a very systematic Defect Prevention (DP) process and need of any strong evaluation method to measure the effectiveness of the process.
In this article the entire DP process has been re-organized through different phases in such a way that the integrated approach adds value to the overall analysis and provides clarity on the entire DP life-cycle to all the stake-holders. Also a scoring mechanism has been proposed which can represent an equivalent quantitative measure of the effectiveness of process.
The execution of the proposed approach holistically consists of following phases or steps: fixing timeline, defect data collection, analysis, review and reporting. The entire “Analysis life-cycle” has been demonstrated with associated time-lines that involved stake-holders must stick to in order to make the execution effective and value adding to the organization as well customers. The feedback from Quality Managers or Leadership teams will help project teams to close the existing gaps in next analysis instance. The evaluated score helps the Leadership as well project teams to assess the level of effectiveness of the existing DP process. The Analysis Phase is the heart of the DP life-cycle, which is/to be actively done by the project team and must be aware on the month-on-month progress on relevantmetrics. The focus on Trend Analysis helps identification of gaps and potential improvement areas. Quality Managers in an Organization are responsible for reviewing and checking the effectiveness of Defect Prevention process. To achieve maximum review effectiveness in minimum time, it is a good practice to prepare standard review checklists and follow that uniformly for all project entities. That way Quality Managers get rid of writing descriptive review feedback which is time consuming.
ISSN(Online): 2320-9801
ISSN (Print): 2320-9798
I
nternational
J
ournal of
I
nnovative
R
esearch in
C
omputer
and
C
ommunication
E
ngineering
(An ISO 3297: 2007 Certified Organization)
Vol. 4, Issue 8, August 2016
Section V lists the expected benefits that can be achieved by implementing the proposed model
II. RELATEDWORK
There are many defect prevention strategies available in different journals. This work is based upon the literature review of few of those articles clubbed with authors’ real life project experiences in defect handling with preventive techniques.
[1]JÖRG RECH from Fraunhofer Institute for Experimental Software Engineering (IESE) talked about defect handling in Agile Software Development. Apart from regular process of code refactoring and inspection, he introduced annotation language in storing defect information which blocks reinvention of wheel at a later stage of inspection. [2]Suma V and T.R. Gopalakrishnan Nair explained the differences among Error, Fault and Failure; put special emphasis on Inspection process in effective defect prevention in their paper “Effective Defect Prevention Approach in Software Process for Achieving Better Quality Levels”. They provided guidelines about defect detection time and defect fixing time to be used in analysis, combined with Orthogonal Defect Classification (ODC).
[3] Leanne Howard, Account Director, PlanIt Software Testing proposed the idea of “The Defect Management Meeting” as part of Agile Development in his article “Agile – Why the Fear?” from PlanIt Software Testing journal. His time-boxed defect management meeting serves the purpose of prioritization of defects as well as status tracking, while the key challenge of this type of meeting is “defect ping pong” – means forward and backward movement of defects among individuals.
[4] Another Agile Development defect management approach as cited by Rida Noor, Muhammad Fahad Khan in their article “Defect Management in Agile Software Development” focuses various attributes like Quality Assurance Methods, Defect Handling Techniques and Priority Setting to work together in achieving effective prevention of defects. In this article quality assurance methods include Software Inspection, Testing, Product metrics and Refactoring. Four major techniques to reduce defects are Defect Prevention, Defect Removal, Defect Tolerance and Defect Forecasting. Here mainly four severity levels are suggested: Critical, Serious, Moderate and Low.
[5] Hafiz Ansar Khan's "Establishing a Defect Management Process Model for Software Quality Improvement" article suggests mainly three levels: Defect Detection, Defect Analysis and Defect Prevention. Its prevention level focuses on Failure Mode Effect Analysis (FMEA) and Fault Tree Analysis (FTA).
[6] Varsha G. Palatse and Prof. V. S. Nandedkar published a survey on Software Defect Prediction using Data Mining Tools and explained how Defect Prediction plays an important role in preventing potential defects.
[7] Bhagavant Deshpande and Suma V published a survey where relationship among project complexity, its defect count etc control the CSI. This survey has considered 10 projects from CMMI Level 5 Organizations and comparative analysis is presented.
ISSN(Online): 2320-9801
ISSN (Print): 2320-9798
I
nternational
J
ournal of
I
nnovative
R
esearch in
C
omputer
and
C
ommunication
E
ngineering
(An ISO 3297: 2007 Certified Organization)
Vol. 4, Issue 8, August 2016
III.RCA–POTENTIALCAUSESFORINEFFECTIVEDEFECTPREVENTIONPROCESS
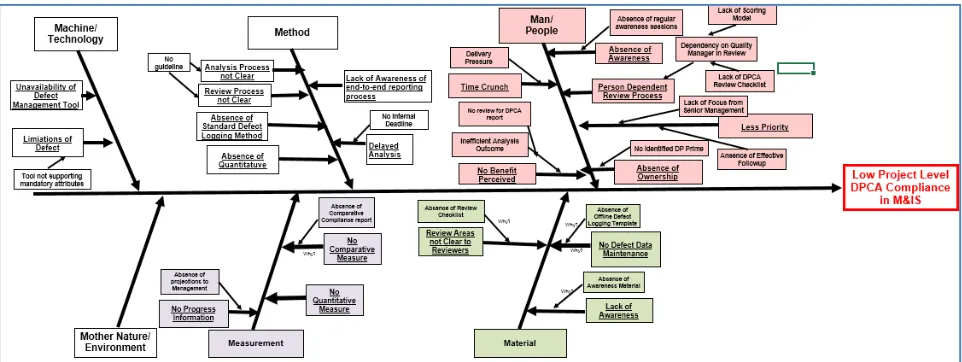
Figure 1: Fishbone diagram for IneffectiveDefect Prevention Process
This fishbone diagram is prepared using 6M principle of Toyota Production System (TPS). The potential causes for Inefficient Time Management are contributed by Man / People, Material, Method /Process and Measurement. Our solution tries to address these elementary level causes as much as possible.
Below are short explanations for each and every cause: Causes pertaining to Man or People:
1. Time Crunch: Due to Time Crunch in delivery schedules especially when teams work in Agile mode, teams avoid going through Defect Prevention analysis practices
2. No Benefit Perceived: Due to inefficiency in analysis process teams are not able to perceive any benefits from detailed analysis process and they lose interest in it
3. Absence of Awareness: The basic necessity of an analysis process and its purpose are often not communicated to teams due to lack of proper awareness building sessions
4. Person Dependent Review Process: Due to lack of explicit review techniques, different quality managers review defect prevention analysis process in different ways. Review process plays a very important role in achieving its intended effectiveness
5. Lack of Priority Setting: In everyday rush of delivering products to customer, quality improvement idea generation or analysis activities get less priority. As a result these activities normally get delayed or totally avoided
6. Lack of Ownership: Like all other process areas, defect prevention analysis process too need dedicated ownership absence of which leads to irregular execution of activity
Causes pertaining to Method or Process:
ISSN(Online): 2320-9801
ISSN (Print): 2320-9798
I
nternational
J
ournal of
I
nnovative
R
esearch in
C
omputer
and
C
ommunication
E
ngineering
(An ISO 3297: 2007 Certified Organization)
Vol. 4, Issue 8, August 2016
2. Lack of Standard Defect Logging Method: Quite often entities fail maintaining defects in a systematic way, with necessary analysis parameters due to lack of tool or lack of prior planning. Absence of all defects make the analysis inefficient.
3. Absence of Quantitative Feedback: Quantitative Feedback helps accurate judgement of any entity. Hence defect prevention effectiveness should be measured through pre-defined scoring model
4. Delayed Analysis: Timeline of any analysis is very crucial as window of opportunity lies within that timeline itself. Perceptions change as time progresses. Hence fixing analysis timeline and following it is another aspect of effectiveness
Causes pertaining to Machine or Technology:
1. Unavailability of Defect Management Tool and its Limitations: Often defect management tools do not provide provisions for necessary analysis attributes like defect cause, defect type, defect severity and defect detection phase. Teams need to take additional responsibility to include these information for all internal and external defects
Causes pertaining to Material:
1. Unavailability of Defect Data, Training Materials: Lack of Defect Data is the most severe materialistic issue in carrying out analysis. Apart from that Training Materials and Guidelines related to basics of defect prevention model, its analysis process, its review process are important elements in propagating knowledge
Causes pertaining to Measure or Inspection:
1. Absence of Progress Information & Comparative Trends: Positive or Negative progress information for each entity in an Organization with respect to certain metrics are necessary for stakeholder to have an idea of the entity’s health and its required action points
2. Absence of Quantitative Measure: Numeric Scoring is necessary for accurate performance analysis and it also gives insight into other similar entities; hence stimulate comparative analysis
IV.PROPOSED STRUCTURE OF EFFECTIVE DEFECT PREVENTION PROCESS
Steps for Defect Prevention Process Owner
Defect Data Maintenance
Analysis Technique
Report Review Process
Dashboard Reporting to Management
-Frequency of Reporting -Metrics
-Trend Analysis -Prevention Planning
-Review Checklist -Qualitative Feedback -Reporting Parameters
-Stakeholder Identification -Report Structure -Mandatory Parameters
-Why-Why Analysis for High Severity Defects
ISSN(Online): 2320-9801
ISSN (Print): 2320-9798
I
nternational
J
ournal of
I
nnovative
R
esearch in
C
omputer
and
C
ommunication
E
ngineering
(An ISO 3297: 2007 Certified Organization)
Vol. 4, Issue 8, August 2016
Overall Process flow can be depicted using below flow structure diagram:
A. Fixing Timeline
Determination of activity wise timeline is very important for maintaining the rigor among employees. It ensures uniformity of reporting process across all entities in an Organization.
Below is the proposed timeline which is feasible to implement and provides good result:
Activity Timeline (Days of Month)
Initiation of Defect Prevention Analysis Process 1st Day to 3rd Day Reporting by entities to Quality Managers for review 20th Day Review of Defect Prevention Analysis reports by Quality managers 25th Day Defect Prevention Dashboard to Senior Management 30th Day Termination of Defect Prevention Analysis Process 30th Day
Figure 2: Activity wise Suitable Timeline
B. Defect Data Maintenance
Maintaining high quality defect data is an important aspect for achieving efficient defect prevention analysis process. The only criteria is each and every defect data needs to be logged irrespective of defect identification or defect injection step.
1. Mandatory Parameters:
For enabling analysis process below listed five defect parameters must be provided with reasonable values: i. Defect Description
ii. Defect Severity iii. Defect Type iv. Defect Cause
Defects Received
Defects Resolved
Log Defect Data with Mandatory Parameters Initiation of DP
Analysis Process
(1st – 3rd day)
DP Report Sharing
(By 20th Day)
DP Report Review by QM
(By 25th Day)
DP Dashboard Reporting to Senior Management
(By 30h Day)
Termination of DP Analysis Process
(By 30h Day)
Score Generation
ISSN(Online): 2320-9801
ISSN (Print): 2320-9798
I
nternational
J
ournal of
I
nnovative
R
esearch in
C
omputer
and
C
ommunication
E
ngineering
(An ISO 3297: 2007 Certified Organization)
Vol. 4, Issue 8, August 2016
2. Why-Why Analysis:
It is good and safe practice to go through why-why Analysis for each and every high severity defect in order to capture its actual root cause, instead of assuming its cause. This is because high severity defects normally come with high impact and it is necessary to confirm their actual causes for proposing preventive action.
C. Analysis Technique
This section describes necessary techniques to be followed by entities which are going through Defect Prevention and Analysis Process on a predefined frequency. It contains necessary parameters and provides parameter wise guidelines which can be utilized by independent entities for ensuring an effective analysis. Listed are the necessary attributes combination of which can help in building analysis strategy.
1. Frequency of Reporting
Standard reporting frequency should be monthly, or based on presence of deliverables. Teams may decide to go for regular monthly analysis irrespective of whether deliveries are made in that month or not.
In case of no deliveries in a particular month teams may focus on already open preventive actions and track their progress.
In another way, teams may decide to go for Defect Prevention analysis only when they deliver. So every time new analysis as well as preventive action tracking take place.
2. Metrics
Listed are useful Metrics and their formulae which can be used for defect prevention analysis process:
Metric Name Formulae Purpose
Defect Free Delivery(DFD)
(No of deliverable where severity 1 acceptance testing bugs = 0 and severity 2 acceptance testing bugs = 0) *
100 / (no of deliverables in the period considered)
Measures Quality of Delivery Appraisal Defect
Density
(No. of defects)/(Total Review and Testing Effort) Measures how many defects per unit of review and testing effort is able to
capture % Rework (Rework Effort) * 100 / (Total Effort) Measures Effort
Consumption forFailure Resolution % Cost of Quality (Preventive Effort + Appraisal Effort + Rework Effort) * Measures Extent of Quality
Finalize Reporting Frequency
Gather Last Three Instances Defect Data
Analyse Metrics Derived from Defect Data
Perform Trend Analysis for all Metrics
ISSN(Online): 2320-9801
ISSN (Print): 2320-9798
I
nternational
J
ournal of
I
nnovative
R
esearch in
C
omputer
and
C
ommunication
E
ngineering
(An ISO 3297: 2007 Certified Organization)
Vol. 4, Issue 8, August 2016
(COQ) 100 / Total Effort Maintenance Cost % Total Defect
Containment Effectiveness(TDCE)
(No of pre-delivery defects) * 100 / (total no of defects) Measure of Internal Review and Testing Process
Effectiveness %Bad Fix(BF) (No of Re-Opened problems) * 100 / (no of problems
resolved)
Measures Efficiency of Fix %Review
Efficiency(RE)
(No. of defects captured in Review) * 100 / (No. of defects captured in Testing)
Measures Efficiency of Review versus Testing Mostly occurring
Defect Cause
Topmost Defect Cause from last Three Instance Trend Most Important Defect Cause Mostly occurring
Defect Type
Topmost Defect Type from last Three Instance Trend Most Important Defect Type % High Severity
Defect
(No. of Severity 1 and Severity 2 defects) * 100 / (Total No. of Defects)
Measures Impact of Defects %SLA Compliance (No. of Resolved PRs/Incidents where SLA is met in the
window) / (No. of resolved PRs/Incidents in the window)
Measures Consistency of Meeting Service Level
Targets Backlog Management
Index
(No of Requests Closed during the month) / (Opening Balance for the month + No. of Request Scheduled to be
closed during the month + No. of Early Closures in the month)
Measures Efficiency of Handling Backlog Tickets
Figure 3: Metrics to be used in Defect Prevention Analysis – Formulae and Purpose
3. Trend Analysis
For effective analysis it is recommended not to rely on single month’s metric values in order to avoid any special cause of variation which may be applicable only for a particular month. It has been observed that last three months or last three instances trend makes more sense in identifying project’s common concerns. Hence in this process we propose all applicable entities to follow at least last three months’ or last three instances’ trend before planning any action.
4. Prevention Planning
Based on trend analysis, mostly occurring pain needs to be selected for improvement. Hence Preventive planning for that particular pain area requires planned action to be taken. Planned action ensures permanent removal of identified gap. Listed below are important aspects of preventive planning which improves effectiveness:
i. Planning specific action which can be monitored ii. Assigning dedicated owner to each action iii. Planning closure date
iv. Monitoring status (Open/Closed) in every analysis v. Tracking %age Completion for all Open actions vi. Listing further action needed for all Closed actions
vii. Planning improvement projects or best practices from closed actions
D. Report Review Process
ISSN(Online): 2320-9801
ISSN (Print): 2320-9798
I
nternational
J
ournal of
I
nnovative
R
esearch in
C
omputer
and
C
ommunication
E
ngineering
(An ISO 3297: 2007 Certified Organization)
Vol. 4, Issue 8, August 2016
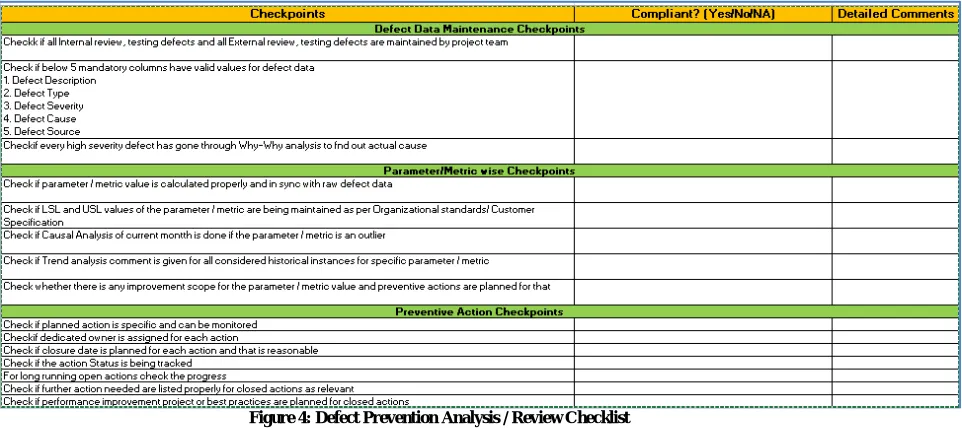
uniformly for all project entities. That way Quality Managers get rid of writing descriptive review feedback which is time consuming.
Below is a proposed checklist which can be used in a generic way by Quality Managers:
Figure 4: Defect Prevention Analysis / Review Checklist
2. Quantitative Feedback Mechanism
Figure 5: Standard Scoring Parameters and their RAG Criteria
E. Defect Prevention Dashboard Reporting
1. Stakeholder Identification
Stakeholder identification is a crucial part of any reporting. It plays a vital role in putting entities into perspective and helps better judgement of project’s current performance level with its potential improvement scope. Any managerial level employee who has significant impact on the project’s quality aspects and can take decisions on to be process must be included in stakeholder list and notified the status.
2. Reporting Parameters
ISSN(Online): 2320-9801
ISSN (Print): 2320-9798
I
nternational
J
ournal of
I
nnovative
R
esearch in
C
omputer
and
C
ommunication
E
ngineering
(An ISO 3297: 2007 Certified Organization)
Vol. 4, Issue 8, August 2016
Below are sample report structures created separately for Development and Support projects
Figure 6: DP Reporting Structure for Development Projects
Figure 7: DP Reporting Structure for Support Projects
V. BENEFITS
1. Helps improving efficiency of Defect Prevention & Analysis process
2. Provides explicit guideline for entities or project teams in carrying out this analysis 3. Builds regular causal analysis rigor
4. Ensures systematic maintenance of defect data with mandatory attributes 5. Quantitative feedback mechanism helps identifying gaps more rigorously
6. Consolidated dashboard helps stakeholder gauge a project about its existing performance standard 7. Trend Analysis helps identifying common gaps existing in a project
8. Systematic analysis and step by step procedure generates Performance Improvement scope
REFERENCES
[1] JÖRG RECH; Fraunhofer Institute for Experimental Software Engineering (IESE) ;“Handling of Software Quality Defects in Agile Software Development”; [email protected], http://www.iese.fraunhofer.de
[2] Suma. V., and T. R. Gopalakrishnan Nair; “Effective Defect Prevention Approach in Software Process for Achieving Better Quality Levels”; World Academy of Science, Engineering and Technology 42 2008
https://arxiv.org/pdf/1001.3552
[3] Rida Noor, Department of Software Engineering, University of Engineering & Technology, Taxila, Pakistan; Muhammad Fahad Khan, Department of Software Engineering, University of Engineering & Technology, Taxila, Pakistan; "Agile – Why the Fear?";PlatIt Software Testing www.planittesting.com%2Fgetattachment%2FInsights%2F2010%2FAgile-Why-the-Fear%2FAgile-Why-the-Fear.pdf
[4] Rida Noor, Department of Software Engineering, University of Engineering & Technology, Taxila, Pakistan & Muhammad Fahad Khan, Department of Software Engineering, University of Engineering & Technology, Taxila, Pakistan;"Defect Management in Agile Software Development"; I.J. Modern Education and Computer Science, 2014, 3, 55-60
http://www.mecs-press.org/
[5] Hafiz Ansar Khan; "Establishing a Defect Management Process Model for Software Quality Improvement"; International Journal of Future Computer and Communication, Vol. 2, No. 6, December 2013
www.ijfcc.org/papers/232-B10100.pdf
[6] Varsha G. Palatse, ME Student, Dept. of Computer Engineering P.V.P.I.T, Bavdhan, Pune, Maharashtra, India and Prof. V. S. Nandedkar, Assistant Professor, Dept. of Computer Engineering P.V.P.I.T, Bavdhan, Pune, Maharashtra, India; “A Survey on Software Defect Prediction Using Data Mining Techniques”; International Journal of Innovative Research in Computer and Communication Engineering, Vol. 3, Issue 11, November 2015
http://ijircce.com/upload/2015/november/185_A_Survey.pdf
ISSN(Online): 2320-9801
ISSN (Print): 2320-9798
I
nternational
J
ournal of
I
nnovative
R
esearch in
C
omputer
and
C
ommunication
E
ngineering
(An ISO 3297: 2007 Certified Organization)
Vol. 4, Issue 8, August 2016
[8] Sreenivasa Pisupati, Vice President, W3Softech India Private Limited; “DEFECT PREVENTION AND CAUSAL ANALYSIS IN SOFTWARE ENGINEERING”;
http://www.w3softech.com/images/whitepaper-pdfs/Defect%20%20Prevention%20and%20Causal%20Analysis%20in%20Software%20Engineering.pdf
[9]Suvra Nandi; "Quality Maintenance Effort Optimization in Software Industry"; International Journal of Computer Sciences and Engineering, Volume-04 , Issue-05 , May – 2016
http://www.ijcseonline.org/pdf_paper_view.php?paper_id=903&9-IJCSE-01667.pdf
[10] Suvra Nandi, Suvankar Dhar; "A new Proposition for Software Code Review Process"; International Journal of Computer Sciences and Engineering,Volume-04,Issue-06,June-2016
http://www.ijcseonline.org/pdf_paper_view.php?paper_id=969&15-IJCSE-01673.pdf
BIOGRAPHY
Mr. Suvankar Dhar has completed his M.Tech in Nano Science & Technology from Jadavpur University, Kolkata on 2008. He has almost 8 years of experience with Multi National Organisation in Development, Maintenance and Production Support projects having expertise in the area of Software Engineering Process and Quality Management. He has helped different real life project teams to sustain the alignment with ISO, CMMI Level 5 organization standards. He is also a Six Sigma Green Belt certified professional
Ms Suvra Nandi has completed her B.E in “Computer Science & Technology” from Bengal Engineering & Science University, Shibpur, Howrah during the year 2006.