Division V
Evaluating the effects on Structure-Soil-Structure Interaction in Commercial
Nuclear Power Plants
Parthasarathy Chandran1, Benny Jebuna Ratnagaran1
1 Engineer, Risk Informed Engineering, Southern Company, AL, USA
ABSTRACT
After the Fukushima earthquake, the Nuclear Regulatory Commission had requested through the 50.54(f) letter, that all the utilities to assess the effects of ground motion response spectra at their site. This has created opportunities for seismic PRAs (SPRA) to be developed.
As part of the SPRA, it is essential to compute the in-structure response spectrum at SSCs location. Classical soil-structure interaction is used to compute the in-structure response spectrum, where the building with surrounding soil is modeled and evaluated. The effect of Structure-Soil-Structure Interaction (SSSI) on structural response of the nuclear power plant structures is not generally accounted for.
In this study, two sets of analyses are performed to demonstrate the influence of SSSI. Firstly, the SSSI effects between heavy buildings, which are separated by seismic gaps, are investigated. The buildings are analysed based on two models; independent considering the effect of Soil-Structure Interaction (SSI) alone and then including the surrounding structures. The response parameters such as transfer functions, stresses and response spectrum between these models are compared to assess the impact of SSSI.
Secondly, the SSSI effects on a lightly heavy building (e.g. Diesel Generator Building) due to the surrounding heavy buildings are examined. Initially, the analysis is performed by placing the lighter building at a distance very close to the heavy buildings and then the distance is increased linearly for each successive analysis. From the results, the influence of SSSI on the smaller building is quantified as a function of location relative to the large buildings.
INTRODUCTION
Following the accident at the Fukushima Dai-ichi nuclear power plant (NPP) resulting from the March 11, 2011, Great Tohoku Earthquake and subsequent tsunami, the Nuclear Regulatory Commission (NRC) issued a letter on March 12, 2012 NRC (2012). The letter requests that licensees and holders of construction permits under 10 CFR Part 50 re-evaluate the seismic hazards at their sites against present-day NRC requirements and guidance. A comparison between the re-evaluated seismic hazard and the design basis is performed, in accordance with the guidance published in EPRI’s SPID (2013). If the comparison is concluded that the ground motion response spectrum (GMRS), which was developed based on the re-evaluated seismic hazard, exceeds the design basis seismic response spectrum in the 1 to 10 Hz range, and a seismic risk assessment is required. Typically, a seismic PRA (SPRA) has been developed to perform the seismic risk assessment in response to the 50.54(f) letter NRC (2012).
These seismic PRAs are performed to meet and peer reviewed against the ASME SPRA Standard (2013). The response analysis portion of the standard states the following: “When the design response analysis models are judged not to be realistic and state of the art, or when the design input ground motion is significantly different from the site-specific input motion, PERFORM new analysis to obtain realistic structural loads and floor response spectra”. The word that is important and frequently missed by analysts is realistic.
et al (2013), this is generally where the realism is missed. The goal of this paper is to identify when would it be imperative for an analyst to consider SSSI to obtain realistic structural loads and floor response spectra.
GENERAL PLANT DESCRIPTION
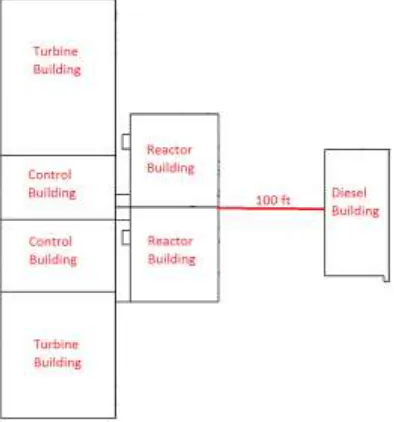
The nuclear power plant consists of two BWR NSSS units. For SS1, three structures are of interest--two reactor buildings, diesel generator building while turbine and control buildings are modelled as part of the analysis but are not assessed in this study. The reactor building is composed of a classic shear wall type building and bulb shaped drywell for the internal structure. The shear wall structure is a reinforced concrete structure with steel framing system on top. For this study, the internal structure includes both the drywell and a simplified stick model for the NSSS itself. These two structures interact through the foundation and star truss at the top of the drywell. The second structure, Diesel Generator Building, is founded at the plant grade while the reactor building is a deeply embedded structure. The diesel building (DB) is located around 100’ from the reactor-control-turbine (RCT) building complex. The buildings located within the RCT complex have a three-inch seismic gap between them. The plan including the buildings of interest is shown in Figure 1.
Figure 1. Plan for the nuclear power plant
NUMERICAL MODEL OF BUILDINGS
Superstructure
The 3-D Finite Element Models developed for this study was ensured to have an adequate
number of discrete mass degrees of freedom to capture the global and local translational, rocking, and
torsional responses of the structures. The element size was selected such that the dynamic response of the structure and the SSI effects will be adequately captured. The mesh size also ensures that the structures with full (uncracked concrete) stiffness properties could capture the local responses and responses of significant modes of vibration with frequencies equal to or below 30 Hz. For wave passage in the structure, to transmit shear waves with frequencies up to 30 Hz, the maximum element size shall not be greater than one fifth of the wave length to be transmitted SC-SASSI (2016).
Structural walls are modeled as center-lined shell elements with their full un-cracked thickness for capturing the membrane and bending behavior. Slabs are modeled as center-lined shell elements with full un-cracked thickness for membrane and bending behavior. Concrete beams and columns are modeled as frame elements with un-cracked sections. Steel trusses, beams and columns are modeled as elastic frame elements.
SAP2000 (2015) was used to calculate the mass of the structure by application of shell, solid and frame element volume with a specified density. Thus, the mass is distributed throughout the structure. Seismic mass includes equipment loads, floor live load and misc. equipment load. The sample finite element model is shown for the reactor building in Figure 2.
Figure 2. Schematic of the FEM Model
Foundation
The structural foundation and excavated soil block was generated separately using eight-node solid elements. High-stiffness springs were used for connecting the structure foundation to the superstructure. Instead of using classic approach of sharing the nodes between structure and excavated soil block at interfaces, structure and excavated soil block were connected using rigid links. High stiffness spring elements were used as the interacting agent between the excavated soil block and the structure. A maximum mesh size was based on the shear wave velocity of the underlying soil the foundation and the excavated soil model were interacting with. for mesh-refinement of the structure foundation elements. The criterion was identified in the SC-SASSI (2016), which states that the distance between two adjacent interaction nodes must not exceed one-fifth the wavelength at the highest frequency of analysis.
INPUT GROUND MOTIONS
Reactor Building Unit 1 and Unit 2 (Analysed as Embedded)
Figure 3. Spectral Shapes – Reactor Building Analyses
Diesel Building and RCT Complex (Analysed as Surface Founded)
One set of acceleration histories (two horizontal components and one vertical component) are generated to match the target spectra at the grade level. A total of three acceleration time histories (2 x 1 = 2 for the horizontal direction and 1 x 1 = 1 for the vertical direction) are generated. Figure 4 presents the spectral shapes of the input motion in the horizontal direction for the diesel building and RCT complex analyses.
Figure 4. Spectral Shapes – Diesel Building and RCT Complex Analyses
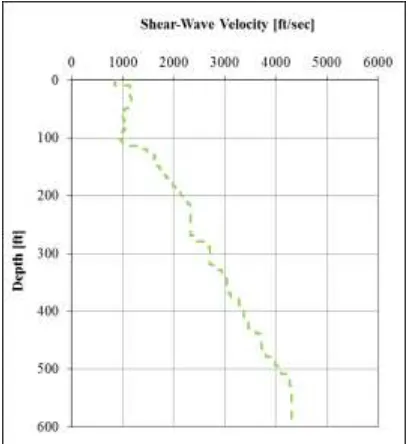
SOIL PROFILE
passing the cut-off frequency of 30 Hz. The cut off frequency of 30 Hz was based on the energy content of the input motion spectra. The energy content of the input motion spectra completely fades at frequencies above 30Hz.
Figure 5. Shear-Wave Velocity Vs Depth
SOIL-STRUCTURE INTERACTION (SSI) ANALYSES
Reactor Building (Analysed as Embedded) / Diesel Building (Analysed as Surface Founded)
The SSI analysis for one of the reactor building is analysed as an embedded structure considering coherent seismic input. To perform SSI analysis, structure foundation and the excavated soil block are added to the initial fixed-base FEM. Sensitivity studies are conducted to ensure there is satisfactory alignment between the two models. The SSI analysis for the diesel building is analysed as a surface founded structure considering coherent seismic input.
STRUCTURE-SOIL-STRUCTURE INTERACTION (SSSI) ANALYSES
The SSSI analyses are performed using SC-SASSI (2016) for the following cases:
•Reactor Building Unit 1 and 2 (Analysed as Embedded)
oSSSI effects between heavy buildings are investigated.
•Diesel Building and RCT Complex (Analysed as Surface Founded)
oSSSI effects on a lightly heavy building (e.g. Diesel Generator Building) due to the
surrounding heavy buildings are examined.
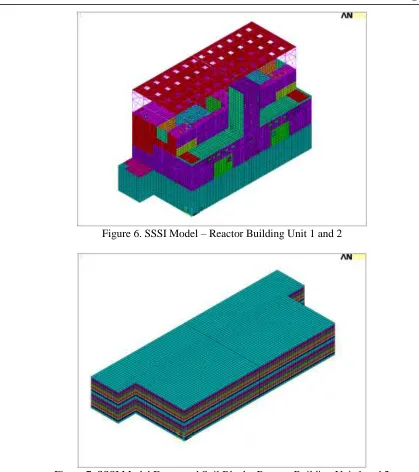
Reactor Building Unit 1 and Unit 2 (Analysed as Embedded)
Figure 6. SSSI Model – Reactor Building Unit 1 and 2
Figure 7. SSSI Model Excavated Soil Block– Reactor Building Unit 1 and 2
Diesel Building and RCT Complex (Analysed as Surface Founded)
The RCT complex comprises of the reactor building, turbine building, and control building. The diesel building is located about 100’ from the RCT complex. The SSSI analysis for this configurated is performed by placing the diesel building at a distance one feet close to the RCT complex and then at increasing distance, including the actual 100’ distance, for each successive analysis. Additionally, free field modes are placed at various distances from the RCT complex and the responses are extracted. The overall superstructure for the SSSI analysis is shown in Figure 8. The SSSI analysis of the diesel building and the RCT complex utilize the Direct Method.
RESPONSE COMPARISON
With two buildings that are similar in weight and stiffness properties, it is expected that the dynamic properties of the reactor building would not be influenced. After careful examination of the transfer functions and based on Figure 9, it is clear the response values is strongly influenced by the presence of the adjacent unit. Even though the variation may only be shown to be around 15%, it may be concluded that the comparatively heavy buildings has strong influence on the dynamic response analysis based on the stiffness of the underlying soil material.
Figure 8. SSSI Model – Diesel Building and the RCT Complex
Diesel Building and RCT Complex
The effect of the SSSI on the response of the diesel building was assessed by comparing the results of the analysis with and without the interaction between the RCT complex. The results show more than 20% change response at the soil column frequency which clear shows the effect of SSSI as plotted in Figure 10. The effect of SSSI on the diesel building can be considered substantial. The distance up to which a heavy and large footprint building/complex would influence the ISRS of smaller inertial mass building is analysed in detail in the next section.
0.8 0.9 1 1.1 1.2
0.1 1 10 100
R
at
io
of
S
SS
I/S
SI
Frequency (Hz)
0 0.1 0.2 0.3 0.4 0.5 0.6 0.7
0.1 1 10 100
Sp
e
ct
ra
l
A
cc
e
le
ra
tio
n
(
g
)
Frequency (Hz)
SSI SSSI
a) Ratio of SSSI to SSI b) Representative ISRS
0.6 0.8 1 1.2 1.4
0.1 1 10 100
R at io of S SS I/S SI Frequency (Hz) 0.00E+00 5.00E-02 1.00E-01 1.50E-01 2.00E-01 2.50E-01 3.00E-01 3.50E-01 4.00E-01 4.50E-01
0.1 1 10 100
Sp e ct ra l A cc e le ra tio n ( g) Frequency (Hz) SSI SSSI
a) Ratio of SSSI to SSI b) Representative ISRS
Figure 10. ISRS Comparison – Diesel Building – Top of the Structure – Along the Direction of the RCT Complex
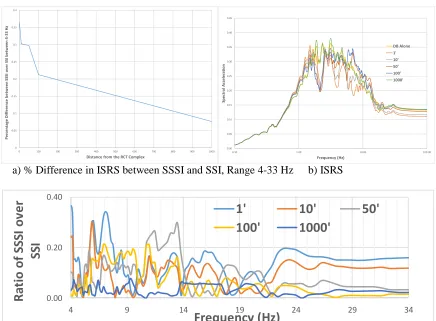
Diesel Building as a Function of Distance from RCT Complex
This part of the paper is striving to identify the conditions at which SSSI should be considered and would have significant influence on the dynamic response on a structure. This was evaluated by placing the diesel building at a varying distance from 1ft to 1000ft, from the RCT complex, to simulate a
0 0.05 0.1 0.15 0.2 0.25 0.3 0.35 0.4
0 100 200 300 400 500 600 700 800 900 1000
P e rc e nt ag e D if fe re nc e be tw e e n SS SI ov e r SS I be tw e e n 4 -3 3 H z
Distance from the RCT Complex
0.00 0.05 0.10 0.15 0.20 0.25 0.30 0.35 0.40 0.45
0.10 1.00 10.00 100.00
Sp e ct ra l A cc e le ra tion Frequency (Hz) DB Alone 1' 10' 50' 100' 1000'
a) % Difference in ISRS between SSSI and SSI, Range 4-33 Hz b) ISRS
0.00 0.20 0.40
4 9 14 19 24 29 34
R
at
io
of
S
SS
I
ov
e
r
SS
I
Frequency (Hz)
1'
10'
50'
100'
1000'
c) Ratio of SSSI to SSI, Range 4-33 Hz (DB located at various distances from the RCT Complex)
variable set of conditions. Figure 11 shows the results that were extracted from the analysis. The bottom of the diesel building foundation was chosen as the location of interest. The response was compared from these varying cases with the SSI analysis case for the diesel building and it can be seen in Figure 11a that after around 100ft the difference in response drops off steeply. Then a frequency range of interest is introduced based on the typical equipment in NPPs and chosen to be 4 to 33hz, to cover both electrical and mechanical equipment. It can be seen in Figure 11c that only when the building about 50ft away from the RCT complex, there is a substantial influence.
Free Field Motion as a Function of Distance from RCT Complex
The free field part of this paper was done more as a curiosity exercise to see when does the free field converge to the input response spectra. For this exercise, free field nodes are placed on grade at a varying distance from a point near the RCT complex till 9000ft away from the RCT complex. As seen in the Figure 12a, there is a significant decrease at around 350ft and the free field motion starts converging towards the input motion. If a concept like the frequency range is applied to this problem, then it be concluded that free field motion would be significantly affected within a 100ft distance from the RCT complex. This helps towards deciding correlation of two similar SSCs, that there is a case to be made for them not to be totally correlated as it can be seen that there would at least be difference in the demand side which would need to be considered when they are near heavy footed building/complex like the one considered in this study.
0 0.05 0.1 0.15 0.2 0.25 0.3 0.35 0.4 0.45 0.5
0 1000 2000 3000 4000 5000 6000 7000 8000 9000 10000
P e rc e n ta ge D if fe re n ce b e tw e e n Fre e Fie ld M o tio n o ve r In p u t M o tio n b e tw e e n 4 -3 3 H z
Distance from the RCT Complex
0.00 0.05 0.10 0.15 0.20 0.25 0.30 0.35 0.40
0.10 1.00 10.00 100.00
Sp e ct ra l A cc e le ra tion Frequency (Hz)
1ft 10ft 50ft 100ft 200ft 300ft 400ft
500ft 600ft 700ft 800ft 900ft 1000ft 2000ft
3000ft 4000ft 5000ft 6000ft 7000ft 8000ft 9000ft
a) % Difference in Response Spectra between Free Field Nodes located at various distances from the RCT Complex and the Input Motion, Range 4-33 Hz b) Response Spectra
0.0 0.1 0.2 0.3 0.4 0.5
4 7 10 13 16 19 22 25 28 31 34
P er cen ta ge Di ff er en ce b et w een F ree Fi el d
Mo
tio
n
o
ver
In
p
u
t
M o tion b etw een 4 -33Hz
Frequency (Hz)
0ft 10ft 50ft 100ft 200ft 300ft 400ft
500ft 600ft 700ft 800ft 900ft 1000ft 2000ft
3000ft 4000ft 5000ft 6000ft 7000ft 8000ft 9001ft
c) Ratio of Response Spectra between Free Field Nodes and the Input Motion
CONCLUSION
A typical BWR type site was used to study the impact of heavy structures, heavy and light structures located at a distance from 1ft to 1000ft. Also, free field motion was monitored at distances up to 9000ft to verify the distance at which it would converge to the input motion. The study was performed for both surface and embedded structures with soft soil profiles. The SSSI responses in terms of in-structure response spectra were compared to corresponding responses from SSI analysis of the stand-alone structure. It is concluded that the comparatively heavy buildings have strong influence on the dynamic response analysis based on the stiffness of the underlying soil material. There is a significant change in response at the soil column frequency which clearly shows that the effect of the SSSI on the lighter surface founded building can be substantial from an embedded heavy building/complex. Based on the frequency range of interest for typical equipment in NPPs (4 to 33hz), it can be concluded that when a lighter building is about 50ft away from the RCT complex, there would be substantial influence. Finally, the paper evaluates when would it be imperative for the SPRA analyst to use a correlated input motion for structures located at the same elevation and when would it be important to look at a site-wide SSI analysis.
REFERENCES
NRC (2012) Letter to All Power Reactor Licensees et al., “Request for Information Pursuant to Title 10 of the Code of Federal Regulations 50.54(f) Regarding Recommendations 2.1, 2.3 and 9.3 of the
Near-Term Task Force Review of Insights from the Fukushima Dai-Ichi Accident,” U.S. Nuclear
Regulatory Commission, March 12, 2012.
EPRI SPID (2013), EPRI 1025287, “Seismic Evaluation Guidance: Screening, Prioritization and Implementation Details (SPID) for the Resolution of Fukushima Near-Term Task Force
Recommendation 2.1: Seismic”. Electric Power Research Institute, Palo Alto, CA.
ASME PRA Standard (2013), ASME/ANS RA-S-2008, “Standard for Level 1/Large Early Release Frequency Probabilistic Risk Assessment for Nuclear Power Plant Applications, including Addenda
B”, American Society of Mechanical Engineers, New York.
SC-SASSI (2016), “A System for Analysis of Soil-Structure Interaction”, SC Solutions Inc., Version
2.1.12.
SAP2000 (2015), “Structural Analysis Program”, Computers and Structures, Inc., Version 17.3.0.
SASSI2010 (2012) User’s Manual, “A System for Analysis of Soil-Structure Interaction”, Ostadan, Farhang and Deng, Nan, Version 1.0.
Roy, Christine, Roffel, Aaron J., Bolourchi, Said, Todorovski, Luben and Khoncarly, Mahmud (2013),
“Study of Seismic Structure-Soil-Structure Interaction between Two Heavy Structures”, SMiRT-22