EDAUT:Educational Data Analytics Using
Tweets
Sneha Xavier1, Jose Hormese2
M. Tech Student, Dept. of C.S.E Marian Engineering College, Trivandrum, Kerala, India
Associate Professor, Dept. of C.S.E, Marian Engineering College, Trivandrum, Kerala, India
ABSTRACT: Social media tools are rapidly changing the communication landscape. Over the past decade humans have experienced exponential growth in the use of online resources, in particular social media and microblogging websites such as Twitter, Facebook etc. Many companies and organisations have identified these resources as a rich mine of knowledge. This project focuses on implementing machine learning algorithms to extract student’s opinion related to their educational system from Twitter tweets. A major focus of this study was on comparing different machine learning algorithms for the task of tweet classification. We used Naive Bayes, Support Vector Machine and Random Forest algorithms for classification. The major findings were that out of the classification algorithms evaluated it was found that the Random forest classifier provide the highest classification accuracy for this domain. From the evaluation of this study it can be concluded that the proposed machine learning and natural language processing techniques are an effective and practical methods for tweet categorisation.
KEYWORDS: Social networking, web text analysis, machine learning, Educational data analytics.
I. INTRODUCTION
Twitter has been used as a medium for real-time information dissemination. Since its launch in 2006, the popularity of its use has been dramatically increasing.Social media has become one of the comfortable medium for people to share their feelings instinctively. According to the survey sharing of the data is high in the social sites like twitter and Facebook [1].
Students share their feelings spontaneously in a relaxed, informal environment like social media more than the formal classroom environment. An educational researcher can use this huge amount of implicit knowledge to understand students experience from outside the controlled classroom environment.This understanding can inform institutional decision-making on enhancement of education quality. These social network data mining provide an opportunity to make changes in education system ultimately to make an impact on economic growth as students play a vital role in the future workforce.
Evaluating such data in social network is quite a challenging process. It is therefore important to classify these topics
into general categories for easier understanding of topics and better information retrieval.To classify tweets into these
predefined classes, we use well known supervised learning technique called Naive Bayes, Support Vector Machine and Random Forest algorithms.
II.RELATED WORK
Due to the widespread presence of internet and growth of social media websites such as Facebook and Twitter, online social network analysis has become a hot research topic. A number of recent papers have addressed the
classification of tweets .According to Goffman’s Theory [2] people will be themselves at heart and say whatever they
classification on positive, negative, or neutral emotions/opinions [6]. both Davidov et al. [7] and Bhayaniet al. [8] use emoticons as indicators to provide noisy labels to the tweets thus minimizing human effort needed for labelling. However, in the case of this paper, only knowing the sentiment of student-posted tweets does not provide much actionable knowledge on relevant interventions and services for students. An extensive study of popular way to implement multi-label classifier is to transform the multi-label classification problem into multiple single-label classification problems. In our study, we implemented a multi-label classification model where we allowed one tweet to fall into multiple categories at the same time. Our classification was also at a finer granularity compared with other generic classifications. Our work extends the scope of data-driven approaches in education such as learning analytics and educational data mining.
III.PROPOSED SYSTEM
Just by knowing the sentiment of student-posted tweets does not provide much actionable knowledge for students. Our purpose is to achieve deeper and finer understanding of students’ experiences especially their learning-related issues and problems. It is more difficult to determine what student problems a tweet indicate than to determine the sentiment of that tweet. Therefore, our study requires a qualitative analysis, and is impossible to do in a fully unsupervised way. Sentiment analysis is, therefore, not applicable to our study. A major focus of this study was to compare the performance of different machine learning algorithms for the task of tweet classification. In our study, we implemented a multi-label classification model where we allowed one tweet to fall into multiple categories at the same time.Popular classification algorithms like Naive Bayes, Random Forest and Support Vector Machine (SVM) was used on the same dataset to classify the tweets into different categories.
A. Data Methods
As the twitter content is very concise and provides free APIs (Application program interface) it is easy to mine using twitter4j [9] and analyze the data. At first the data is collected using twitter API, later Inductive content analysis is performed on it. In model training and evaluation phase several multi level classifier is implemented upon some prominent theme categories and the performance of each classifiers are evaluated. Results will help the policy makers to understand the learning problems of students and to take proper decisions to overcome them.
1. Data Collection
2. Data Pre-processing
Preprocessing of the text should be done before using classifier. Different cases followed to filter the data are described below
All the hashtags will be removed that is # sign.
Negative words with negative emotions will be identified .The words ending with “n’t ,none, cannot, hate, sad, bad” will be replaced with “negtoken”, because negative emotions are useful for the analysis purpose later on.
Punctuations and symbols or special characters have to be removed. RT which is used to retweet and all the hyperlinks will be removed. Compress the duplicate letters if they appear more than twice.
3. Content Analysis
Rost et al. [11] argue that in large-scale social media data analysis, faulty assumptions are likely to arise if
automatic algorithms are used without taking a qualitative look at the data. We first needed to explore what students were saying in the tweets. Thus, we first conducted an inductive content analysis on the data set. Inductive content analysis is one popular qualitative research method for manually analyzing text content. A random sample of 500 tweets was selected and we manually examined the major problems discussed among the students. Various types of emotions related to learning experiences were:
Heavy Study Load: Students who face problems which are dominated by labs, exams, homework and
classes will be grouped on to heavy study load category.
Lack of Social Engagement: Students feel that they give up their freedom and joy time for the sake of
the academic works.
Negative Emotion: Expressing the anger, sickness, depression and disappointment will come under
negative emotions.
Sleep Problems: Students frequently suffer from lack of sleep and nightmares due to heavy study load
and stress.
Diversity Issues: Anti social image of mingling with others is termed as the diversity issue. Without
knowing the background all the negative comments will passed on which may cause the diversity
issue.
Others-The Long Tail: Other tweets in this category do reflect various large numbers of less common
problems or noisy tweets appearing in very low frequency.
B. Description of algorithm used
After preprocessing words and adding all words to the feature set, our feature space is in the thousands. With methods such as SVM or random forests, we need to trim down our feature set to get reasonable running times.The following feature selection approaches are commonly used for the NB classifier: Frequency (word), LogProbRatio (word), ExpProbRatio (word), OddsRatio (word) and weightedOddsRatio (word) [7].
1. Naïve Bayes(NB) Multi Label Classifier
The first learning algorithm that we tried was Naïve Bayes. Despite Naive Bayes' assumption of feature in-dependence (an assumption which doesn't hold for natural language) it appears to perform reasonably well on our datasets. The algorithm works by learning the conditional probability for each particular feature, conditioned on the label of the training example being processed. It then makes a prediction for an unlabeled point by calculating the posterior probability for each class and predicting the maximizing assignment.
argmax p(C = c)=∏ p(F = fi|C = c)
c
and pulled out the most informative ones for each class as shown in table. One final note is that Naive Bayes is also a very fast classifier, it handles a large feature space without a huge time cost.
2. Support Vector Machines(SVM)
SVMs are widely known as an excellent learning model. In order to work with multi-class classifications, we looked at two SVM models: one-vs.-one and one-vs.-rest. The one-vs.-rest method appears to have slightly higher accuracy over the attitudes dataset, so we proceed with that. We trained over the same features as in previous models , and to preprocess the data, we used feature selection to remove linearly dependant features, and also ran stepwise discriminant analysis (SDA). SDA functions by selecting the feature that is most correlated with perditions, removing its variance from the other features and then repeating the step to add more features.
Kernel: We experimented with two kernels: radial basis function and dot product. Again, the results are close, but the RBF kernel with grid search appears to outperform the dot product kernel. Using the feature selection techniques outlined earlier and these optimal SVM settings, we were able to achieve a very high accuracy over the topical dataset. Using feature selection, RBF kernel, and a one-vs.-rest SVM classifier, we achieved higher accuracy compared to Naive Bayes
3. Random Forest
Random forest is an ensemble classifier that consists of many decision trees and outputs the class which is the mode of the class's output by individual trees [10]. Decision trees are individual learners that are combined. They are one of the most popular learning methods commonly used for data exploration. One type of decision tree is called CART, it stands for classification and regression tree. CART is a greedy, top-down, recursive partitioning that divides feature space into sets of disjoint rectangular regions. Random forest is one of the most accurate learning algorithms available, it runs efficiently on large databases and it can handle thousands of input variables. Each tree is constructed using the following algorithm:
Let the number of training cases be N, and the number of variables in the classifier be M.
The number m of input variables to be used to determine the decision at a node of the tree, should be known in advance and m should be much less than M.
Choose a training set for this tree by choosing n times with replacement from all N available training cases.(i.e. take a bootstrap sample). Use the rest of the cases to estimate the error of the tree, by predicting their classes
For each node of the tree, randomly choose m variables on which to base the decision at that node. Calculate the best split based on these m variables in the training set.
Each tree is fully grown and not pruned (as may be done in constructing a normal tree classifier). For prediction a new sample is pushed down the tree. It is assigned the label of the training sample in the terminal node it ends up in. This procedure is iterated over all trees in the ensemble, and the average vote of all trees is reported as random forest prediction.
IV.EVALUATION RESULTS
Commonly used measures to evaluate the performance of classification models include accuracy, precision, recall, and the harmonic average between precision and recall—the F1 score. In each of the one-versus-all binary
classification step, we can create the matrix in Table 1 for the corresponding category c.
Then for this one category c,
Accuracy a =
Precision p =
F1 =
We could achieve higher precision for each categories using the Random Forest Classifier Fig .1.Where as the SVM multi-label classifier failed to classify tweets into respective categories and ended up classifying more tweets into
‘other’ category Fig .2. Fig .3 shows the total number of tweets that falls in each category as classified by the Random
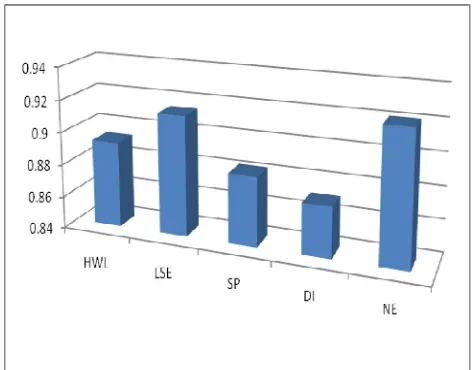
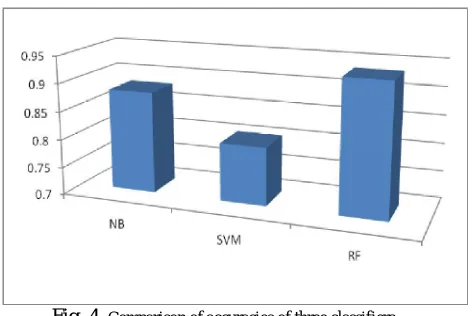
Forest Algorithm. One tweet may fall under several different categories. Results in Fig .4 shows that Random forest has outperformed SVM and Naive Bayes.The Random Forest classifier has not only achieved significant improvement from the random guessing baseline, but also exceeded the performance of state-of-the-art multi-label classifiers on our data set as shown below.
Fig. 1. Precision of each categories (NE-Negative Emotions DI-Diversity Issues, SP-Sleep Problems, LSE-Lack of social engagement, HWL- Heavy Work Load) using Random Forest
Fig. 2. F1 score for each category using SVM
Fig. 3. Number of tweets for each issue detected from out test dataset by Random Forest Classifier
Fig. 4. Comparison of accuracies of three classifiers
V.CONCLUSION AND FUTURE WORK
Overall, Random Forest outperformed Naive Bayes and SVM. Naïve Bayes methods were able to come close to Random Forest accuracy. Further, our feature selection methods were able to cut down dramatically on time without significant accuracy penalties. Random Forest Classifier performed well, and seemed accurate enough to explore previously unseen tweets about a real-world event. Our study is beneficial to researchers in learning analytics, educational data mining, and learning technologies. Our study can inform educational administrators, practitioners and other relevant decision makers to gain further understanding of engineering students’ college experiences. Advanced natural language processing techniques can be applied in the future to provide topic recommendations and further augment the human analysis results, but cannot completely rule out the human effort. Other possible future work could analyze students’ generated content other than texts (e.g., images and videos), on social media sites other than Twitter (e.g., Facebook, Tumbler, and YouTube). Future work can also extend to students in other majors and other institutions
REFERENCES
1. http://www.socialmediaexaminer.com/5-new-studies-show-facebook-a-marketingpowerhouse
2. http://www.monoskop.org/images/1/19/Goffman_Erving_The_Presentation_of_Self_in_ Everyday_Life.pdf.
3. K. Nishida, R. Banno, K. Fujimura, and T. Hoshide, “Tweet Classification by Data Compression,” Proc. Int’l Workshop DETecting and Exploiting Cultural DiversiTy on the Social Web, pp. 29-34, 2011.
5. B. Pang, L. Lee, and S. Vaithyanathan, “Thumbs Up?: Sentiment Classification Using Machine Learning Techniques,” Proc. ACL-02 Conf. Empirical Methods in Natural Language Processing, vol. 10, pp. 79-86, 2002.
6. N. Cristianini and J. Shawe-Taylor, An Introduction to Support Vector Machines and Other Kernel-Based Learning Methods. Cambridge Univ. Press, 2000.
7. D. Davidov, O. Tsur, and A. Rappoport, “Enhanced Sentiment Learning Using Twitter Hashtags and Smileys,” Proc. 23rd Int’l Conf. Computational Linguistics: Posters, pp. 241-249, 2010.
8. Go, R. Bhayani, and L. Huang, “Twitter Sentiment Classification Using Distant Supervision,” CS224N Project Report, Stanford pp. 1-12, 2009.
9. “Using the Twitter Search API | Twitter Developers,https://dev.twitter.com/docs/using-search, 2013. 10. L. Breiman. Random forests. Machine Learning, 45(1),2001.
11. M. Rost, L. Barkhuus, H. Cramer, and B. Brown, “Representation and Communication: Challenges in Interpreting Large Social Media Datasets,” Proc. Conf. Computer Supported Cooperative Work, pp. 357-362, 2013.
BIOGRAPHY