The purpose of this study was to develop, validate, and establish reliability of an instrument that measures preservice teachers’ self-efficacy of teaching engineering design.
by
Erik Michael Ward
A thesis submitted to the Graduate Faculty of North Carolina State University
in partial fulfillment of the requirements for the degree of
Master of Science
Technology Education
Raleigh, North Carolina 2013
APPROVED BY:
_____________________________ ______________________________
Aaron C. Clark Theodore J. Branoff
________________________________ Matthew D. Lammi
BIOGRAPHY
Erik Michael Ward was born in Canton, Ohio on February 4, 1986. He graduated from Revere High School in 2004 and completed a Bachelor of Science in Technology Education from Ohio State University in 2010.
ACKNOWLEDGMENTS
Many people have contributed to my success through graduate school. I would like to give special thanks to the following people:
My mothers, Irene Ward and Kathy Piazza, and the rest of my family. I am
thankful for their support and encouragement during my graduate work. Their support has helped me get to where I am today.
All of the faculty in the Technology Education department, especially my
TABLE OF CONTENTS
LIST OF TABLES ... vi
LIST OF FIGURES ... vii
CHAPTER 1: INTRODUCTION ... 1
Introduction ... 1
Rationale ... 4
Methodology ... 4
Research Questions ... 7
Limitations ... 7
Definitions ... 8
CHAPTER 2: REVIEW OF LITERATURE ... 12
Theoretical Underpinnings ... 12
Self-efficacy. ... 12
Teaching efficacy. ... 14
STEM Education. ... 15
Technology, Engineering, and Design Education. ... 16
Engineering Design. ... 18
Prior Instrument Development ... 23
Item Generation. ... 25
Instrument testing and analysis. ... 29
Instrument refinement.... 30
Construct, Context, and Content Validity ... 31
Reliability ... 34
Other Information ... 34
CHAPTER 3: METHODOLOGY ... 38
Purpose of the Study ... 38
Research Questions ... 38
Target Population ... 38
Procedure ... 39
Phase One - Item Generation. ... 42
Phase Two - Item Refinement with SMEs. ... 48
Phase Three - First Testing. ... 51
Phase Four - Data Based Refinement... 53
Summary ... 55
Development of an Instrument to Measure Teachers’ Self-efficacy of Teaching Engineering Design ... 64
Abstract ... 65
An Exploratory Look at the Factors Contributing to the Self-efficacy of Teaching Engineering Design ... 98
Abstract ... 99
APPENDICES ... 121
Appendix A: Engineering Design Components and their characteristics ... 122
Appendix B: First Generation Items ... 126
Appendix C: Subject Matter Expert Comments: First Generation Items ... 128
Appendix D: Second Generation Items ... 131
Appendix E: Third Generation Items ... 133
Appendix F: Informed Consent ... 135
Appendix G: Recruitment Introduction ... 138
LIST OF TABLES
Table 2.1 Characteristics of Constraints Component for SETED ... 21
Table 3.1 Characteristics of Constraints Component for SETED ... 44
Table 3.2 Summary of components and characteristics of engineering design used in the SETED ... 46
Table 3.3 Example First Generation Items ... 46
Table 3.4 Comparison of Bandura (2006) Scale Descriptors and SETED Descriptors... 48
Table 3.5 Example SME Comments ... 49
Table 3.6 Example Second Generation Items ... 50
LIST OF FIGURES
Figure 1.1 Methodological Process of Item Creation and Reduction ... 5
Figure 2.1 Methodological Process of Item Creation and Reduction ... 24
Figure 3.1 Steps for Development of the Preliminary SETED ... 40
Figure 3.2 General Methodological Process for Instrument Development ... 41
CHAPTER 1: INTRODUCTION Introduction
The purpose of this study was to create and begin establishing the validity and reliability of an instrument measuring preservice Science, Technology, Engineering, and Mathematics (STEM) teachers’ self-efficacy in teaching engineering design. Engineering design was a key concept in the technology and engineering classrooms. With the push for more integration across STEM disciplines, interest had risen in teaching engineering design outside of technology and engineering classrooms. Engineering design provided a vehicle for integrating technology and engineering concepts into other classrooms. Technology here was not limited to computers and electronics. It held the broader meaning of any way in which humans modified their natural world to satisfy their needs and wants (NAEP, 2014). Science classrooms were already starting to incorporate technology into their classrooms and
discussing it in relation to the natural world (Eisenkraft, 2011; Silk &Schunn 2009).
Engineering design was one topic of discussion that could be used to relate technology to the natural world. From an educator standpoint, it could be compared to science’s process of science as inquiry. Determining the self-efficacy of teachers in teaching engineering design was part of the effort to identify if effective education is taking place (Cantrell, 2003).
STEM classrooms had overlapping material and unifying concepts; engineering design was one of the unifying concepts. Engineering design was a process that focused on helping students understand technology and how it was designed (ITEEA, 2007).
Engineering design was a complex, boundless entity with common concepts and practices. Research focused on identifying the concepts behind the varying engineering processes and working with these identified components. Engineering design was a process that helps students: solve complex problems, work within constraints, work through decision-making processes, and convey their ideas. Because of skills taught through engineering design, such as problem solving ability, engineering design was valuable to every K-12 student to learn.
Engineering design was one of the standards (ITEEA, 2007) presented to help
students better learn about technology. The determination for teachers to continue onward in the face of adversity could be grounded in Bandura’s social cognitive theory (1977). In his theory Bandura (1977) presented the idea of self-efficacy, the belief in a person's ability he or she will be successful at a given task. Self-efficacy also influenced how long a person will continue with a task when they encountered an obstacle and how much effort they would put forth. If teaching engineering design presented a difficult challenge, the self-efficacy of teachers presenting it determined the chances he or she would continue with fully presenting the material. A teacher’s self-efficacy in teaching a specific subject was one of many
measures in determining a teacher’s effectiveness in the classroom. This was due to the
relationship of self-efficacy and teacher efficacy, which combined self-efficacy, locus of control, and outcome expectancies in the classroom (Cantrell, 2003; Çakiroglu, Çakiroglu, & Boone, 2005; Erdem, & Demirel, 2007; Tschannen-Moran, & Hoy, 2001).
teacher’s self-efficacy would vary based on individual tasks. Teaching self-efficacy has been
shown to affect the success of teachers in the classroom (Cantrell, 2003; Erdem, & Demirel, 2007; Tschannen-Moran, & Hoy 2001). The teacher’s self-efficacy on a given subject then contributed to each instructor’s success in the classroom. Identification of teacher self-efficacy in regards to engineering design then became an important factor to improving the level of effective education in the classroom.
Justification
Given the presence of engineering design across multiple classrooms (NRC, 2013; BOSE, 2011; ITEEA, 2007), the researchers were interested in finding out the self-efficacy of teachers in teaching engineering design. Self-efficacy was selected because it:
"[Influences] whether people think erratically or strategically, optimistically or pessimistically. They [efficacy beliefs] also influence the courses of action people choose to pursue, the challenges and goals they set for themselves and their
commitment to them, how much effort they put forth in given endeavors, the
outcomes they expect their efforts to produce, how long they preserver in the face of obstacles, [and] their resilience to adversity” (Bandura, 2006, p. 309).
A teacher's self-efficacy has also shown a correlation to student achievement
engineering design (Carberry, Lee, & Ohland, 2010). Only one of the instruments mentioned teaching engineering design (Yoon et al, 2012); however, this was part of a larger measure of teaching engineering. This meant that in order to answer the question of what is the self-efficacy of teachers in teaching engineering design; an instrument must first be developed. This research pursued the objective of developing such an instrument.
Rationale
The concept behind this study was that engineering design was a valuable topic of instruction from an integration and student benefit point of view. Engineering design had been determined to be of value, evidenced by its placement in national and international education standards for technology and engineering classrooms (ITEEA, 2007). The Board of Science Educators, BOSE, had also included technology, as it related to science and design, into the national standards for science education (2001) and their 2011 Framework
for K-12 Science Education. Engineering design was also included in the National Research
Council’s (NRC) Next Generation Science Standards (NGSS), finalized in 2013. The self-efficacy of teachers teaching engineering design in the classroom told us how our teachers felt about presenting this topic to their students.
Methodology
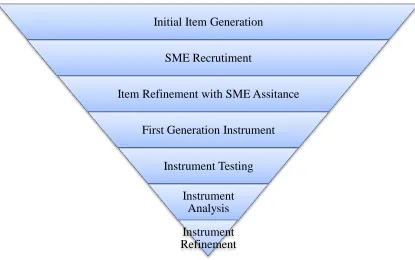
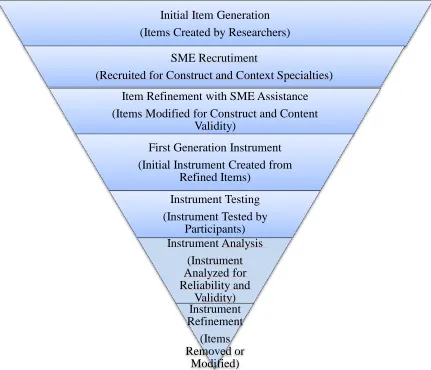
literature pointed out a methodology represented by Figure 1.1, where items were slowly refined and reduced as the process commenced. Subject matter experts (SMEs) were selected based upon their knowledge of the construct and context (Carberry, et al., 2010; Smolleck, et al., 2006). For the purpose of this study the construct and context areas were self-efficacy (Bandura, 1977), engineering design (Lammi, 2011), and teacher education. Once the instrument was created, it was tested on students in North Carolina State University’s Technology, Engineering, & Design Education program.
Figure 1.1 Methodological Process of Item Creation and Reduction
The focus of this study was to complete the initial steps, or phases, of instrument development for an instrument measuring the self-efficacy of teaching engineering design
Initial Item Generation
SME Recrutiment
Item Refinement with SME Assitance
First Generation Instrument
Instrument Testing
(Baker, Krause, & Purzer, 2008; Carberry, et al., 2010; Dellinger, et al., 2008; Ritter, et al., 2001; Smolleck, et al., 2006; Yoon, et al., 2012). While most research finished validation and reliability testing, producing a completed instrument, this research stopped during instrument analysis (Carberry, et al., 2010). For preliminary instrument development, this focus was narrowed to preservice teachers at North Carolina State University. These selections were made based on the intended use of the instrument (Carberry, et al., 2010; Ritter, et al., 2001; Smolleck, et al., 2006) as well as funding restrictions. The scope and results of this study allowed for scale up and further funding (Carberry, et al., 2010).
The study had four SMEs. Each SME had a primary focus in teacher education, engineering design, or self-efficacy (Baker, et al. 2008; Smolleck, et al., 2006). A SME could have had knowledge in another area; however, they were selected for a primary area. SMEs with multiple areas covered were given precedence over those without. Two SMEs had expertise in engineering design, one from practicing engineers, and one from education.
These responses were complied and analyzed. Several form of analyses were
performed including factor analysis, descriptive statistics, and reliability testing (Baker, et al., 2008; Carberry, et al., 2010; Dellinger, et al., 2008; Ritter, et al., 2001; Smolleck, et al., 2006; Yoon, et al., 2012). Factor analysis was preformed for item reduction (Smolleck, et al., 2006; Carberry, et al., 2010) and principle factor identification (Carberry, et al., 2010). Reliability testing used Cronbach's α (Carberry, et al., 2010; Smolleck, et al., 2006; Yoon, et
al., 2008; Carberry, et al., 2010; Dellinger, et al., 2008; Ritter, et al., 2001; Smolleck, et al., 2006; Yoon, et al., 2012) as well as the average self-efficacy for all items.
Research Questions
This study was designed to develop and validate a reliable instrument to measure self-efficacy of teaching engineering design. The research questions of this study were:
1. Does the preliminary instrument align with the construct of self-efficacy? 2. Does the preliminary instrument represent engineering design?
3. Does the preliminary instrument measure the self-efficacy of teaching engineering design in preservice technology, engineering, and design education teachers? 4. Does the preliminary instrument demonstrate reliability?
Assumptions
The following were assumptions for this study:
1. All respondents completed the instrument truthfully and to the best of their ability. 2. All subject matter experts provided honest feedback to the best of their ability. 3. Bandura’s social cognitive theory (1977) can explain the results.
Limitations
The following limitations were recognized for this study:
1. All students in the research study are from North Carolina State University. The result may then be specific to this group of participants.
3. This research had a small sample size.
4. This research was only performed during one semester. The results may be specific to this one group of students.
5. This was a preliminary study addressing only the first stages of instrument development.
6. Engineering Design was defined by Subject Matter Experts at NC State.
Definitions
Bandura’s Social Cognitive Theory - a behaviorist learning theory that states learning is affected by performance accomplishments, vicarious experience, verbal persuasion,
physiological states, and self-efficacy. (Bandura 1977; Bandura 1982)
Complexness - as related to engineering design, relates to multiple potential solutions and multiple paths to solutions (Brophy,Klein, Porstmore, & Rogers, 2008).
Constraints - represent limitations placed on students by the engineering design challenge. These constraints could be reality based limitations, such first principles (Apedoe, Reynolds, Ellefson, & Schunn, 2008; Eisenkraft, 2011; Kolodner, 2002), or those reflective of real constraints, but imposed by the instructor, such as a project budget (Asunda & Hill, 2007; Brophey, et al., 2008).
Content Definition - Content definition provides a clear and explicit outline of the content being tested. This definition should break down the content into the individual components the work together to form the overall content. Each component should clear state how it relates to the content as a whole (Ritter, et al., 2001).
Engineering Design - Engineering design “demands critical thinking, the application of technical knowledge, creativity, and an appreciation of the effects of a design on society and the environment” (ITEEA, 2007).
Item Wording - Item wording frames the items in an instrument to identify with one construct, if multiple are present, and one context at a time. In the case of multifaceted content and constructs item wording insures only one portion of each is tested at a time. Item wording includes key words brought from the definitions of content and construct (Dellinger, et al., 2008).
Preservice - Preservice indicates students enrolled in and working through a teacher education program. This does not include teachers already teaching in a classroom while completing a teacher education program (Erdem & Demirel, 2007).
Scale Selection - Scale selection is the identifying the number of response options for a Likert scale. It also requires providing descriptors above certain points. Scale selection includes not only the terms used as descriptors, but also how many descriptors and which points should have them. (Bandura, 2006)
Self-Efficacy - Self-efficacy is a component of Bandura’s social cognitive theory initially put forth in 1977. Bandura (1977) defined self-efficacy as one’s belief in one’s ability to succeed in specific situations. Self-efficacy determines how successful a person believe they will be at a given task, how long they will continue in the face of adversity, and how much effort they are willing to put forth into the task (Bandura, 2006).
STEM Education - STEM education is an educational approach that integrates
Science, Technology, Engineering, and Mathematics classrooms. This approach recognizes that these separate disciplines are interrelated and student learning can be enhanced by relating subject matter across classrooms. (Clark, 2012)
Summary
CHAPTER 2:REVIEW OF LITERATURE
This chapter gives a review of literature relating to the development of an instrument designed to test the self-efficacy of STEM teachers teaching engineering design. This review was broken into two major sections, theoretical underpinnings, and instrument development. These sections were inter-related with instrument development relying on the theoretical underpinnings.
Theoretical Underpinnings
This section looked at defining self-efficacy and engineering design. It began by discussing self-efficacy and teacher efficacy. There was a difference between these concepts and this review was intended to illustrate the overlap and differences in concepts. This was done as a result of these terms being used interchangeably throughout the literature. The population of concern was preservice teachers within STEM education, thus it continued on to review STEM education and engineering design’s role in STEM education. Finally, it
broke engineering design into base components and provides a definition of each of these components, as well as their characteristics.
Self-efficacy.
behavior is performance-based. Self-efficacy determined if a person believes they would be successful at a given task; how long they would continue if they encounter an obstacle; and how much effort a person put into the task. According to Bandura (1977), "expectations of personal efficacy are based on four major sources of information: performance
accomplishments, vicarious experience, verbal persuasion, and physiological states" (p. 195). Performance accomplishments revolved around mastery experiences, positive
experiences increasing efficacy with negative ones decreasing it. According to Bandura (1977), “After strong efficacy expectations are developed through repeated success, the
negative impact of occasional failures is likely to be reduced. Indeed, occasional failures that are later overcome by determined effort can strengthen self-motivated persistence…” (p. 195). This meant the overall pattern and timing of failures has an impact on efficacy.
Vicarious experience changed efficacy based on the performance accomplishments of others. These experiences were weaker than those directly gained by personal mastery
Teaching efficacy.
Teaching efficacy was a belief that judges a teacher’s capability to obtain desired outcomes of engagement and learning from students, even those that are unmotivated or difficult. Teacher efficacy drove a teacher to set higher goals, invest more effort in teaching, and persist in the face of setbacks (Tschannen-Moran, & Hoy 2001). Bandura’s social cognitive theory and his later definition of self-efficacy (1995) caused the identification of teacher efficacy as self-efficacy with the task of teaching. Tschannen-Moran and Hoy (2001) postulated that while self-efficacy and teacher efficacy were similar, they were separate, intertwined concepts. Teachers’ efficacy beliefs affected classroom management, course
structure, and teaching, communicating with students, and influencing student motivation (Erdem & Demirel, 2007).
Higher instructor efficacy resulted in students with higher standardized test scores and a positive attitude towards the content (Cantrell, 2003). Teaching efficacy and self-efficacy were closely related, intertwined concepts (Tschannen-Moran & Hoy, 2001). Teaching efficacy was the instructor’s belief of being able to affect change in students, but was situation specific. Engineering design did not use standardized testing to measure student achievement. Cantrell (2003) demonstrated the link between standardized test scores and teacher efficacy. In these cases, standardized testing was the measure of student achievement, but it showed that teacher efficacy and student achievement were correlated.
was one such method of evaluating the effectiveness of education; higher scoring students had instructors that were more effective. Instructor efficacy contributed to student attitude towards content and student achievement (Cantrell, 2003).
The self-efficacy of a teacher teaching a concept contributed to overall teaching efficacy, but focused on the content presentation portion of teacher efficacy. With
self-efficacy and teacher self-efficacy so closely related a higher self-self-efficacy for the teacher results in a higher teacher efficacy. Determining the self-efficacy of an instructor on teaching content was then important; in this case, the content was engineering design principles and skills.
STEM Education.
Science, Technology, Engineering, and Mathematics education had seen changes to their standards that have resulted in more integration. Each area had a set of standards to drive the educational aim of their respective programs. These standards were created by national or international organizations with the input of experts from the field. These standards then represented what experts in each area feel students today need to know in order to be successful later in life.
The technology education standards were created by the International Technology and Engineering Educators Association, ITEEA. ITEEA published the Standards for Technological Literacy (STL) under the banner of ITEA. ITEEA (2007) defined
technological literacy as “the ability to use, manage, assess, and understand technology” (p.
and objective about technology...” (2007, p. 9). Towards this end, they had created a series of
standards that move students towards these goals.
The Board on Science Education, BOSE, created a set of standards for science educators aimed at making students more scientifically literate. The BOSE (1996) defined scientific literacy as “the knowledge and understanding of scientific concepts and processes
required for personal decision making, participation in civic and cultural affairs, and
economic productivity.” (p. 22) The BOSE (1996) also stated that students should be able to “... express positions that are scientifically and technologically informed.” “In learning
science, students describe objects and events, ask questions, acquire knowledge…, and communicate their ideas to others” (BOSE, 1996).
Technology, Engineering, and Design Education.
Technology, Engineering, and Design (TED) education represented the T and E of STEM education. The American Society for Engineering Education (ASEE) stated part of its purpose is "the advancement of education in all of its functions which pertain to engineering and allied branches of science and technology." ABET's vision stated that they "assure quality and stimulating innovation in applied science, computing, engineering, and
(2012b) listed general student outcomes for engineering technology education that include: "the impact of engineering technology solutions in a societal and global context" (p. 3); "ability to select and apply a knowledge of mathematics, science, engineering, and
technology to engineering technology problems" (p. 3); and "an ability to apply written, oral, and graphical communication in both technical and non-technical environments” (p. 3.) These two prominent organizations in engineering education provided enough information to generate a simplified definition of the field of technology and engineering education as teaching students to apply math, science, engineering, and technology to solve problems within realistic constraints.
While ABET focused on post-secondary accreditation, this definition informed the coverage of the discipline. Reviewing ABET (2012a; 2012b) guidelines revealed that engineering and technology go much deeper than this simple definition illustrated. ITEEA (2007) also provided the STL, which outlined in detail the topics they felt should be included with technology and engineering education. There were 20 standards in the STL ranging from construction, manufacturing, transportation, to design, and engineering design. ITEEA
mention societal and global effects of technology, indicating that Technology, Engineering, and Design education was a discipline aware of global implications of their field.
In addition to ABET and ITEEA, NRC provided a definition of practices that defined Technology, Engineering, and Design education. The NGSS stated, “the Framework specifies that each performance expectation must combine a relevant practice of science or
engineering with a core disciplinary idea and crosscutting concept” (2013, Appendix G p. 1).
They further identified eight practices that were essential for students to learn: 1. Asking questions (for science) and defining problems (for engineering) 2. Developing and using models
3. Planning and carrying out investigations 4. Analyzing and interpreting data
5. Using mathematics and computational thinking
6. Constructing explanations (for science) and designing solutions (for engineering) 7. Engaging in argument from evidence
8. Obtaining, evaluating, and communicating information
(NRC, 2012, Appendix G p. 1). These practices were “derived…based on an analysis of what professional scientists and engineers do” (NRC, 2012, Appendix G p. 2). These three organizations helped define the domain of TED education. Self-efficacy instruments were used in various parts of TED, being used to assess students (Baker, et al., 2008; Carberry, et al., 2010) and teachers (Yoon, et al., 2012).
Engineering Design.
abilities of technological design, and understanding about science and technology. They specifically called out technological design and technology itself. Technology education was responsible for teaching students about technology and making them technologically literate students. In their more recent standards, BOSE (2011) had specifically included engineering design as a separate topic from the aforementioned parts.
The STL provided a section for the education of students about technology and design. In this section there was a standard listed as Engineering Design. This concept was important enough to ITEEA to call it out separately so that an emphasis was placed upon learning engineering design. ITEEA identified engineering design for K-12 students by “the engineering design process includes identifying a problem, looking for ideas, developing solutions, and sharing solutions with others” (2007, p100). As a student progressed through
their education, this concept became more complex than just one simple sentence could convey.
ITEEA was a leading source for the standards and practices of technology and
examples of how design problems were solved. An understanding of the engineering design problem then informed what practitioners and researchers feel the parts of engineering design were, and which were most vital for students to learn (Lammi, 2011).
Engineering design problems had multiple facets, not all of which related to engineering design itself. Components of the problem such as pedagogical methods and relevance did not factor into how the problem expresses engineering design. These items could factor into the success of the problem, but this success was not relevant to the idea of engineering design itself. A focus on the portions of the problem that elicited the process of engineering design identified what practitioners and researchers felt were the components of engineering design. Engineering design could be identified to have four major components: complexness, processes, relevance, and constraints (Lammi, 2011). Each of these
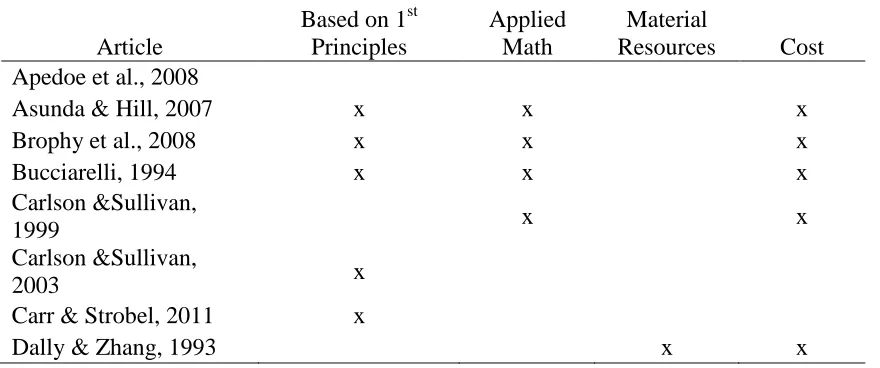
Table 2.1 Characteristics of Constraints Component for SETED
Article
Based on 1st Principles
Applied Math
Material
Resources Cost Apedoe et al., 2008
Asunda & Hill, 2007 x x x
Brophy et al., 2008 x x x
Bucciarelli, 1994 x x x
Carlson &Sullivan,
1999 x x
Carlson &Sullivan,
2003 x
Carr & Strobel, 2011 x
Dally & Zhang, 1993 x x
Complexity.
Complexity here represented the complexity of problem, and the possible solutions that resulted from this complexity. This complexity could be further broken down into the characteristics of open-ended, multiple solution paths, no known solution, systems
perspective, and multidisciplinary. Engineering design itself was open-ended as there was no one way to approach to process. Open-ended was possibly another heading for the
Klein, Portsmore, & Rogers, 2008). The next component of engineering design problems was found to be relevance.
Relevance.
Relevance was a function of the engineering design problem, while not specifically part of engineering design practice; it was required to teach students engineering design. Educators should help make engineering design activities relevant to learners (Brophy, Klein, Portsmore, & Rogers, 2008) thereby increasing the buy-in from students (Sadler, Coyle, & Schwartz, 2000). There were many forms of relevance ranging from relevance to student's everyday lives (Apedoe et al., 2008; Brophy et al., 2008; Carlson, 2003; Carr & Strobel, 2011; Dally, 1993; Kolonder, 2002; Sadler et al., 2000; Schunn, 2011) to relevance to real world problems (Brophy et al., 2008, Bucciarelli, 1994, Dym et al., 2005, Mehalik, & Schunn, 2006). This range meant that when teaching engineering design an instructor may have had different types of relevance with every problem. It might also have been possible for an instructor to include multiple forms of relevance in every engineering design problem.
Processes.
Process here does not refer to a set of discrete steps students follow to complete an engineering design problem, but instead methods utilized to create artifacts of learning. Many processes result in the communication of an idea, an integral component of engineering design (ITEEA, 2007). Graphical visualizations encompass any way in which learners
not limited to just things that create artifacts, including decision-making as well. Most decision-making may not be readily apparent, but can be viewed through the changes in iterative artifacts.
Constraints.
Engineering design is never performed in a vacuum. While relevance dictates the inclusion of restrictions on students' work, constraints play a practical part in engineering design outside of just relevance. Learning to work within constraints is essential for students as resources are limited and every project has a budget (Asunda & Hill, 2007; Brophy, et al., 2008; Carlson & Sullivan, 1999). Other constraints, such gravity, cannot be broken and learners should expect to work within these constraints. It is within constraints that
engineering design readily offers a mode to teach core concepts from other STEM disciplines (Apedoe, Reynolds, Ellefson, & Schunn, 2008; Eisenkraft, 2011; Kolonder, 2002).
Prior Instrument Development
Figure 2.1 illustrates the overall process of creating and refining items. The pyramid structure is from the perspective of items present within an instrument. Items are constantly refined and reduced as the instrument development process progressed. Once an instrument makes it to the factor analysis stage, item reduction is only done if factor analysis or internal reliability testing indicated there is an issue (Dellinger, et al., 2008; Smolleck, et al., 2006). If item reduction occurred, then the process restarts at instrument testing, with the generation of instrument updating to the newest version (Smolleck, et al., 2006).
Figure 2.1 Methodological Process of Item Creation and Reduction Initial Item Generation
SME Recrutiment
Item Refinement with SME Assitance
First Generation Instrument
Instrument Testing
Item Generation.
Item generation is the first stage of instrument development and breaks into several components: construct definition, content definition, item wording, and scale selection (Bandura, 2006). Before items can be created, a construct is identified as it contributes to the manner in which individual items are worded (Bandura, 2006). Content definition is coupled with construct definition in order to finalize item wording (Bandura, 2006; Dellinger, et al., 2008; Smolleck, et al., 2006).
Construct definition.
Content definition.
Content definition is required before item generation as it combined with construct definition to inform item generation. Content definition involved researching the content in question (Baker, et al., 2008; Carberry, et al., 2010; Dellinger, et al., 2008; Ritter, et al, 2001; Smolleck, et al., 2006; Yoon, et al., 2012). This process identifies the domain of which self-efficacy is being measured. In the case of Bandura (2006), several examples are given of general teaching self-efficacy. There are two different processes for defining content, though both involve SMEs.
The methods are separated by where the initial content generation starts. The first method starts content definition with the SMEs. In this method, researchers create open-ended questions about engineering design and administer the questions to experts (Baker et al., 2008). The experts answer the questions and return the results to the researchers. Baker et al, (2008) code this SME feedback; using this coding to generate items. These items are then sent for SME review and checking. This process repeates cyclically until the researchers are left with a finalized list of components returned from all SMEs with very few or no
comments.
is complete the content definitions are combined with the construct definition to create items (Baker, et al., 2008; Carberry, et al., 2010; Ritter, et al., 2001; Smolleck, et al., 2006; Yoon, et al., 2012).
Item wording.
Item wording is the final portion of item generation and is used to separate each facet of the context and test for only one component based around self-efficacy. Literature shows that some researchers use negatively worded items to increase reliability (Baker, et al. 2008); however, the majority of the literature does not utilize negatively worded items (Carberry, et al., 2010; Dellinger, et al., 2008; Ritter, et al., 2001; Smolleck, et al., 2006; Yoon, et al., 2012). This implies that the use of negatively worded items does not greatly increase reliability. Additionally, the use of negatively worded items did not adversely affect the reliability of instruments (Baker, et al., 2008), so the use of them is left to the researcher. Once the items have been generated through item wording, construct definition, and content definition they are reviewed by SMEs.
Scale selection.
The scale for this instrument is a Likert scale (Baker, et al., 2008; Carberry, et al., 2010; Dellinger, et al., 2008; Ritter, et al., 2001; Smolleck, et al., 2006; Yoon, et al.,. 2012). Research indicates that a process for selecting the number of points on the scale starts with identifying even or odd number of points, selecting the exact number of points, frequency of wording, and then selection of terms (Bandura, 2006; Baker, et al., 2008; Carberry, et al., 2010; Dellinger, et al., 2008; Pajares, 1996; Ritter, et al., 2001; Smolleck, et al., 2006; Yoon, et al., 2012). Research exists for both odd and even number of points; however, majority of the reviewed literature uses an odd number of points (Bandura, 2006; Dellinger, et al., 2008; Carberry, et al., 2010; Baker, et al., 2008; Smolleck, et al. 2006). This indicates for this type of instrument the preference should be to utilize an odd number; however, the number of points is left unclear. However, Bandura (2006, p. 312) indicates that even within an odd number scale the central point is moderate assurance. Typically in odd numbered scales the central point is listed as neutral (Dellinger, et al., 2008; Carberry, et al., 2010; Baker, et. al., 2008; Smolleck, et al., 2006). Bandura (2006) also only adds a descriptor to the most extreme and central values.
influenced by the distribution of responses. Responses should be distributed over majority of the range.
Scale selection also includes descriptive interval wording. Out of the total number of intervals in a scale, how many intervals should have wording and which intervals should receive this wording is determined. Several researchers identify the extreme intervals (Dellinger, et al., 2008; Carberry, et al. 2010; Baker et al. 2008; Smolleck, et al., 2006; Bandura, 2006). Some researchers identify the center interval as well (Bandura, 2006; Carberry, et al., 2010); the other researchers all use or modified the same instrument, developed by Enoch and Riggs (1990).
Instrument testing and analysis.
After the items are developed, placed with a marked scale, and refined, pilot testing of the instrument occurrs. In pilot testing, the instrument is administered to a sample
population (Baker, et al., 2008; Carberry et al., 2010; Dellinger et al., 2008; Smolleck et al., 2006). This sample is selected as representative of the intended population; however, the selection process is often driven by funding. If a study is meant to be wide spread, the ideal testing subjects are spread throughout the intended population. The instrument is
administered to this group and the results are collected (Baker, et al., 2008; Carberry, et al., 2010; Dellinger, et al., 2008; Ritter, et al., 2001; Smolleck, et al., 2006; Yoon, et al.,. 2012).
al., 2001; Smolleck, et al., 2006). If an individual item is found to be crossing constructs, it is removed or reworded. However, this is not the only use of factor analysis; factor analysis is also used to assist with item reduction (Carberry et al., 2010; Smolleck, et al., 2006).
In this second form of factor loading, testing determines if they only tested one factor of a construct. If an item is found to test more than one factor, it is removed or modified (Carberry et al., 2010; Smolleck, et al., 2006). A third use of factor analysis searches for underlying factors within a construct (Carberry et al., 2010). The second and third uses of factor analysis are often related and assist with item reduction (Carberry, et al., 2010;
Smolleck, et al., 2006). In addition to factor analysis internal reliability testing is performed (Baker, et al., 2008; Carberry, et al., 2010; Ritter, et al., 2001; Smolleck, et al., 2006).
Internal reliability has several options such as the Spearman-Brown coefficient or Cronbach’s α. These tests are intended to determine the correlation between all the items and
find if they are all measuring the same phenomenon. Cronbach’s α is used by Carberry et al. (2010); Yoon & Evans (2012); and Smolleck, Zembal-Saul, & Yoder (2006) with Spearman-Brown being used by Baker, Krause, & Purzer (2008). Ritter, Boone, & Rubba (2001) uses a coefficient α, but do not specify which one; Dellinger et al. does not discuss any internal reliability testing during the development process. This presents a strong case for utilizing Cronbach’s α for internal reliability.
Instrument refinement.
(Smolleck, et al., 2006); it is cyclical, using a new sample each time, and continues until the factor loading indicates the items are correctly aligned (Ritter, et al., 2008; Smolleck et al., 2006). The repeated process is sample group testing, factor loading, and then item
refinement. The last iteration of this process does not include item refinement. If items are refined, the process needs repeated until they need no adjusting (Carberry et al., 2010; Smolleck et al., 2006). Some studies only complete initial analysis after one round of testing (Carberry, et al., 2010). Any additional actions are being addressed as recommendations (Carberry, et al., 2010).
Within educational research, there is a large body of research related to teaching self-efficacy (Bandura, 2006; Dellinger et. al., 2008; Smolleck et al. 2006; Yoon, et al., 2012); a subset of this research relates to engineering concepts and processes (Yoon, et al., 2012). These approaches provide a broad foundation of information for analyzing instrument
development methods. The surveyed research suggests that there are at least several stages in the development of a self-efficacy instrument: item generation, construct and content
validity, instrument testing, and instrument refinement (Baker, et al., 2008; Carberry, et al., 2010; Dellinger, et al., 2008; Ritter, et al., 2001; Smolleck, et al., 2006; Yoon, et al., 2012). Construct, Context, and Content Validity
The stem is a base phrasing on which the items expand. In Dellinger, et al. (2008) the belief stem is phrased: "Right now in my present teaching situation, the strength of my personal beliefs in my capabilities to...” (p. 764) which then corresponds to the items. The complete phrase for item 7 of the Dellinger, et al. (2008) instrument reads, "Right now in my present teaching situation, the strength of my personal beliefs in my capabilities to redirect students who are persistently off task is..." (p. 764), and then the respondent selects the appropriate Likert scale value, 1-4, to complete the phrase. Dellinger, et al. (2008) found that “the BELIEF items elicited somewhat different results than the traditional item stems” (p. 756),
and that “the BELIEF item stem (responses) were not as strongly correlated with traditional stem responses” (p. 756). They felt this stem is "more consistent with the language of
self-efficacy theory" (Dellinger, et al., 2008, p. 756). Construct validation is performed to determine if the items previously developed actually check the construct of self-efficacy (Baker, et al., 2008; Carberry, et al., 2010; Smolleck, et al., 2006). A construct is defined as a behavior that is not directly observable (Bandura, 2006). Given that the instrument is
2008; Carberry, et al., 2010; Dellinger, et al., 2008; Ritter, et al., 2001; Smolleck, et al., 2006).
Context validation is utilized to determine that the construct has seamlessly been combined with content (Baker, et al., 2008; Carberry, et al., 2010; Dellinger, et al., 2008; Ritter, et al., 2001; Smolleck, et al., 2006). For self-efficacy instruments, validation uses factor analysis to check to see if the items are correlated not only to context specific factors, but to the correct construct as well (Smolleck, et al., 2006). Research relating to specific forms of self-efficacy such as teaching science as inquiry (Smolleck, et al., 2006),
engineering design (Carberry, et al., 2010), and the broader concept of teachers’ self-efficacy
(Dellinger, et al., 2008) all utilize context validation. These studies show in each of their cases that the individual items present on the test relate to the construct of self-efficacy and the subject matter in which self-efficacy has been grounded.
Dellinger, et al. 2008; Smolleck, et al., 2006), so factor analysis and expert evaluation is later required to insure that the instrument adequately represented the intended content. This is conducted by researchers submitting the generated items to experts in the field for analysis and comment (Carberry, et al., 2010; Dellinger, et al., 2008; Smolleck, et al., 2006).
Research has shown that wording is an influential factor in the results of the factor analysis to check for validity.
Reliability
Reliability has different schools of thought, differing on which tests should be used to check for reliability. Most of the studies use similar testing procedures involving a Likert scale, Cronbach’s α, (Carberry, et al., 2010; Smolleck, et al., 2006; Yoon, et al., 2012) but a few studies utilize the Spearman-Brown reliability coefficient (Baker, et al., 2008) while others utilize an unspecified test of reliability (Dellinger, et al., 2008; Ritter, et al., 2001). Cronbach’s α is a test for internal reliability amongst items. The value indicates the degree with which the items are converging on testing a singular concept. Cases are made for various different levels of Cronbach’s, however DeVellis (2003) suggests Cronbach’s should
be between .7 and .95. Care must be taken once a value approaches or breaks .9 as a value “above .9 may suggest redundancies and show that the test length should be shortened”
(Tavakol & Dennick, 2011, p. 54). Other Information
& Householder, 2011). These samples are then parsed down based on research dependent criterion, Carberry, et al. (2010) for example removes respondents that did not complete the entire instrument, and removes responses that had the same score for each item. Each of these decisions has a justifiable reason for doing so and defense for the decision is provided in the research. The process of validation seems to trend along a path from smaller to larger sample sizes, as the instrument becomes more refined (Baker, et al., 2008). During the initial testing stages, researchers often use smaller sample sizes (Baker, et al., 2008). The large sample size studies also support this idea by including smaller sample sizes to test for validity of the instrument (Smolleck, et al. 2006). The studies, regardless of sample size, are still able to produce clear informative results. With smaller sample, studies note that the information found indicate enough validity to either pursue refinement or further validity and reliability testing (Carberry, et al., 2010). Most studies gather demographic information, however only a few studies actually require this information for the research (Cocannon & Barrow, 2009). This practice implies that gathering basic demographic information does not compromise the results gained by the instrument (Baker, et al., 2008; Carberry, et al., 2010; Dellinger, et al., 2008; Ritter, et al., 2001; Smolleck, et al., 2006; Yoon, et al., 2012). Summary
section presented reviewed the concepts of self-efficacy, teaching efficacy, STEM education, and engineering design.
The first concept reviewed in this chapter discussed self-efficacy and its role in education. Self-efficacy described how one felt about the level of their ability to complete a task. Because of this self-efficacy acted as a predictor of how likely, someone was to attempt a task and his or her reaction when a person encountered an obstacle when performing a task. Self-efficacy focused only on one task at a time. Teaching efficacy had links to the success of a teacher in delivering effective education. Self-efficacy of teaching a subject was one of the determinants of teaching efficacy. After explaining these constructs, which were specific to a domain, this chapter moved to explaining the domain of interest.
Engineering design was a concept present across multiple areas of STEM education as not only just a concept but also a standard. This chapter reviewed literature on the
characteristics of engineering design. It provided each of these characteristics, and organized them into groupings referred to as components. These components and characteristics broke a large concept, such as engineering design, into smaller, specific components to be utilized as the domain within self-efficacy. After defining self-efficacy and engineering design, this chapter moved to explaining the process of creating a self-efficacy based instrument.
through this process in order, explaining each individual step in greater detail. As the chapter moved from initial item generation towards instrument validation, each step was broken down, noting which portions were linear, concurrent, and cyclical. This process began with item generation, which contained the concurrent steps of construct definition, content definition, and scale selection. After item generation, it was a linear move towards SME involvement. Work with SMEs was cyclical starting with items being given to SMEs, SME feedback, and ending with item refinement. Once item refinement with SMEs was finished a linear move towards instrument testing was made. Instrument testing included the analysis of the results gained when the instrument was given to a sample. This analysis included concurrent tests of internal reliability such as Cronbach’s α, correlation tests, and factor
CHAPTER 3:METHODOLOGY Purpose of the Study
The purpose of this study was to develop an instrument to measure the self-efficacy of preservice technology and engineering teachers in teaching engineering design. The researchers wished to answer the question of how teachers felt about their abilities to teach engineering design. They then sought out an instrument to suit their needs. Similar
instruments were found, but none looked specifically at the question presented by the researchers. It was then determined that the instrument must be developed.
Research Questions
This study was designed to develop and validate a reliable instrument to measure self-efficacy of teaching engineering design. The study was driven by the question: What is the self-efficacy of STEM educators in teaching engineering design? Since this study involved instrument development though, the research questions of this study were:
1. Does the preliminary instrument align with the construct of self-efficacy? 2. Does the preliminary instrument represent engineering design?
3. Does the preliminary instrument measure the self-efficacy of teaching engineering design in preservice technology, engineering, and design education teachers? 4. Does the preliminary instrument demonstrate reliability?
Target Population
2) Participants were enrolled in a Technology or Engineering education degree program
3) Participants were above the age of 18
4) Participants had taken a course on engineering design Sample
This study used a sample of 31 students enrolled in North Carolina State University’s TDE program. These participants were voluntary. The sample was indicative of the target population because students enrolled in the program met all the criteria as long as they were also over the age of 18.
Procedure
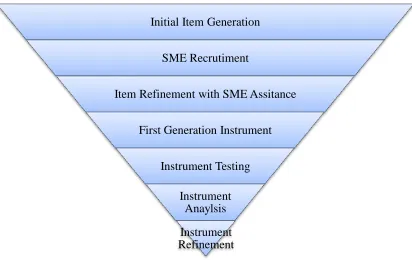
Figure 3.1 Steps for Development of the Preliminary SETED
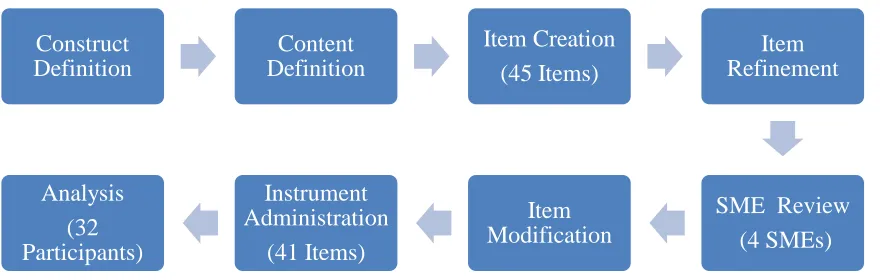
The first 4 steps represented phase one. Phase one was item generation by researchers, phase two, item refinement with the inclusion of subject matter experts. Phase two contained the fifth and sixth steps from Figure 3.1, while phase three was only step seven. Phase three was pilot testing of the instrument, and phase four was instrument refinement based on phase three results. Phase four was step eight; however, a full analysis was not completed. Analysis stopped after initial factor analysis and reliability testing (Carberry, et al., 2010). This methodology was part of a larger validation process that uses a triangulated mixed method methodology of validation. At the conclusion of this process, a validated instrument was not provided. An instrument was provided, however it would need more work before validation and reliability was fully achieved. Figure 3.2 provides the general methodology used as items were generated and then refined down to the final instrument.
Construct Definition
Content Definition
Item Creation (45 Items)
Item Refinement
SME Review (4 SMEs) Item
Modification Instrument
Administration (41 Items) Analysis
Figure 3.2 General Methodological Process for Instrument Development
The research was conducted with smooth transitions in between phases. The inclusion of SMEs marked the beginning of phase two. Phases one and two represented the majority of the research’s time commitment as the instrument was initially developed. Phase three
occurred only after approval by the institutional review board (IRB). Phases one and two were conducted before this approval was gained. After IRB approval and the completion of phases one and two, phase three began. As a part of phase three, the results were analyzed
Initial Item Generation (Items Created by Researchers)
SME Recrutiment
(Recruited for Construct and Context Specialties) Item Refinement with SME Assistance (Items Modified for Construct and Content
Validity)
First Generation Instrument (Initial Instrument Created from
Refined Items) Instrument Testing (Instrument Tested by
Participants) Instrument Analysis
(Instrument Analyzed for Reliability and
Validity) Instrument Refinement
(Items Removed or
and the results will inform the refinement of the instrument, which is phase four. Phase four was outside the scope of this research, but has been included as it is important to the overall methodology of instrument development.
Phase One - Item Generation.
Figure 3.3 Item Generation Methodology
Construct definition identified the binding constructs of the instrument and the key components of the constructs that must be included in the instrument itself (Bandura, 2006; Baker, et al., 2008; Carberry, et al., 2010; Dellinger, et al., 2008; Ritter, et al., 2001;
Smolleck, et al., 2006; Yoon, et al., 2012). The constructs formed the framework for understanding the instrument. This study focused only on one construct, self-efficacy. Bandura (1977) put forth the concept of self-efficacy and defined it as one’s belief in one’s ability to succeed in specific situations. Bandura (2006) also noted that this is not a measure of intent but capability, thus wording such as “can” should be used over “will”. Self-efficacy
was task specific so the task was also identified as a part of the construct. This logic resulted in the development of two self-efficacy stems: “I feel I can teach students…” and “I believe I can teach students…” Every item used an alternate stem, resulting in about half of the items
utilizing each stem. This was done to follow along with the mainstream approach of using individually worded items (Baker, et al., 2008; Carberry, et al., 2010; Dellinger, et al., 2008; Ritter, et al., 2001; Smolleck, et al., 2006; Yoon, et al., 2012) versus Bandura’s (2006) belief
stem approach. There was no difference in validity between the two approaches, and the selected method allowed for negatively worded items (Carberry, et al., 2010). After the
generation of the self-efficacy stem, the researchers moved to defining the content. This content definition would be coupled with the construct stems to create a finalized item (Bandura, 2006; Baker, et al., 2008; Carberry, et al., 2010; Dellinger, et al., 2008; Ritter, et al., 2001; Smolleck, et al., 2006; Yoon, et al., 2012).
Content definition identified the domain of self-efficacy in question. For this study, the content was teaching engineering design. Since language reflecting teaching had already been included in the stem, the focus of content definition was placed upon engineering design. Engineering design was broken down into relevance, processes, complexity of
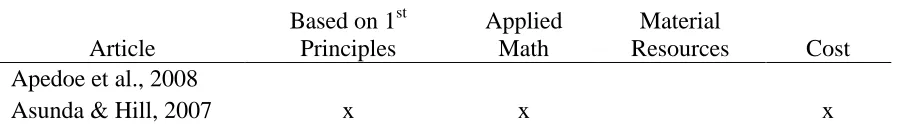
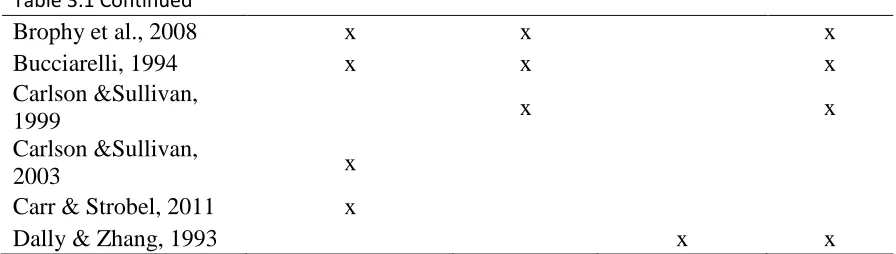
problem, and constraints (Lammi, 2011). Each of these components was further broken down into characteristics. In order to identify the characteristics and components literature was reviewed that discussed the characteristics of engineering design problems (Lammi, 2011). Appendix A presents each of the identified components along with their characteristics. An x indicates that the article either explicitly stated or implicitly discussed the characteristic. Table 3.1 below provides an example, using the constraint component and a few of the review articles. For example, using the table below, Asunda & Hill (2007) discussed first principles, application of math, and cost as constraints to be included in engineering design problems.
Table 3.1 Characteristics of Constraints Component for SETED
Article
Based on 1st Principles
Applied Math
Material
Resources Cost Apedoe et al., 2008
Table 3.1 Continued
Brophy et al., 2008 x x x
Bucciarelli, 1994 x x x
Carlson &Sullivan,
1999 x x
Carlson &Sullivan,
2003 x
Carr & Strobel, 2011 x
Dally & Zhang, 1993 x x
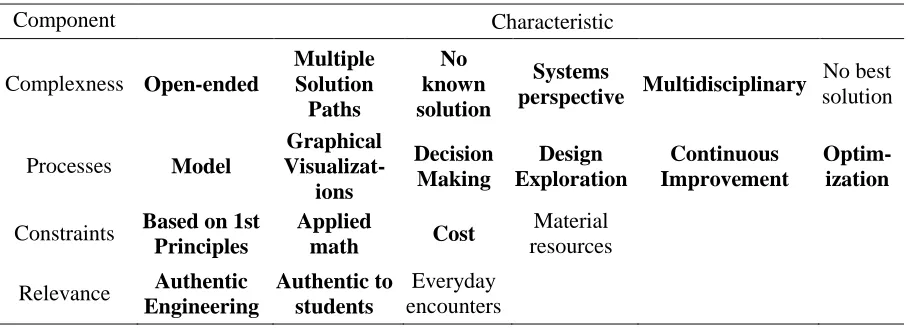
Table 3.2 Summary of components and characteristics of engineering design used in the SETED
Component Characteristic
Complexness Open-ended
Multiple Solution Paths No known solution Systems
perspective Multidisciplinary
No best solution
Processes Model
Graphical Visualizat-ions Decision Making Design Exploration Continuous Improvement Optim-ization
Constraints Based on 1st Principles
Applied
math Cost
Material resources
Relevance Authentic Engineering
Authentic to students
Everyday encounters
Pairing a stem created in the construct definition with a characteristic resulted in the creation of the initial items. These first generation items can be found in Appendix B. Table 3.6 provides two example items, one with, and one without negative wording. Research showed that negatively worded items did not hinder validity (Carberry, et al., 2010), but provided researchers with a way to filter the results in the hopes of eliminating respondents that did not read each item.
Table 3.3 Example First Generation Items
First Generation Items
Example Item Descriptor
The researchers also required a scale to be used with each item. This scale was built to be universal for the entire instrument ((Baker, et al., 2008; Carberry, et al., 2010;
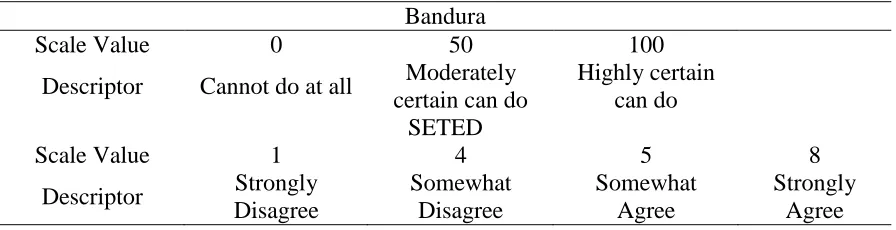
Dellinger, et al., 2008; Ritter, et al., 2001; Smolleck, et al., 2006; Yoon, et al., 2012). Scale selection was the final portion of item generation. Bandura (2006) used an 11-point scale ranging from 0 to 100, with 10-unit intervals. Bandura (2006) stated, "a simpler response format retains the same scale structure and descriptors but uses single unit intervals ranging from 0 to 10" (p. 312). This was echoed by other researchers, who used single interval Likert-type scales (Baker, et al., 2008; Carberry, et al., 2010; Dellinger, et al., 2008; Ritter, et al., 2001; Smolleck, et al., 2006; Yoon, et al., 2012). Given Bandura’s (2006) format of having a central value that represented moderate levels of self-efficacy, not the absence of self-efficacy, researchers decided to use a Likert-scale with even intervals. This allowed for the two central items to be represented as positive and negative self-efficacy. Given the frequency of 7-point scales seen in other research, a scale size of 8 was selected. This allowed researchers to stay close to the 7-point scale seen in other research, while still using an even scale. Given that research suggested the maximum and minimum values would see little use in practice, the scale was increased instead of decreased so that the expected scale use was 6 points in favor of 4 points.
descriptors and associated scale values used in the SETED. The difference in descriptors was a result of the difference between item wording between the SETED and Bandura's items. These type of descriptors were not uncommon for Likert-type scales (Baker, et al., 2008; Carberry, et al., 2010; Dellinger, et al., 2008; Ritter, et al., 2001; Smolleck, et al., 2006; Yoon, et al., 2012).
Table 3.4 Comparison of Bandura (2006) Scale Descriptors and SETED Descriptors Bandura
Scale Value 0 50 100
Descriptor Cannot do at all Moderately certain can do
Highly certain can do SETED
Scale Value 1 4 5 8
Descriptor Strongly Disagree
Somewhat Disagree
Somewhat Agree
Strongly Agree
Phase Two - Item Refinement with SMEs.
After the initial battery of items was created, they were sent to SMEs for review (Smolleck, et al. 2006). A SME from self-efficacy, engineering, engineering education, and teacher education was selected. The engineering SMEs had an awareness of engineering design, and came from engineering education or were a practicing engineer. For the
engineering design, SMEs preference was given to a practicing engineer. In the addition to a practicing engineer, engineering faculty was used. The teacher education SME had
engineering design. These SMEs were selected and no remuneration given for their time due to this study being unfunded. Four SMEs were selected, each identifying with one primary area.
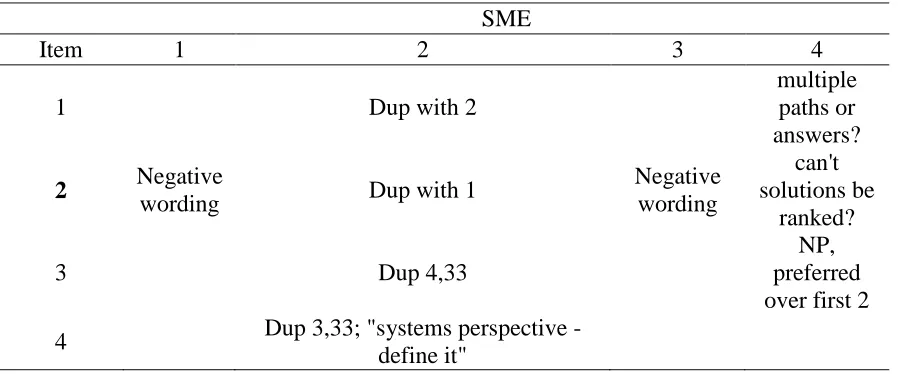
The items were sent to the pool of SMEs, and they were asked to provide feedback and comments on each item for their field. The SME feedback was reviewed and adjustments made to the individual items (Baker, et al., 2008; Carberry, et al., 2010; Smolleck, et al., 2006). Appendix C indicates the suggested changes from each SME. No names are provided on the table; instead, each SME has been given a number. Bold faced items in Appendix C indicate the item had negative wording, as every SME commented that the negative wording should be removed. Table 3.5 provides an example of the comments SMEs gave for items 1-4 of the first generation items.
Table 3.5 Example SME Comments
SME
Item 1 2 3 4
1 Dup with 2
multiple paths or answers? 2 Negative
wording Dup with 1
Negative wording
can't solutions be
ranked?
3 Dup 4,33
NP, preferred over first 2 4 Dup 3,33; "systems perspective -
SMEs noted a large number of duplicated items, beyond that which the researcher originally recognized as duplicate items. Researchers went through and decided which duplicates were acceptable and intended. If the SMEs determined that an item was completely off basis and unable to be brought into line, it was be removed as part of the refinement process (Carberry, et al., 2010).
Any necessary wording changes to increase item clarity were made. Appendix D shows the updated list of items to be sent to SMEs. This list included items scheduled to be deleted. These items were sent to each SME with instructions to again review each item. Table 3.6 presents an example of second generation items. A third example has been added to represent the addition of some new items. SMEs were informed that the researchers were aware that some items were duplicated, and this was intentional. They were also instructed that any items they still felt were overly redundant should be noted. SMEs were told that any items with a strikethrough were intended to be deleted. They were given the opportunity to inform the researchers of any item slated for deletion that they felt should be kept.
Table 3.6 Example Second Generation Items
Second Generation Items
Example Item Descriptor
1 I feel I can teach students how to make performance based trade-offs. 2 I feel I can teach students to develop conceptual models.
The SMEs sent back their responses, and again the researchers looked at any issues the SMEs noted and made the necessary changes. Since the SMEs came back with very few changes required, it was not necessary to undergo another round of revisions (Baker, et al., 2008; Carberry, et al., 2010; Dellinger, et al., 2008; Ritter, et al., 2001; Smolleck, et al., 2006). The finalized items can be found in Appendix E. Table 3.7 provides example third generation items. Example 2 is missing, demonstrating its deletion from the third generation of items.
Table 3.7 Example Third Generation Items
Third Generation Items
Example Item Descriptor
1 I feel I can teach students how to make performance based trade-offs. 2
3 I believe I can create metrics to assess students’ engineering work successfully
These final items were then sent along with all IRB materials, such as informed consent, to the IRB for review. It was at this point that the researchers were ready to begin phase three. The TDE faculty was contacted once IRB approval was gained and the
researchers began recruitment. Recruitment materials including informed consent and script can be found in Appendix F and G respectively.
Phase Three - First Testing.
end of phase two occurred. Phase three started with administering the instrument to students enrolled in North Carolina State University’s Technology, Engineering, and Design
Education, TDE, program. The researcher began by introducing himself to majority of the TDE courses offered that semester. During this introduction the researcher introduced himself, the research, and reviewed the informed consent form with the students. Informed consent forms, with a ERL to the instrument, were provided to students. After visiting the courses, the researcher contacted the program coordinator and asked that an introductory email was sent out to undergraduate students in the major asking volunteers to participate in the study. During this phase informed consent from any participant was also be obtained. Informed consent was obtained before a student began taking the instrument. Students not granting consent were unable to continue.
Informed consent included: the purpose of the study, the experience subjects should expect while participating, any risks involved, benefits the subject may receive for
participation, benefits of the study, contact information for the primary investigators, and a statement of confidentiality. Additionally, subjects were asked to confirm they were at least 18 years of age.
The researcher waited four weeks from the initial introduction in TDE courses before closing the instrument to new responses. At the closing of the instrument, there were 32 participants. The researcher felt this was a small sample size; however, given the size of the sample population the researcher believed he was unlikely to gain any more participants. The responses were then taken, and statistical analysis was performed, moving the research forward to phase 4, analysis and refinement. Analysis consisted of factor loading, inter-item reliability, and descriptive statistics (Baker, et al., 2008; Carberry, et al., 2010; Dellinger, et al., 2008; Ritter, et al., 2001; Smolleck, et al., 2006). The specific reliability test was
Cronbach's α (Carberry, et al., 2010; Smolleck, et al., 2006; Yoon, et al., 2012).
Phase Four - Data Based Refinement.
several pieces of information. The first piece of information was a study performed by Hailey et al. (2011) in which they used a threshold value of .44 for factor analysis with a study containing at least 100 respondents. Brown suggests that in order to satisfy Thurstone’s (1947) criteria for simple structure factor analysis “with a sample size of say 100
participants, loadings of .30 or higher can be considered significant, or at least salient (see discussion in Kline, 2002, pp. 52-53). With much larger samples, even smaller loadings could be considered salient” (Brown, 2009, p. 22).
So if larger samples can use smaller loadings, then smaller samples would require higher loadings in order to maintain significance. Additionally items that loaded into multiple factors, values greater than .600, with a difference in index values of .200 or less were flagged as potential issues. Two items, 15 and 17, loaded onto multiple factors and will need to be modified or deleted. Boldface in table H indicates loadings greater than the threshold of .600. In order to identify each of the factors of teaching engineering design, as determined by the factor analysis of the SETED, all the items within a factor were reviewed.