Big Data Application in Agriculture to
Maximize the Rice Yield Crop Production
using Data Mining Techniques
Sneha N1, Dr. Jharna Majumdar2
Assistant Professor, Department of CSE (PG), NMIT, Bangalore, India1
Dean R&D, Prof and Head CSE (PG), NMIT, Bangalore, India2
ABSTRACT: Data Mining is an emerging research field in agriculture specially crop yield analysis and yield prediction. Agriculture plays a significant role in each country; as well important sector of Indian economy as it contributes about 17% to the total GDP (gross domestic production) and provides employment to over 60% of the population. Yield prediction is a very important agricultural problem that remains to be solved based on the available data. Data mining techniques are used to improvise the crop yield, where huge amount of past history of agricultural data is collected from different agricultural sectors and various techniques of data mining employed on the dataset. Mining the important patterns from historical data and using those patterns to predict future crop production. In this paper the data mining techniques such as Chameleon clustering, Random forest, Regression types are discussed for crop yield prediction. Here we have focused on the analysis of rice yield production, how different parameters influence the production and finding optimal parameters required to maximize the production through data mining techniques.
KEYWORDS: Chameleon; Random Forest; Regression; Big Data.
I. INTRODUCTION
In India, agriculture sector provides livelihood to 65 to 70 per cent of the total population. Day by day the population is increasing; there is a big challenge to serve food all over the country. There is an essential for higher productivity and better quality. India is continuously facing the problems for increasing the crop production due to various climatic variations. Achieving desired food targets is a challenging task, there is a drop in production and productivity of major crops. Government has taken many initiatives to increase the crop productivity like National Rain fed Area Authority (2006), Centrally Sponsored Scheme of Micro-irrigation (2006), National Agricultural Development Scheme (2007), the National Food Security Mission (2007) RashtriyaKrishi Vikas yojana. The major crops of India are Wheat, Maize, Rice, Millets and Pulses. Agriculture depends on various independent factors such as climate, geography, political and economic factors. The yield of agriculture depends on climate, pesticides and harvest planning. In the past, yield prediction [1] was performed by considering farmer's experience on particular field and crop.
Rice is one of the important staple food crops and most cultivated crop in India as well as in Asian countries, diet of major part of India. India stood second after china in rice production. It is food to about half of the Indian population. It is cultivated under wide variety of varying conditions of altitude and climate, requires hot and humid climatic conditions, abundant water supply, prolonged sunshine, ideal temperature required throughout the cultivation is about 200 to 400C. Under high temperature, high humidity with sufficient rainfall and irrigation facilities rice grows well. Soil requirements are red sandy, loamy riverine alluvium, red-yellow, hill, sub-montane, Terai, laterite, costal alluvium, mixed red, black, medium and shallow black soils. And rainfall of ranging from 150 cm to 200 cm. and the major fertilizers required is Nitrogen (N), Phosphorous (P), and Potassium (K).
Data mining [12] is a process of extracting important and useful information from large data sets. Raw data, which is obtained from the history of crop yields, is required for the prediction. The agricultural mining is the process of identifying the hidden patterns from a large of agricultural data. Clustering [6] plays an important role in agricultural mining, where large amount of the data is to classify or group them into a set of similar categories or clusters. Here we discuss Chameleon, Random Forest; Regression Techniques for crop yield prediction and to maximize the production by considering different parameters of rice.
II. RELATED WORK
Big data analytics is a process of collecting, organizing and examining huge amount of data to identify the hidden pattern, and other useful information which can be used to make better decisions. There various types of challenges on Big data in Agriculture. Data mining which is otherwise called as data or knowledge discovery is the method of evaluating and classifying data from various prospect and encapsulate it into useful information. The data mining techniques used in agriculture for prediction of problem, disease detection, optimizing the pesticide.The data analysis help us to provide a better understanding of large data by classification and prediction. Example Classification build a classification model to categorize agriculture production is high or low, where prediction which is used to predict the data according to the given data. For the given data what is production status.
[1] In this paper they have discussed about predicting yield production. Yield prediction is a very important in agriculture sector for the farmers, since they can’t predict the future crop yield due to natural calamities like drought, rainfall, temperature weeds, insects etc. some data mining techniques such as K-Means and Multiple Regression methods are discussed to provide the solution for predicting yield production. This aims to data models that achieve a high accuracy and a high generality in terms of yield prediction capabilities. [2] In this paper summarizes the application of data mining techniques such as k-means, bi clustering, k nearest neighbor, Neural Networks, Support Vector Machine and Naïve Bayes Classifier in the agriculture field. Different data mining techniques are discussed to provide a solution to different agricultural problems.
[3] In this paper authors discussed differentfarm types, soil types, and Cropprediction usingdata mining techniques, Multiple Linear Regression (MLR) technique for the selected region. This paper aims to finding suitable data models that achieve a high accuracy and a high generality in terms of yield prediction capabilities.[4] In this paper a survey of Different data mining techniques that are in use for the crop yield estimation are K-Means, K-Nearest neighbour (KNN). [8]In this paper survey is to provide a comprehensive review of different types of data mining techniques used in Precision Agriculture and discussed overview of Data Mining in Precision Agriculture, Yield Data Prediction, soil classification techniques.
III. PROPOSED METHOD
Different data mining techniques are employed on collected dataset. In proposed work we have collected the agriculture data from several sources such des.kar.nic.in and raitamitra.kar.nic.in. The dataset ranges from year 2005 to 2013 of rice production. Here we have considered Karnataka state, consists of 30 districts and 1200 rows of data and 18 parameters.The Input Dataset consist of 9 year data with following parameters Year, State-Karnataka (30 districts), District , Crop (Rice) , Area (in Hectares) , Production (in Tonnes), Yield, Average Rainfall (mm), Soil, canals, wells, water(Cusec), Nitrogen(kg/Ha), Phosphorus(Kg/Ha),Potassium(Kg/Ha), Actual Rainfall , Zone and Insecticides.
1. CHAMELEON METHOD
In the proposed work chameleon clustering is used. CHAMELEON [9] is a clustering algorithm that explores dynamic modelling in hierarchical clustering. Measures the similarity based on dynamic modelling. It operates on a sparse graph in which nodes represent data items, and weighted edges represent similarities among the data items. It finds the clusters in the data set by using a two phase algorithm. During the first phase,
Phase 1: CHAMELEON uses a graph multi- partitioning algorithm on the graph to find the large number of clusters of well-connected vertices. Each cluster should contain mostly points from one cluster.
Phase 2: It uses an agglomerative hierarchical clustering algorithm to find the genuine clusters by repeatedly combining together these sub-clusters.
Fig-1. Chameleon Method
Two clusters are combined if the resulting cluster shares certain properties with constituent cluster. Chameleon depends on 2 factors Relative interconnectivity and Relative closeness.
Relative Inter-Connectivity: Relative interconnectivity is the absolute interconnectivity of two clusters normalized by the internal connectivity of the clusters. Two clusters are combined if the points in the resulting cluster are almost as strongly connected as points in each of the original clusters.
Relative closeness: Relative closeness is the absolute closeness of two clusters normalized by the internal closeness of the clusters. Two clusters are combined only if the points in the resulting cluster are almost as close as in each of the original clusters.
2. RANDOM FOREST METHOD
STEPS: At each node:
1. Select m variables at random out of all M possible variables (independently for each node). 2. Find the best split on the selected m variables.
3. Grow the trees to maximum depth (classification).
4. Each tree is grown to the largest extent possible. There is no pruning.
Tree faces forest error rate depends on two things:
The correlation between any two trees in the forest. Increasing the correlation increases the forest error rate. The strength of each individual tree in the forest. A tree with a low error rate is a strong classifier. Increasing
the strength of the individual trees decreases the forest error rate.
3. REGRESSIONS METHOD
Regression model are also used in crop yield prediction. Regression is mainly used for predicting about the future (not only crop yield). This model defines two variables independent and dependent variable. The value of the dependent variable can be predicted using the independent variable. Ex: In case of crop yield and soil, yield is dependent on the type of the soil/any other factor. For a type of soil is suitable for that crop then the yield is high. We use 2 methods of regression such as multiple regressions and logistic regression.
a. MULTIPLE REGRESSION
Multiple regression analysis is a powerful technique used for predicting the unknown value of a variable from the known value of two or more variables- also called the predictors. In this paper, yield prediction is the main objective, using this method farmer’s get approximate information about the future yield prediction. A Multiple regression technique is an extension of a linear regression technique which involves more than one predictor variable. It allows response variable Y to be modelled as a linear function of multidimensional feature vector that is we have
Y= α + β1 X1+ β2 X2
Where α, β1 and β2 are regression coefficients. The variable whose value is to be predicted is known as the dependent variable and the ones whose known values are used for prediction are known independent (exploratory) variables.
b. LOGISTIC REGRESSION
Logistic regression predicts the probability of an outcome that can only have two values. The prediction is based on the use of one or several predictors (numerical and categorical). A linear regression is not appropriate for predicting the value of a binary variable. Logistic regression is used to describe data and to explain the relationship between one dependent binary variable and one or more nominal, ordinal, interval or ratio-level independent variables.
=
Where Pi -probability pi using a linear predictor function, The regression coefficients β0,β1, ...,βm are grouped into a single vector β of size m + 1.
IV.RESULTS
1. CHAMELEON RESULTS
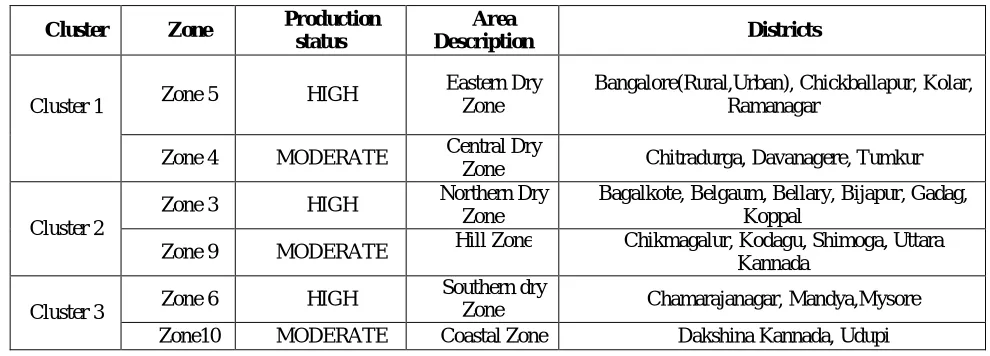
To apply the Chameleon clustering, we need to give the value of k, number of clusters to be formed; cluster method is applied on the dataset. The dataset contains different parameters; one of them is zone, where it specifies the type of area whether its dry area, costal area or hilly zone etc, and also soil type of that district.
The Table 1.1 represents chameleon results as follows
Cluster Zone Production status
Area
Description Districts
Cluster 1 Zone 5 HIGH
Eastern Dry Zone
Bangalore(Rural,Urban), Chickballapur, Kolar, Ramanagar
Zone 4 MODERATE Central Dry
Zone Chitradurga, Davanagere, Tumkur
Cluster 2
Zone 3 HIGH Northern Dry
Zone
Bagalkote, Belgaum, Bellary, Bijapur, Gadag, Koppal
Zone 9 MODERATE Hill Zone Chikmagalur, Kodagu, Shimoga, Uttara Kannada
Cluster 3 Zone 6 HIGH
Southern dry
Zone Chamarajanagar, Mandya,Mysore Zone10 MODERATE Coastal Zone Dakshina Kannada, Udupi
Table 1.1- Chameleon Results
Zone 4, 5–Red –Sandy, loamy, Laterite soil
Zone 3, 9 - Red –Sandy, loamy, Shallow Black, Coastal alluvium, Laterite soil Zone 6, 10 - Red –Sandy, loamy, Laterite, gravelly, deep black soil
Applying Chameleon method it groups the zone type and soil type, which area is suitable for rice production. Here we have used k=3. This cluster represents that type of soil suitable for better rice production under HIGH and MODERATE production, improving soil fertility by adding required fertilizers and crop pattern in the area of low and moderate areas we can expect better quality rice.
2. RANDOM FOREST RESULTS
Random forest algorithm is applied on the dataset, the algorithm finds the best split among the set of variables and generates the decision tree with best split as root node and status HIGH, MODERATE and LOW as leaf nodes. The Table 1.2 represents percentage yield status distributed in dataset.
High Production Low Production Moderate Production
41.7 21.9 36.3
Fig 2: Decision Tree for Agricultural Dataset
In the figure 2, the random forest finds the Nitrogen as best spilt through probability and it becomes the root node and secondary node is water, water as 2nd best split. It distributes the dataset among the nodes, node 6 and node 4 has high productivity and moderate productivity. From random forest we can conclude that
If the Nitrogen is <=75 Kg/Ha and water should be greater than 6679 cusec to get moderate productivity per hectare (depends on Area per Hectare).
If the nitrogen > 75 Kg/Ha and water should be less than 30250 cusec to get High productivity (depends on Area per Hectare).
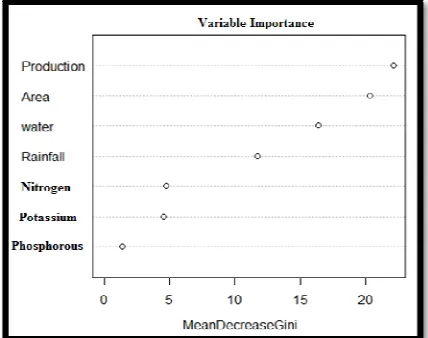
Variable Importance in Random Forest Method
Another important factor in Random forest is to find the most important variable in set through the Gini importance. Every time a split of a node is made on variable m the gini impurity criterion for the two descendent nodes is less than the parent node. Adding up the Gini decreases for each individual variable over all trees in the forest gives a fast variable importance that is often very consistent with the permutation importance measure.Mean Decrease Gini Measure of variable importance based on the Gini impurity index used for the calculation of splits in trees.
In this figure, higher the value of mean decrease accuracy or mean decrease gini score, higher the importance of the variable in the model. In the plot shown above, production is most important variable.
High Low Moderate Class.Error
rate
High 250 21 210 0.1803279
Low 0 221 211 0.3437500
Moderate 26 25 242 0.2075472
Accuracy = 95.89 Error Rate = 4.11
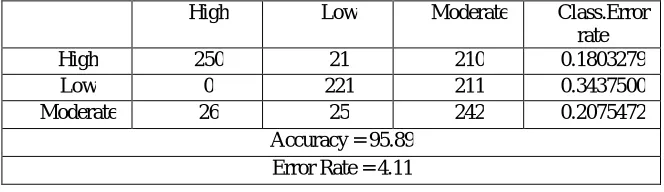
Table1. 3 Overall Statistics, Accuracy, Error Rate of the Decision Tree
Table 1.3 shows the overall statistics and accuracy and error rate of the decision tree for yield status. The Accuracy of the decision tree is 95.89 and approximate error rate is 4.11.
3. MULTIPLE REGRESSIONS RESULTS
For a given set of parameters example for the given Area, Water, Fertilizers (Nitrogen, phosphorous, Potassium) what kind of yield is expected like high, moderate, low production. Depending on the production status, example if yield is low production, how the yield can be improvised.
For the given Area, Rainfall, Water, Nitrogen, Potassium, Phosphorous, The co-efficient ‘a’ is 1682.594. The Standard formula for regression is
y = a + (XArea*2000) + (xRainfall *700) +(xWater *20000) + (xNitrogen *100) + (xPhosphorous*75)
Where XArea, xRainfall, xWater, xNitrogen, xPhosphorous are the standard error of their respective coefficient. For the given Area 2000 hectares, rainfall of 700mm, water requirement is 20000 cusec, Nitrogen of 100kg and phosphorous of 75 kg. The predicted value of Y i.e yield expected is 2052 yield for given area, rainfall, water, N, P. To improvise the yield water and Nitrogen, phosphorous quantity can be increased by 50000, 150, 100 respectively so that yield can be improvised to 2362.263.
4. LOGISTIC REGRESSION RESULTS
Logistic regression is used to describe data and to explain the relationship between one dependent binary variable and one or more metric (interval or ratio scale) independent variables.
The nitrogen Effect Plot is described in the Figure 4. The plot depicts the effect of Nitrogen with respect to the varying yield. Hence it is observed that at the breakpoint of 2.6 onwards, yield will increment linearly with respect to the change in the concentration of Nitrogen.
Fig 5: Potassium vs. Yield Plot
Potassium effect plot is described in the Figure 5. The plot depicts the effect of potassium with respect to the varying yield. It is observed that at the breakpoint 2.80 for the yield, its value will get constant, irrespective of the increase in concentration of potassium to any level.
Fig 6: Phosphorous vs. Yield Plot
Phosphorus Effect Plot is described in Figure 6.The plot depicts the effect of Phosphorus with respect to varying yield. It is observed that at the breakpoint 2.8 for the yield, its value will decrease linearly on the increase in the concentration of Phosphorus.
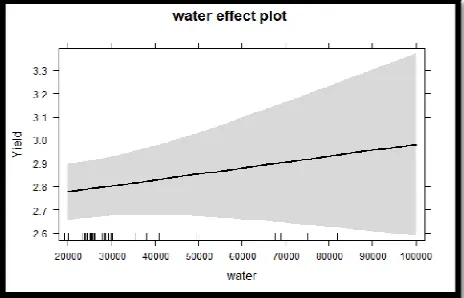
The effect of water is shown in the Figure 7. The plot depicts the effect on yield due to water. It is observed that at the breakpoint 2.8 for the yield, its value increases linearly on increasing the content of water. Hence increasing in water content will increase the value of yield linearly.
V. CONCLUSION AND FUTURE WORK
In this paper, yield prediction is the main objective, if farmers get approximate information about the future yield prediction; they can improvise the yield, if production is less. Data Mining Techniques are implemented on the input data to assess the best performance yielding method. By using data mining techniques Chameleon, Random Forest, regression Techniques we derived the optimal parameters required by rice. By analyzing the 9 years agricultural historical data for rice, chameleon derives the best soil required by rice and soil fertility improvisation. From the Random forest we can derive, for the available water and fertilizers what kind of yield is expected. From the regression technique for the available set of selected multiple parameters what kind of yield can be expected, an increase of parameters how the yield can maximized and logistic regression summarizes how yield is affected by different parameters like water, nitrogen, phosphorous, potassium through different plots.
REFERENCES
1. D Ramesh, B Vishnu Vardhan, “Data Mining Techniques and Applications to Agricultural Yield Data”, International Journal of Advanced Research in Computer and Communication Engineering Vol. 2, Issue 9, September 2013.
2. E.Manjula*, S.Djodiltachoumy”Analysis of Data Mining Techniques and classification techniques for Agriculture Data” International Journal of Computer Science and Engineering Communications Vol.4, Issue.2, 2016
3. S.Kavitha, D.Geetha, M.Gomathi, R.Suresh Kumar “Agricultural Analysis For Next Generation High Tech Farming In Data Mining” International journal of Scientific Development and Research Vol 1,Issue 10, October 2016.
4. Perpetua Noronha1, Divya .J2, Shruthi .B.S3 “Comparative Study of Data Mining Techniques in Crop Yield Prediction”ISSN: 2278-1021.International journal of Advanced research in computerand communication engineering, Vol 5, Sept issue 2, October 2016.
5. Ms.Kalpana.R, Dr.Shanthi.N ,Dr.Arumugam.S“A Survey on Data Mining Techniques in Agriculture” International journal of Advances in computer science and technology, Vol 3 issue.8 August 2014.
6. E.Manjula*, S.Djodiltachoumy “ Analysis of Data Mining Techniques for Agriculture Data” International Journal of Computer Science and Engineering Communications Vol.4, Issue.2, April 2016
7. Mohammad Motiur Rahman, NaheenaHaq and Rashedur M Rahman “Comparative Study of Forecasting Models on Clustered Region of Bangladesh to Predict Rice Yield”, 17th. IEEE International Conference on Computer and Information Technology (ICCIT), Dhaka, 2014. 8. Tejas S. Mehta Dr. Dhaval R. Kathiriya “Survey of Data Mining Techniques in Precision Agriculture” Volume : 4 , Issue : 7 ,July 2015 9. George KarypisEui-Hong (Sam) Han Vipin Kumar “CHAMELEON: A Hierarchical Clustering Algorithm Using Dynamic Modeling” 2011. 10. Leo Breiman Adele Cutler “Random Forest-Decision tree” University of California Berkeley January 2001.
11. P. Berkhin, “A Survey of Clustering Data Mining Techniques” Kogan, Jacob; Nicholas, Charles; Teboulle, Marc (Eds) Grouping Multidimensional Data, Springer Press (2006) 25-72
12. J. Han and M. Kamber, “Data Mining: Concepts and Techniques”,Morgan Kaufmann Publishers, 2001.
BIOGRAPHY
Ms. Sneha N, Assistant Professor of Dept of M.Tech CSE at Nitte Meenakshi Institute of Technology, Bangalore. She received
Master of Technology degree in 2014 from BIET, Karnataka, India. Her research area are Data mining, Big Data analytics, cloud computing.
Dr. Jharna Majumdar, Dean R&D, Prof & HOD of Dept of M.Tech CSE at Nitte Meenakshi Institute of Technology, Bangalore.
She served DRDO from 1990 to 2007 and retired as Scientist G and Head of Aerial Image Exploitation Division, Aeronautical Development Establishment (DRDO), Bangalore, India. She received her Post Graduate in Computer Technology from Indian Institute of Technology. She received her PhD (Electrical Engineering). Her research areas include Computer Vision, Pattern Recognition, AI, Parallel Processing and development of Image Exploitation System for Aerial and Ground Based reconnaissance platforms.
The authors express their sincere gratitude to Prof N.R Shetty, Advisor and Dr H.C Nagaraj, Principal, Nitte Meenakshi Institute of Technology for giving constant encouragement and support to carry out research at NMIT.