HENRY, ERICA. Disturbance and Conservation of At-risk Butterflies. (Under the direction of Dr. Nicholas M. Haddad).
Across the globe, insect populations are declining. For many species, loss of historic disturbance is a main driver of habitat loss. This threat, however, has the potential to be reversed through responsible land management. I answered the following two questions: 1) how best can we restore historic disturbances in the presence of rare species? 2) how will climate change affect future population dynamics? To answer these questions, I focused on three endangered butterfly species, Bartram’s scrub-hairstreak, St. Francis’ satyr, and Miami blue.
I studied the hostplant of Bartram’s scrub-hairstreak, Croton linearis, to understand how hostplant populations respond to different types of disturbance-based management. I compared survival, recruitment, and population growth rates for C. linearis following prescribed fires, mechanical understory removal, and in control plots. In the first year post-management, survival rates did not differ across the treatments. In the second year, survival was significantly higher in fire plots than mechanical and control plots. Both disturbance treatments stimulated a flush of recruitment in the first year post-treatment, but there was almost no recruitment in control plots. Despite this recruitment, two years after treatments population growth rates in mechanically cleared plots were <1 and no different from controls; only prescribed fire led to increases in croton population.
patterns in almost all response variables I measured. Endangered caterpillars foraged under more cover than common ones, endangered caterpillar survival was highest in restoration sites and common caterpillar survival was highest in controls. These survival differences translate to differences in adult population sizes, with endangered butterfly populations highest in restoration sites and common butterfly populations highest in controls. These differences demonstrate that Appalachian brown is not a good substitute for St. Francis’ satyr, and that restoration strategies designed based on Appalachian brown may perform poorly for St. Francis’ satyrs.
Miami blue butterflies are vulnerable to climate change. To understand how climate change will affect Miami blue butterfly population dynamics I developed estimates of population density, determined how climate variables control phenology, and built a population model to explore how our uncertainty about the butterfly’s biology and future climate change interact to affect future Miami blue persistence or extinction. I found peak densities of Miami blues were in the 100’s of butterflies per hectare and that butterfly phenology was controlled by precipitation patterns. My population model used daily precipitation projected by downscaled climate models to drive butterfly population dynamics. I compared extinction dates predicted by 20 climate models across various combinations of diapause survival values (life stage about which we know nothing) and initial population sizes. I found that Miami blue population was more sensitive to variation in diapause survival than future changes in precipitation.
by
Erica Helen Henry
A dissertation submitted to the Graduate Faculty of North Carolina State University
in partial fulfillment of the requirements for the degree of
Doctor of Philosophy
Biology
Raleigh, North Carolina 2018
APPROVED BY:
_______________________________ _______________________________ Nicholas Haddad William Morris
Committee Chair
_______________________________ _______________________________
iii I grew up on the shores of Puget Sound in Washington State, digging for clams and geoducks, and backpacking in the Cascade mountains. This instilled in me a love of the outdoors and motivation to protect natural resources and open spaces. After graduating from Willamette University in Salem, Oregon, I traveled widely across the United States, working on a variety of research projects centered on endangered species habitat restoration and management.
iv I would like to thank my family, Hank, Helen, and Anna Henry, for always answering the phone and being the best, supportive family around. I would also like to thank my adviser Nick Haddad for being a super supportive advocate for me throughout my PhD, and my committee members Bill Morris, Becky Irwin, and Adam Terando, for sharing their wisdom and treating me like a collaborator. The other members of the Haddad Lab, Tyson Wepprich, Christine Hawn, Elsita Kiekebusch, Lindsey Kemmerling, and Sean Griffin have been so helpful working through research issues, or de-stressing about those same issues. I could not have had so much fun
bouncing back and forth between Florida and North Carolina without having such good friends in both places, all of you know who you are! I would especially like to thank Joe Bailey for letting me live in his house and saving me from either losing my mind in the bunkhouse or spending a lot of money on rent. My dissertation relied heavily on support from the staff at the Florida Keys National Wildlife Refuges, specifically Chad Anderson and Kate Watts who funded the work and made sure things happened on the ground. I also benefitted greatly from the hard work of Aerin Land, Jimi Sadle, and others at Everglades National Park who collected great data they were willing to share with me and worked with me to overcome logistical hurdles in the park. For additional funding and data, I thank Jaret Daniels and the folks in his lab,
v sports in the field and making me a better scientist. My dissertation work was funded by the following sources: DOD/DOE Strategic Environmental Research and Development Program,
award number RC-2119; principal investigator: E. E. Crone, Disney Conservation Fund Reverse
the Decline grant to J. Daniels. Florida Keys National Wildlife Refuges, DOD Fort Bragg
Endangered Species Branch contract funding to N. Haddad, Southeast Climate Science Center
vi
LIST OF TABLES ... ix
LIST OF FIGURES ... x
CHAPTER 1 ... 1
Two surrogates for wildfire, prescribed burning and mechanical clearing, differentially affect demography of a rare, endemic plant ... 1
ABSTRACT ... 1
INTRODUCTION ... 2
METHODS ... 5
Study system ... 5
Mechanical clearing experiment ... 6
Prescribed fire monitoring ... 8
Statistical analyses ... 8
RESULTS ... 9
DISCUSSION ... 10
REFERENCES ... 16
FIGURES ... 21
CHAPTER 2 ... 23
Are substitute species the white whale of endangered species conservation? ... 23
ABSTRACT ... 23
INTRODUCTION ... 23
METHODS ... 26
Study Species and Site ... 26
Caterpillar host use and survival ... 28
Caterpillar behavior ... 29
Caterpillar microhabitat ... 30
Adult locations ... 30
Adult behavior ... 31
Index of Population Size ... 32
RESULTS ... 33
Caterpillar host use and survival ... 33
Caterpillar behavior ... 34
Caterpillar microhabitat ... 34
vii
Index of population size ... 35
DISCUSSION ... 36
REFERENCES ... 41
TABLES ... 46
FIGURES ... 47
CHAPTER 3 ... 49
Point count methods to monitor butterfly populations when traditional methods fail: a case study with Miami blue butterfly ... 49
ABSTRACT ... 49
INTRODUCTION ... 50
METHODS ... 53
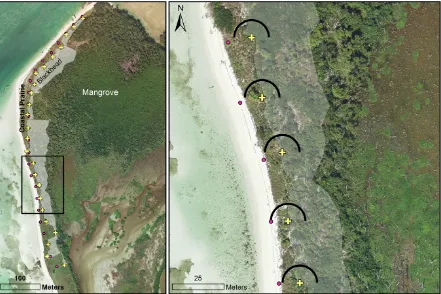
Study species and sites ... 53
Estimating density ... 57
Estimating area of suitable habitat ... 59
Predicting adult flight ... 59
RESULTS ... 60
Estimating density ... 60
Estimating area of suitable habitat ... 62
Predicting adult flight ... 62
DISCUSSION ... 62
Implications for an imperiled butterfly ... 66
REFERENCES ... 69
TABLES ... 75
FIGURES ... 76
CHAPTER 4 ... 81
Demographic uncertainty, not climate, drives extinction patterns for a rare butterfly, Miami blue ... 81
ABSTRACT ... 81
INTRODUCTION ... 81
METHODS ... 84
Miami blue butterflies ... 84
Butterfly Model ... 86
Climate data ... 88
ix Table 2.1 Differences between Appalachian brown butterflies and St. Francis’ satyrs. ...46 Table 2.2 ANOVA results...46 Table 3.1 Name, length, number of survey points, and estimated habitat area for each
x
Figure 1.1 Survival, recruitment, and population growth rates across treatments ...21
Figure 1.2 Survival of previously established plants and new recruits in mechanically cleared plots and controls ...22
Figure 2.1 Means and standard error of St. Francis’ satyr and Appalachian brown caterpillar survival...47
Figure 2.2 Initial habitat and behavior of butterflies that were first observed in sedge and those first observed in shrubs ...47
Figure 2.3 Population indices measured for St. Francis’ satyr and Appalachian brown ...48
Figure 3.1 Example Miami blue butterfly habitat and survey locations ...76
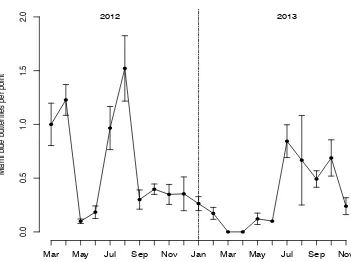
Figure 3.2 Phenology of Miami blue butterfly adults in 2012 and 2013 ...77
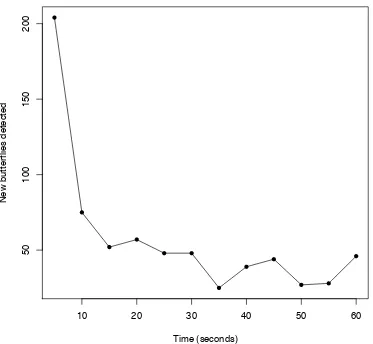
Figure 3.3 The number of new butterflies detected in each five-second interval during a one-minute survey ...78
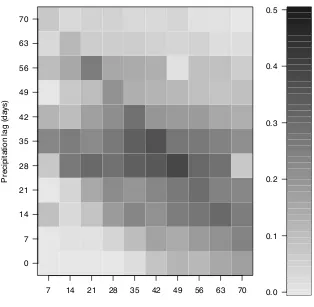
Figure 3.4 Matrix of r2 values for correlations between precipitation and Miami blue butterfly density ...79
Figure 3.5 Relationship between precipitation and butterfly density ...80
Figure 4.1 Model results compared to actual counts from Boca Grande in 2012 and 2013 ... 103
Figure 4.2 Correlations between days between threshold events and time for RCP 4.5 and RCP 8.5 for all 20 climate models in the ensemble ... 104
1 CHAPTER 1
Two surrogates for wildfire, prescribed burning and mechanical clearing, differentially affect demography of a rare, endemic plant
ABSTRACT
Alteration of historic disturbance regimes is one of the biggest threats to species’ persistence. This is particularly true for species adapted to frequent, low-intensity fires. When restoration via prescribed fire is not an option, surrogate methods of clearing vegetation are needed. We use an observational study of fire effects and an experimental study of mechanical clearing to test how restoration techniques affect individual vital rates and population growth rate of a rare, endemic plant Croton linearis. We found that survival rates one-year post-disturbance were similar across mechanical clearing, prescribed fire, and control plots. Two-years post treatment, however, survival in burned plots was much higher than that in either mechanically cleared plots or controls. Both fire and mechanical treatments stimulated a flush of recruitment in the first-year post disturbance but not in the second year, and we saw very little recruitment in control plots in either year. These vital rates combined to produce stable populations two years post treatment in the fire plots and shrinking populations in both mechanically cleared and
2 INTRODUCTION
Fire adapted ecosystems are among the world’s most endangered (Noss et al. 1995). Loss of fire-dependent ecosystems is highest near human development, as people restrict or eliminate fire near their homes, cities, and farms. Loss of natural fire regimes remains a threat even within protected areas. In many cases, this is a legacy of historical management, in which fire was viewed as a neutral or even negative process in maintaining habitat. Without fire, however, succession fundamentally alters the competitive landscape for plants and animals, changing habitat structure and species composition, ultimately leading to extirpation of species adapted to historic fire regimes (Leach & Givnish 1996; Bond & Keeley 2005; Ratajczak et al. 2011).The preferred management strategy in these systems is prescribed fire. However, lighting fires can be difficult due to high costs, narrow prescription windows, and the threat of escape (Miller & Wade 2003). This results in the need for habitat management that replicates the effects of fire such as mechanical understory removal. Mechanical methods mimic the effects of fire on vegetation structure but have different effects on below ground processes and litter dynamics (Moghaddas & Stephens 2007; Youngblood et al. 2008; Stephens et al. 2012); differences that could result in altered population dynamics for fire-adapted species. We test how prescribed fire and a surrogate, mechanical understory removal, affect survival, recruitment, and population growth rates of a rare plant.
3 comparisons focus on community responses or changes in species cover rather than individual vital rates (Perchemlides et al. 2008; Steen et al. 2013a; 2013b). Studies that do focus on vital rates generally only examine the effects of fire and do not compare fire to other management strategies (Liu et al. 2005; Menges 2007, but see Gross et al. 1998). The advantage of focusing on vital rates is that it allows for estimation of population growth rates, and therefore, of the future trajectory of the population. This information is especially important for land managers tasked with the job of ensuring the survival of threatened and endangered plants and animals. Understanding the likely trajectory of a population following a specific management action feeds into the decision-making process. With this information, land managers can consider the full range of costs, benefits, and risks when deciding between different management strategies (van Wilgen 2013).
post-4 fire does not rely on specific environmental cues but is instead a response to the loss of above ground biomass. The goal of mechanical fire surrogates is to replicate the vegetation structure of frequently burned systems by removing standing above ground biomass and reducing canopy cover, thereby increasing the amount of sunlight reaching the ground (Stephens et al. 2009). These methods differ from fires in that they leave a layer of mulch and debris behind, plant material that would be consumed and recycled in a fire (Youngblood et al. 2008). This key difference between mechanical treatments and fires has the potential to interact with species life history, potentially promoting a specific set of adaptations over others. For example, we might expect mechanical treatments to favor sprouters that respond to biomass loss over seeders that rely on heat or chemical cues for germination. If this is the case, we predict mechanical
surrogates and prescribed fires to have similar effects on sprouter vital rates, but very different effects on seeder vital rates. We might also expect these two restoration treatments to
differentially effect animal species through differential effects on key resources such as nesting sites or food. This kind of detailed information about vital rates will allow us to better design fire surrogates to promote target species and potentially predict how different species may respond to a given treatment based on life history traits.
5 implement and mechanical treatments an attractive alternative. Working in an experimental study of mechanical clearing and an observational study of fire effects, we ask: do fire and mechanical clearing result in similar survival and recruitment responses and population growth rates? This research is essential for understanding population level responses of this rare plant to habitat restoration and has implications for restoration of other species, specifically the butterflies that rely on croton.
METHODS Study system
Pine rocklands are found only in south Florida, The Bahamas, and Turks and Caicos where they grow directly out of the limestone substrate. These forests are characterized by open stands of South Florida slash pines (Pinus ellioti var. densa) and an open shrub/palm subcanopy, below which a rich herbaceous community thrives. In south Florida, pine rocklands once
6 Remaining pine rocklands are vulnerable to lack of disturbance and subsequent forest succession, which excludes croton, this is true even within protected areas. Historically, pine rocklands burned frequently, maintaining the forest in an early successional state. Croton is well adapted to fire; based on anecdotal data, it appears to both seed and re-sprout following fires (C. Anderson unpublished data). Without fire, pine rocklands convert to hardwood hammocks, and croton eventually disappears from the ecosystem. Since 1951, croton has gone from being one of the 10 most common plants in pine rocklands on Big Pine Key (Alexander 1972) to covering less than 0.01% of pine rocklands in 2014 (Bradley 2009); this decline has occurred simultaneous with decline in fire across the island.
Fire is the preferred management strategy for maintaining croton and habitat for Bartram’s scrub-hairstreaks and Florida leafwings; however, there exist multiple obstacles to implementing prescribed fire, especially at the wildland-urban interface and in instances where fuels have accumulated to levels that make it unsafe to burn. In these areas, mechanical clearing through mowing, brush hogging, etc. has been proposed as a possible habitat maintenance strategy. This is motivated by anecdotal observations of croton plants sprouting and thriving in newly cleared fire breaks. While these observations are encouraging, evidence-based data are necessary for making informed management decisions.
Mechanical clearing experiment
7 masticating head through the treatment unit. The prescription for the treatment was to clear and mulch the understory vegetation in a mosaic pattern covering 50% of the plot with the goal of mimicking the mosaic burn patterns that might result from a prescribed fire.
Prior to treatments, we tagged all croton plants in 15 subplots in each replicate. To ensure that we tagged croton plants across the replicate, we identified croton sampling plots by
establishing a grid of parallel 50-meter transects spaced 10 meters apart in all treatment units (total of 10 transects). In each unit, we randomly selected five transects and established three, permanent 2.5m-radius subplots on each one, in the middle and each end of each transect. We marked subplots by hammering a 25cm galvanized spike at the subplot center and attached a numbered, metal plant tag to identify the subplot number. In each subplot, we tagged all croton plants by wiring metal plant tags around the base of each plant. If we did not reach our goal of 30 plants tagged in the first five transects, we randomly sampled additional transects until we
reached at least 30 plants. We tagged plants in 5-10 subplots in each unit, depending on croton density.
8 Prescribed fire monitoring
To test the effects of fire on croton demography, we used long-term croton monitoring data that has been collected over the last decade in Everglades National Park. There are four different fires represented in this data set, in 2006, 2007, 2013, and 2016. The 2006, 2007, and 2013 fires occurred in three different fire units within the park, and the 2016 fire burned the same unit as the 2006 fire. In each of these fire units, Everglades National Park monitors fire effects on croton in one 20m X 50m plot. Every croton plant within the monitoring plot was tagged with a metal plant tag and its location within the plot was mapped prior to burning, the number of croton plants in each fire unit ranged from 7-84. Following each fire, plants were re-surveyed monthly and, in three of the four fires, new seedlings were mapped and tagged as they were discovered. Only two of these fire units were monitored two years post-fire, one of which had new recruits that were tagged. To estimate annual survival we compared the croton surveys from the month before each fire to the same month in subsequent years in which data were available. We standardized recruitment as detailed above.
Statistical analyses
All statistical analyses were done in R version 3.3.1 (R Core Team, 2016).
9 Recruitment: We tested for differences in recruitment between the three treatments with a linear model, using our standardized recruitment estimates as the response variable, and post-hoc tests with the TukeyHSD function.
Recruit vs. established plant survival: We compared survival of new recruits to survival of previously established plants in the second year post-treatment in our mechanical experiment only (we did not have these data in our prescribed fire dataset). To do this we used a two-way ANOVA with main effects of age (recruit vs. established) and treatment (mechanical vs. control).
Population growth rate: We calculated count-based population growth rates for the two years following treatments as N(t+1)/N(t). Because we did not have recruitment data for year two post-fire, we assumed there was no additional recruitment in that second year. This was based on our observations of very little (almost no) recruitment following mechanical treatments, and results in the most conservative estimate possible. We then used a linear model and post-hoc Tukey test to test for differences between population growth rates across treatments and years.
RESULTS
We tagged a total of 588 croton plants, 161 in control plots, 292 in fire plots, and 135 in mechanically cleared plots.
10 Recruitment was highest in mechanically cleared plots and was significantly higher in mechanical plots than controls (F2,8=5.85, p=0.027). Recruitment in fire plots was intermediate
between control and mechanical treatments, and not statistically different from either, although it was marginally significantly greater than controls (p=0.075; Figure 1b). Survival of new recruits was not different from survival of already established plants (Wald’s chi-square=0.059, df=1, p=0.81). However, there was a trend in mechanically cleared plots of survival being higher for new recruits (0.85±0.084) than previously established plants (0.77±0.059), and a trend
suggesting that recruit survival was higher in mechanically cleared plots (0.85±0.084) than controls (0.64±0.17). The interaction between plant age and treatment was not significant (Wald’s chi-square=1.12, df=1, p=0.29; Figure 2).
Differences in survival and recruitment across treatments combined to produce differences in population growth rates. There was a significant treatment effect (F2,,18=4.33,
p=0.033), with population growth rate in the fire treatment significantly higher than controls, mechanical treatment fell between the two and was not statistically different from either (Figure 1c). Growth rates were higher in the first year following disturbance than the second (F1,19=8.04,
p=0.013). Mean growth rates were above 1 in both disturbance treatments one year post
treatment, but fell below 1 in mechanically cleared plots two years post-clearing. Fire treatment was the only one in which population growth did not fall below one, and thus was the only treatment that resulted in a stable population.
DISCUSSION
11 of vital rate responses as found after prescribed fire, however, the magnitude of the response differed between treatments. These differences do not yield growing populations in mechanical clearing treatments as are found after prescribed fire. In mechanically cleared plots survival declines quickly to a rate that is similar to controls. It is this vital rate that appears to have the greatest influence on population growth rate. Recruitment is also important to increase
population growth, and thus conditions should be maintained in which croton seeds can readily sprout post disturbance. Because mechanical clearing leads to more recruitment than no action, it is better restoration strategy than doing nothing, but efforts should be made to use fire as a restoration tool when possible.
Like many shrubs in fire-adapted landscapes, croton relies heavily on re-sprouting post disturbance to maintain extant populations. Eighty and seventy percent of croton plants survived and re-sprouted following fires and mechanical clearing, respectively. There are tradeoffs associated with sprouting and seeding, such that plants that invest heavily in below-ground carbohydrate stores for re-sprouting invest less in reproduction (Bond & Keeley 2005). Because of this, sprouters are expected to be good competitors, but poor dispersers (Higgins et al. 2008). Although we documented post-treatment recruitment, it only occurred in plots where croton was present prior to treatment, suggesting that croton seeds do not disperse far from natal patches (as far as we know, croton dispersal is limited to dehiscence, although animals may disperse seeds further). These results highlight the importance of promoting the survival of existing croton patches. Once patches are extirpated, they are unlikely to be re-colonized rapidly.
12 variable (Pfister 1998). Of the two vital rates we measured, survival was half as variable as recruitment (Figure 1), suggesting that survival has higher elasticity. This is yet another line of evidence that highlights the importance of using management strategies that promote survival of existing plants. If this is the goal of management and restoration efforts in these habitats, fire is the best method to accomplish that goal; mechanical clearing did not increase survival above controls in either year post-disturbance. We acknowledge that there are additional vital rates that could have even higher elasticities than recruitment and survival, such as fecundity and seed survival. However, for other plants that resprout at high rates following disturbance, survival and growth of existing plants generally have the highest elasticities (Menges & Quintana-Ascencio 2004; Liu et al. 2005; Altwegg et al. 2014).
Even vital rates with low elasticity contribute to overall population growth rates. Without restoration, croton populations on Big Pine Key are shrinking at a rate of 20-30% per year. Mechanical clearing abated this trend as it was followed by a flush of recruitment (Figure 1b). These new recruits had slightly higher survival than established plants in both cleared and control plots (Figure 2). If this trend continues, these new recruits could have a positive impact on long term population persistence (Pascarella & Horvitz 1998). Since there was no recruitment and low overall survival in control plots in both years, mechanical clearing, while not as
effective a restoration tool as prescribed fire, is better than no restoration at all.
Regardless of life-history strategy, too frequent and too long of a disturbance return interval leads to declining populations of disturbance-adapted species (Altwegg et al. 2014). To understand the optimal disturbance return interval, we would ideally estimate all vital rates in populations at different years post-disturbance and then simulate the effects of varying
13 Quintana-Ascencio 2004; Liu et al. 2005; Menges et al. 2006). For croton, this will require more information than we currently have. One of the mechanisms through which altered disturbance return intervals affect populations is by altering the variability of vital rates between disturbance phases (Morris et al. 2006). For example, for many disturbance-adapted species, including croton, the variability of recruitment between disturbance phases is high, with high recruitment immediately following disturbance and almost no recruitment between disturbances (Figure 1B). If disturbance frequency was to increase, it is possible that post-disturbance recruitment would decrease, due to insufficient time for mature plants to replenish the seedbank. This would in effect decrease the between-phase variability of this vital rate, and negatively affect the long-term population growth rate. On the other end of the disturbance frequency spectrum, long return intervals allow succession to reduce the survival of fire adapted plants by increasing vegetation structure and therefore competition for light. Based on the population declines we measured in our control plots on Big Pine Key that have not burned in 15 years, we can infer that a 15 year disturbance return interval is too long to maintain growing croton populations. In addition to increasing competition, long fire return intervals increase the threat of catastrophic wildfires. Unlike the frequent, low intensity fires that native species are adapted to, these catastrophic fires are generally much hotter and may result in population declines or even extinction. Hot fires can kill seeds in the seedbank and consume below ground resource stores thus limiting the
14 We measured a plant’s response to two different types of disturbance-based management, but the question remains: what happens when disturbances interact? Mechanical clearing has been proposed as a pre-fire treatment in this system to reduce vertical fuels and therefore the risk of prescribed fire escape. What we do not yet understand is how this would affect the responses that we measured. Given that we saw very little recruitment in the second year following both disturbance treatments, we might hypothesize that the two disturbances in sequence act antagonistically, with the first disturbance, mechanical clearing, stimulating germination and thus depleting the seed bank such that there are few seeds left to germinate following the second disturbance, prescribed fire. Additionally, mechanical clearing is likely to alter fire behavior since it concentrates fuels on the ground, thus increasing ground fire temperature and duration. This could have the unintended consequence of killing seeds present in the seedbank (Busse et al. 2005) or burning up the underground resource stores necessary for re-sprouting post-fire. In this case, the two responses again act antagonistically by reducing recruitment and/or survival. Conversely, if the prescribed fires occurred before seeds germinate, they could act synergistically with the mechanical clearing, further enhancing germination rates by increasing the amount of bare ground and providing additional chemical cues that may be necessary to stimulate
germination.
Understanding how interacting disturbances affect vital rates is necessary to predict how communities will be shaped in the future. This is true both in the management context described above, and in the context of climate change. Systems like the pine savannahs in the SE US are subject to fire disturbances as well as hurricanes, both of which are projected to shift in
15 Beckage et al. (2006) used simple Lotka-Volterra competition models to demonstrate that the return intervals of both fires and hurricanes interact to maintain pine savannas, and alteration of either return interval has the ability to shift the system to an alternative state; more frequent disturbance of either kind leads to grassland, and less frequent disturbance to closed canopy forest. This model predicts that these disturbances act synergistically to accelerate habitat shifts over time, but this has yet to be tested empirically. As global change accelerates, it is more likely that disturbance events simultaneously shift in their intensity and frequency, increasing the probability of interactions between multiple disturbances.
16 REFERENCES
Alexander TR, Dickson JH III. 1970. Vegetational changes in the National Key Deer Refuge-II. Quarterly Journal of the Florida Academy of Sciences 32(2):81-89.
Altwegg R, De Klerk HM, Midgley GF. 2014. Fire-mediated disruptive selection can explain the reseeder–resprouter dichotomy in Mediterranean-type vegetation. Oecologia 177:367–377. Springer Berlin Heidelberg.
Beckage B, Gross LJ, Platt WJ. 2006. Modelling responses of pine savannas to climate change and large-scale disturbance. Applied Vegetation Science 9:75.
Bond W, Keeley J. 2005. Fire as a global “herbivore”: the ecology and evolution of flammable ecosystems. Trends in Ecology and Evolution 20:387–394. Elsevier Current Trends.
Bond WJ, Midgley JJ. 2001. Ecology of sprouting in woody plants: the persistence niche. Trends in Ecology and Evolution 16:45–51. Elsevier Current Trends.
Bradley KA, Saha S. 2009. Post-hurricane responses of rare plant species and vegetation of pine rocklands in the lower Florida Keys. Final report submitted to the U.S. Fish and Wildlife Service by The Institute for Regional Conservation.
Buckley LB, Urban MC, Angilletta MJ, Crozier LG, Rissler LJ, Sears MW. 2010. Can
mechanism inform species’ distribution models? Ecology Letters 13:1041–1054. Blackwell Publishing Ltd.
17 Gilman SE, Urban MC, Tewksbury J, Gilchrist GW, Holt RD. 2010. A framework for
community interactions under climate change. Trends in Ecology and Evolution 25:325–331. Elsevier Current Trends.
Gross K, Lockwood JR III, Frost CC, Morris WF. 1998. Modeling controlled burning and trampling reduction for conservation of Hudsonia montana. Conservation Biology.
Higgins SI, Flores O, Schurr FM. 2008. Costs of persistence and the spread of competing seeders and sprouters. Journal of Ecology 96:679–686.
Keeley JE. 1977. Seed Production, Seed Populations in Soil, and Seedling Production After Fire for Two Congeneric Pairs of Sprouting and Nonsprouting Chaparal Shrubs. Ecology 58:820– 829. Ecological Society of America.
Keeley JE, Pausas JG, Rundel PW, Bond WJ, Bradstock RA. 2011. Fire as an evolutionary pressure shaping plant traits. Trends in Plant Science 16:406–411. Elsevier Current Trends. Leach MK, Givnish TJ. 1996. Ecological Determinants of Species Loss in Remnant Prairies.
Science 273:1555–1558.
Liu H, Menges ES, Quintana-Ascencio PF. 2005. Population viability analyses of Chamaecrista keyensis: effects of fire season and frequency. Ecological Applications 15:210–221.
Ecological Society of America.
Menges ES. 2007. Integrating demography and fire management: an example from Florida scrub. Australian Journal of Botany 55:261–272. CSIRO PUBLISHING.
18 Menges ES, Quintana-Ascencio PF, Weekley CW, Gaoue OG. 2006. Population viability
analysis and fire return intervals for an endemic Florida scrub mint. Biological Conservation 127:115–127.
Miller SR, Wade D. 2003. Re-introducing fire at the urban/wild-land interface: planning for success. Forestry: An International Journal of Forest Research 76:253–260. Oxford University Press.
Moghaddas EEY, Stephens SL. 2007. Thinning, burning, and thin-burn fuel treatment effects on soil properties in a Sierra Nevada mixed-conifer forest. Forest Ecology and Management 250:156–166. Elsevier.
Moreno JM, Oechel WC. 1993. Demography of Adenostoma fasciculatum after fires of different intensities in southern California chaparral. Oecologia 96:95–101. Springer-Verlag.
Morris WF, Tuljapurkar S, Haridas CV, Menges ES, Horvitz CC, Pfister CA. 2006. Sensitivity of the population growth rate to demographic variability within and between phases of the disturbance cycle. Ecology Letters 9:1331–1341. Blackwell Publishing Ltd.
Noss RF, LaRoe ET III, Scott JM. 1995. Endangered Ecosystems of the United States: A preliminary assessment of loss and degradation. 28. Washington, DC.
Odion DC, Davis FW. 2000. Fire, soil heating, and the formation of vegetation patterns in chaparral. Ecological Monographs 70:149–169. Ecological Society of America. Pascarella JB, Horvitz CC. 1998. Hurricane distrubance and the population dynamics of a
tropical understory shrub: megamatix elasticity analysis. Ecology 79:547–563. Ecological Society of America.
19 Perchemlides KA, Muir PS, Hosten PE. 2008. Responses of Chaparral and Oak Woodland Plant
Communities to Fuel-Reduction Thinning in Southwestern Oregon. Rangeland Ecology and Management 61:98–109.
Pfister CA. 1998. Patterns of variance in stage-structured populations: Evolutionary predictions and ecological implications. Proceedings of the National Academy of Sciences 95:213–218. National Acad Sciences.
R Core Team. 2016. R: A language and environment for statistical computing. R Foundation for Statistical Computing, Vienna, Austria. URL https://www.R-project.org/.
Ratajczak Z, Nippert JB, Hartman JC, Ocheltree TW. 2011. Positive feedbacks amplify rates of woody encroachment in mesic tallgrass prairie. Ecosphere 2:1–14. Ecological Society of America.
Steen DA, Conner LM, Smith LL, Provencher L, Hiers JK, Pokswinski S, Helms BS, Guyer C. 2013a. Bird assemblage response to restoration of fire-suppressed longleaf pine sandhills. Ecological Applications 23:134–147. Ecological Society of America.
Steen DA, Smith LL, Conner LM, Litt AR, Provencher L, Hiers JK, Pokswinski S, Guyer C. 2013b. Reptile assemblage response to restoration of fire-suppressed longleaf pine sandhills. Ecological Applications 23:148–158. Ecological Society of America.
Stephens SL et al. 2009. Fire treatment effects on vegetation structure, fuels, and potential fire severity in western U.S. forests. Ecological Applications 19:305–320. Ecological Society of America.
20 van Wilgen BW. 2013. Fire management in species-rich Cape fynbos shrublands. Frontiers in
Ecology and the Environment 11:e35–e44. Ecological Society of America.
21 FIGURES
Figure 1.1. Survival, recruitment, and population growth rates across treatments. A) Proportional survival following fire (dotted line), mechanical clearing (dashed line), and no treatment control (solid line). B) Standardized recruitment and C) population growth rates in year one (black bars) and year two (grey bars) post-treatment. Error bars are standard error in all panels. Population growth rates >1 indicate growing population.
0.6 0.7 0.8 0.9 1.0 1 2
YR post−disturbance
Sur
viv
al
Control Fire Mech
A
0.0 0.2 0.4 0.6
Control Fire Mech
Recruitment
Year 1 2
B
0.0 0.5 1.0
Control Fire Mech
P
opulation gr
o
wth rate
Year 1 2
22 Figure 1.2. Survival of previously established plants and new recruits in mechanically cleared plots (dotted line) and controls (solid line), error bars are standard error.
0.5 0.6 0.7 0.8 0.9
Established Plants New Recruits
Sur
viv
al
23 CHAPTER 2
Are substitute species the white whale of endangered species conservation?
ABSTRACT
The use of substitute species is widespread and continues in the face of broad criticism. We addressed many of the criticisms of substitute species by selecting a substitute that is closely related to, overlaps in distribution, habitat, and host use with, and exhibits similar life history to the target endangered species. We used this endangered-substitute pair to test the validity of the substitute species concept in a habitat restoration experiment. In our test, we integrated fine-scale measures of behavior, habitat preference, and demography and found that the common species was not a good substitute for answering questions related to local scale movement and
demography. Despite nearly identical habitat preferences, differences in caterpillar host use and behavior translated to differences in caterpillar survival, adult behavior, and population size across restoration treatments. Our small-scale manipulations of the endangered species led to important natural history discoveries that improve our ability to design conservation strategies. We have demonstrated that fine-scale differences between two species cause the substitute relationship to fail, highlighting that management decisions based on invalidated substitute species run the risk of doing more harm than good for endangered species conservation.
INTRODUCTION
24 species conservation (Caro 2007). Because of restrictions on manipulation of endangered
species, scientists and practitioners are often forced to evaluate the effectiveness of conservation strategies with a common, non-target species instead of with the endangered species itself. This type of surrogate is commonly referred to as a substitute (Caro et al. 2005). The great risk associated with this strategy is that if substitute species do not respond to conservation actions in the same way the target endangered species responds, they provide false insight into the effects of conservation actions (eg. Murphy et al. 2011). In this paper, we empirically test the suitability of using substitute species in a conservation context.
Reviews on surrogate species generally conclude that ecological processes should
determine selection of a surrogate, not simply species co-occurrence (Henle et al. 2004; Roberge & Angelstam 2004; Caro 2007; Seddon & Leech 2008). For substitute species selection, the ecological processes most important to consider are behavior (Caro 2007) and demography (Caro et al. 2005). These two ecological processes allow assessment of how conservation actions affect both population growth rates and landscape connectivity.
25 use the same habitat type for dispersal (Breckheimer et al. 2014). It follows that to be a good behavioral substitute species, a species must be closely related to, occupy the same landscape as, and overlap in dispersal habitat with the target species.
Understanding the demographic response of a target organism to disturbances or management actions is fundamental to sensitivity analyses, population viability analyses, and other common tools used to develop and compare the effects of different conservation strategies (Morris & Doak 2002; Mills 2013). When using a substitute species to assess disturbance effects on rare species, or to parameterize population models, demographic responses of the two species must be similar. Studies on the effects of environmental contaminants on anadromous fish and parasitic wasps have found that substitute species can be useful to predict mortality rates, but sub-lethal demographic responses are more nuanced (Stark et al. 2004; Banks et al. 2010). Demographic responses of organisms to disturbance are affected both by the effect of the disturbance on particular life histories and by the effects of vital rates on population level response (Hartway & Mills 2012). Therefore, to exhibit similar demographic responses, substitute and target species must have similar life histories and also similar vulnerabilities to disturbance (Stark et al. 2004; Murphy et al. 2011; Banks et al. 2014). Demography, like
26 We address what has been a key limitation in use of substitute species, the subtle
differences in movement and demography that are often undetectable or unknown without detailed investigation. Correlational approaches that identify surrogate species based on co-occurrence may miss important mechanisms that drive co-co-occurrence patterns. Experiments provide the most direct approach to identify causal factors that make two species more or less similar. Experimental restoration action provides the “acid test” (Bradshaw 1987) of assessment of the substitute species concept. In this paper, focus on the mechanisms of movement and demographic responses of target and substitute species in response to conservation action (Schultz & Crone 1998; Haddad & Baum 1999).
The question remains: how broadly can one species substitute for another, if at all? We use a habitat restoration experiment to test the validity of the substitute species concept using an endangered-substitute pair of butterflies. In our test, we focus on integrating fine-scale measures of behavior, habitat preference, and demography to assess whether a common species can, in fact, be a good substitute for a rare species. We ask whether using a species that is closely related to, overlaps in distribution and host use with, and exhibits similar life history to the target
species, is sufficient for identifying a valid substitute species.
METHODS
Study Species and Site
St. Francis’ satyr (Neonympha mitchellii francisci) is an endangered butterfly found in sedge-dominated wetlands. The global distribution of the species is confined to Fort Bragg Army Installation in North Carolina. Historically, these open, sedge-dominated wetlands were
27 and beaver populations were nearly extirpated from the southeast, and with them the habitat on which St. Francis’ satyrs depend. Today, the largest St. Francis’ satyr populations are found in the artillery impact areas at Ft. Bragg. In the impact areas, live fire military training ignites fires that burn across the landscape and beaver activity is not curtailed by humans. The resulting riparian areas are open and free of thick, shrubby vegetation.
Appalachian brown butterflies (Satyrodes appalachia) are a member of the same
subfamily Satyrinae, as St. Francis’ satyrs. They range across eastern North America from north Florida to southern Canada, and as far west as Minnesota. In eastern North Carolina, however, Appalachian browns are largely restricted to Ft. Bragg. At Ft. Bragg, they inhabit wetlands and have strong overlap in their habitat use with St. Francis’ satyr. Both butterfly species feed on sedges as caterpillars, and overlap in use of Carex mitchelliana (a plant that is located at all habitat patches occupied by both species). Additional hosts are possible but as yet unknown. Both species have two to three generations per year (likely dependent on spring temperatures (Wepprich 2017)), overwintering as early instar caterpillars.
28 whether Appalachian brown is a good surrogate for demography, especially in response to
habitat restoration, which is what we examined here.
To test the effects of habitat restoration on the demography of St. Francis’ satyr, we took advantage of an existing habitat restoration experiment (Aschehoug et al. 2015). In 2011, we delineated four blocks of four 30m X 30m plots, placing each block within 250m of a historic St. Francis’ satyr population. To mimic the disturbance created by beavers, each plot was randomly assigned one of the following four treatments: tree removal, installation of temporary dams, both tree removal and dam installation, and a no treatment control (see Aschehoug et al. 2015 for additional details). Damming treatments did not affect total sedge cover, but tree removal increased total sedge cover four-fold (Aschehoug et al. 2015). For the purposes of the current study, we pooled data from all tree removal plots and refer to them as restoration plots, and we pooled data from plots with no tree removal which we refer to as controls. Succession happens quickly in these environments. Therefore, each spring we remove encroaching hardwoods from restoration plots by hand in an attempt to maintain the open habitat structure required by the butterflies. From 2012 to 2015 we released captive-reared St. Francis’ satyr adults into one experimental block. This combination of restoration and re-introduction has resulted in the largest St. Francis’ satyr population outside of the artillery impact area (617 butterflies in 2015).
Caterpillar host use and survival
29 (Aschehoug et al. 2015). Arenas were installed in 2012 around naturally occurring C.
mitchelliana. When preparing arenas in 2016, we chose those that still contained C. mitchelliana so we would not need to supplement larval diets. Because our federal permit limited us to a small number of caterpillars, we only measured caterpillar survival in the control and tree removal + dam treatments in two blocks of the original restoration experiment, releasing caterpillars into two arenas per plot for a total of 8 arenas. We released 6-7 first instar caterpillars into each arena over two days. One arena in each treatment was invaded by ants after the first day, so no
additional caterpillars were released into them and they were dropped from the experiment. We left arenas open to predation and counted caterpillars daily. Once we observed pupae, we enclosed the arenas with mosquito netting. We continued to visit arenas daily, recording and releasing all adults that emerged. By releasing St. Francis’ satyr caterpillars into arenas, we observed larval feeding and host choice in the wild for the first time. In addition to counting caterpillars daily, we recorded the species of sedge on which each caterpillar was feeding.
We tested whether larval survival differed among treatments between St. Francis’ satyr and Appalachian Brown (data from control and tree removal + dam treatments in Aschehoug et al. 2015). To do this, we used a generalized linear model with a binomial response variable, including a species*treatment interaction main effect. We conducted this analysis using the glm function of the lme4 package, and Anova function of the car package in R.
Caterpillar behavior
30 screened captive rearing enclosures. We measured the height above soil level for 20 caterpillars of each species twice a week for four weeks. These experiments were done in a greenhouse at Ft. Bragg which is programed to replicate outside environmental conditions. To test for differences in foraging height, we used a two-way ANOVA with a species*date interaction term to account for differences in foraging as caterpillars develop. Foraging heights were square-root
transformed to meet ANOVA assumptions.
Caterpillar microhabitat
We measured sedge canopy above captive St. Francis’ satyr and Appalachian brown caterpillars as a measure of how likely a caterpillar is to be shaded by sedges. We did this by dropping a pin through the sedges to the location of each caterpillar and counting the number of sedge blades that contacted the pin. As with height data, we collected sedge canopy on 20 caterpillars of each species twice a week for four weeks. To compare sedge canopy above the two species, we totaled the number of individuals counted with zero, one, two, three, and four hits above them on the pin for each species across all eight surveys. We used a chi-square test to assess differences between sedge canopy cover above St. Francis’ satyrs and Appalachian browns.
Adult locations
31 canopy cover by attaching a GoPro camera to a 2m long pole and taking a photo of the canopy from 1m above each flag. We analyzed photos by converting each image to a two-tone black and white image. In converted images, vegetation becomes black pixels and sky becomes white. We calculated canopy cover as the percentage of pixels in each image that were black. All photo analyses were done using ImageJ. We visually estimated total sedge cover and C. mitchelliana cover in the following bins: 0-5%, 6-25%, 26-50%, 51-75%, 76-95%, 96-100%. We also visually estimated distance to the structural boundary of each treatment to the nearest meter. For tree removal plots, we measured the distance between the observation and the edge of the tree
removal area. In control plots, we measured the distance between the observation and the edge of riparian vegetation. We used two-way ANOVAs to compare each environmental variable
between the two species and the two treatments using the lm function in R. We interpreted a non-significant species*treatment interaction to indicate that butterflies select similar habitat
regardless of plot-type. Prior to analysis, proportion canopy cover was squared and the proportions of C. mitchelliana and total sedge cover were arcsine square-root transformed to meet the assumptions of ANOVA.
Adult behavior
32 and sedge-dominated with little to no canopy; 2) Shrub: shrubs and vines; and 3) Forest:
dominated by closed canopy of trees with little undergrowth. To evaluate differences in habitat use and movement between St. Francis’ satyrs and Appalachian browns we conducted chi-square tests using the chisq.test function in R. For habitat use, we compared the habitat types at initial locations of each butterfly species. For movement, we compared the final habitat in which butterflies were observed given they were initially detected in the same habitat. Because very few butterflies were observed moving into forest habitat we simulated p-values with the simulate.p.value option using 1000 iterations.
Index of Population Size
33 because the total Pollard-Yates index at our reintroduction site was nearly identical for the two species. To compare population sizes across plot-type we conducted a chi-square test using chisq.test function in R.
RESULTS
Caterpillar host use and survival
We released a total of 37 St. Francis’ satyr caterpillars into field arenas, 10 of which successfully survived to become adult butterflies (21% survival). This is considerably higher than the 4.2% survival we expected based on our estimates of egg laying and survival rates in the greenhouse.
Small, green caterpillars are difficult to find within field arenas. However, we were able to find some caterpillars each day. In the four arenas that contained multiple sedges, 67 ± 27% of
the St. Francis’ satyr caterpillars fed on C. atlantica, until they were fourth instars, at which point 100% of caterpillars fed on C. mitchelliana. The remaining 33% of St. Francis’ satyr caterpillars fed on C. mitchelliana as early instars. We did not release Appalachian brown caterpillars into arenas as part of this project so we do not have data on their host preferences. However, in prior experiments in these same arenas (Aschehoug et al. 2015), we never observed Appalachian browns feeding on C. atlantica. Occasionally they will feed on grass species when grass is abundant within arenas, but C. mitchelliana is by far the preferred host of Appalachian browns.
34 sample sizes for St. Francis’ satyr indicates a trend toward differential survival between
Appalachian browns and St. Francis’ satyrs across treatments (Figure 1).
Caterpillar behavior
Appalachian brown caterpillars foraged at heights twice as great as St. Francis’ satyrs
(F1,353=149.3, p<0.0001); Appalachian browns foraged at 12.6 ± 5.2 cm off the soil and St.
Francis’ satyrs at 6.5 ± 3.7 cm. This difference was consistent across caterpillar development, the
species*date interaction was not significant (F8,346=0.25, p=0.98).
Caterpillar microhabitat
Appalachian brown and St. Francis’ satyr caterpillars forage under different levels of
canopy cover (c2=134.87, df=4, p <0.0001). Fifty-eight percent of Appalachian brown
caterpillars are found with no sedge cover above them, only 4% and 1% are found under 3 and 4 sedge blades, respectively. Just over half of St. Francis’ satyrs, were found under the shelter of 3 or 4 sedge blades, and only 10% forage in the open with no cover.
Adult locations
We marked the location of a total of 148 St. Francis’ satyr and 135 Appalachian brown adults. Canopy cover was the only variable that differed between the two species (F1,301 =114.3,
p<0.0001; Table 2). Appalachian brown butterflies were found under an average of 70 ± 12%
35 different between the two species and none of the species*treatment interaction terms were significant.
Adult behavior
We recorded the flight behavior of 230 St. Francis’ satyrs and 370 Appalachian browns.
The two species differed in initial habitat preference (c2=93.94, df=2, p<0.0001; Figure 2a), and
probability of changing habitat, regardless of initial habitat (starting in sedge:c2=8.88, p=0.005;
starting in shrub:c2=7.01, p=0.03; Figure 2b, c). Eighty-four percent of St. Francis’ satyrs were
first observed in sedge; 58% of these stayed in sedge and 26% flew into shrubs. Very few St. Francis’ satyrs were observed in forest habitat type. Appalachian browns were almost equally likely to be found in sedge and shrub and 15% of the butterflies were found in forest habitat type. Appalachian brown butterflies stayed within the habitat in which they were initially observed; only 17% changed habitat.
Index of population size
We counted a total of 215 St. Francis’ satyrs and 305 Appalachian browns in the second flight period of 2015. These numbers translate to total population indices of 34 and 54. The St. Francis’ satyr population was two times larger than the Appalachian brown population in restoration plots and Appalachian brown population size was five times higher than St. Francis’
36 DISCUSSION
By focusing on measures of habitat preference, behavior, and demography, we have demonstrated that even two species that are nearly identical in broad and specific ways (e.g same subfamily, overlapping habitat, overlapping host use, same life history, same phenology) are not good surrogates for answering most local-scale questions in ecology and restoration. Fine scale differences in resource use translated into differences in habitat selection, behavior, and survival, the combination of which resulted in differences in population size following restoration.
Because of this, it may be necessary to conduct limited experiments with the target species directly. In cases where a surrogate must be used, it is important to select a surrogate based on fine-scale similarities that relate directly to the action at hand.
We chose our substitute species based on the essential requirement that substitute and target species overlap in habitat requirements. We found that although this was true at broad scales, it was not true at local scales which are of greatest importance in restoration. We have regularly found Appalachian brown caterpillars feeding on C. mitchelliana, but have found only two St. Francis’ satyr caterpillars in the wild. By releasing St. Francis’ satyr caterpillars into arenas in the field, we learned that, unlike Appalachian browns that forage on C. mitchelliana throughout development, early instar St. Francis’ satyrs prefer to feed on C. atlantica before switching to C. mitchelliana. This difference in host use likely drives other local-scale
37 driven by a preference for staying close to host plants, further reinforcing the importance of understanding the fine-scale resource needs of both substitute and target species.
The substitute species we tested had previously been shown to be a good substitute for landscape connectivity questions (Hudgens et al. 2012); however, we found that habitat selection and movement patterns differed between the two species at the local, within-patch scale. St. Francis’ satyrs were more likely to initially be found in open sedge than Appalachian browns (Figure 2). Appalachian browns were more likely to stay in their initial habitat, suggesting that they view both sedge and shrub as “habitat”. St. Francis’ satyrs, on the other hand, were biased to stay in sedge but did cross structural habitat boundaries from open sedge to shrub at a high rate (0.44). Like St. Francis’ satyr’s preference for open canopy, this movement preference is likely related to the distribution of C. atlantica within the wetlands. Butterflies are known to exhibit biases toward host plants and avoid crossing structural boundaries (Schultz 1998; Kuefler & Haddad 2006; Schultz et al. 2012). Biases ultimately affect the rate at which butterflies move through the landscape, or their diffusion rates, measured as net displacement over time. These fine-scale differences in movement are important to understand in the context of restoration planning (eg. Schultz 1998). If the goal is to restore habitat patches that are likely to be naturally colonized by St. Francis’ satyrs, a sedge dominated corridor may facilitate the movement of these butterflies between sites (Haddad 1999a; 1999b).
38 behavior expose them to different microclimates and different levels of direct solar radiation (Turlure et al. 2010; 2011), especially in restoration plots where the tree canopy has been removed and air temperatures are 3-5 degrees C warmer than control plots (unpublished data). By foraging at the end of the sedge blades, Appalachian browns are exposed to direct solar radiation which increases caterpillar body temperature above air temperature (Casey 1976; Turlure et al. 2011). Higher air temperatures and increased exposure to direct solar radiation in restoration plots leads to a higher risk of desiccation and death for Appalachian brown
caterpillars than St. Francis’ satyrs (Turlure et al. 2010). In fact, we found multiple first instar Appalachian brown caterpillars desiccated at the end of sedge blades in our caterpillar arenas in restoration sites, but never in control sites (EH personal observation). These subtle behavioral differences provide a possible mechanism to explain the differences in caterpillar survival that we measured between species across treatment type.
39 from solar radiation even though they forage at the exposed ends of sedge blades. Because
caterpillar survival is slightly higher in control than in restoration plots and adult butterflies prefer shaded locations, population size is highest in control as opposed to restoration treatments. Although these two butterfly species are very similar, both adult and larval life stages are
adapted to different microclimatic conditions within the wetlands in which they overlap. Therefore, restoration actions that promote the conditions necessary for one species do not necessarily result in growing populations of both species.
The “hands off” approach of avoiding collecting data on the endangered species directly is prevalent in endangered species conservation, especially for species that are very rare and poorly understood. These are the exact species for which well planned, targeted experiments within the context of ongoing conservation efforts have the ability to provide insights necessary to develop effective conservation strategies. Even small-scale manipulations of the target species, like those we have reported, can lead to important natural history discoveries that improve the ability to design effective conservation strategies. For example, by conducting targeted experiments with St. Francis’ satyrs, we learned what caterpillars are actually eating in the wild and how caterpillar behavior may promote survival. Had we relied only on data
40 conservation actions in an experimental context, we, as a conservation community, could
improve and better target our efforts in the future.
We have demonstrated that fine-scale differences between two species cause the
41 REFERENCES
Aschehoug ET, Sivakoff FS, Cayton HL, Morris WF, Haddad NM. 2015. Habitat restoration affects immature stages of a wetland butterfly through indirect effects on predation. Ecology 96:1761–1767.
Banks JE, Ackleh AS, Stark JD. 2010. The use of surrogate species in risk assessment: using life history data to safeguard against false negatives. Risk Analysis 30:175–182.
Banks JE, Stark JD, Vargas RI, Ackleh AS. 2014. Deconstructing the surrogate species concept: a life history approach to the protection of ecosystem services. Ecological Applications 24:770–778.
Bradshaw AD. 1987. Restoration: An acid test for ecology. in W. R. Jordan, M. E. Gilpin, and J. P. Aber, editors. Restoration Ecology A Synthetic Approach for Ecological Research. Cambridge, UK
Breckheimer I, Haddad NM, Morris WF, Trainor AM, Fields WR, Jobe RT, Hudgens BR, Moody A, Walters JR. 2014. Defining and evaluating the umbrella species concept for conserving and restoring landscape connectivity. Conservation Biology 28:1584–1593. Brown LM, Crone EE. 2016. Individual variation changes dispersal distance and area
requirements of a checkerspot butterfly. Ecology 97:106–115.
Caro T. 2007. Behavior and conservation: a bridge too far? Trends in Ecology and Evolution. Caro T, Eadie J, Sih A. 2005. Use of substitute species in conservation biology. Conservation
Biology 19:1821–1826.
42 Cushman SA, McKelvey KS, Noon BR, McGarigal K. 2010. Use of abundance of one species as
a surrogate for abundance of others. Conservation Biology 24:830–840.
Fric Z, Hula V, Klimova M, Zimmermann K, Konvicka M. 2010. Dispersal of four fritillary butterflies within identical landscape. Ecological Research 25:543–552.
Haddad. 1999a. Corridor use predicted from behaviors at habitat boundaries. The American Naturalist 153:215-227.
Haddad NM. 1999b. Corridor and distance effects on inter patch movements: A landscape experiment with butterflies. Ecological Applications 9:612–622.
Haddad NM, Baum KA. 1999. An experimental test of corridor effects on butterfly densities. Ecological Applications 9:623–633.
Haddad NM, Hudgens B, Damiani C, Gross K, Kuefler D, Pollock K. 2008. Determining optimal population monitoring for rare butterflies. Conservation Biology 22:929–940. Hartway C, Mills LS. 2012. A meta-analysis of the effects of common management actions on
the nest success of North American birds. Conservation Biology 26:657–666.
Henle K, Davies KF, Kleyer M, Margules C, Settele J. 2004. Predictors of species sensitivity to fragmentation. Biodiversity and Conservation 13:207–251.
Hernández-Camacho CJ, Bakker VJ, Aurioles-Gamboa D, Laake J, Gerber LR. 2015. The use of surrogate data in demographic population viability analysis: A case study of California sea lions. PloS one 10:e0139158.
43 Johnson HE, Mills LS, Stephenson TR, Wehausen JD. 2010. Population-specific vital rate
contributions influence management of an endangered ungulate. Ecological Applications 20:1753–1765.
Kuefler D, Haddad NM. 2006. Local versus landscape determinants of butterfly movement behaviors. Ecography 29:549–560.
Kuefler D, Haddad NM, Hall S, Hudgens B, Bartel B, Hoffman E. 2008. Distribution, population structure and habitat use of the endangered Saint Francis' satyr butterfly, Neonympha
mitchellii francisci. The American Midland Naturalist 159:298–320.
Landres PB, Verner J, Thomas JW. 1988. Ecological uses of vertebrate indicator species: A critique. Conservation Biology 2:316–328.
Lindenmayer DB, Likens GE. 2011. Direct measurement versus surrogate indicator species for evaluating environmental change and biodiversity loss. Ecosystems 14:47–59.
Lindenmayer DB, Manning AD, Smith PL, Possingham HP, Fischer J, Oliver I, McCarthy MA. 2002. The focal-species approach and landscape restoration: a critique. Conservation Biology 16:338–345.
MacArthur RH. 1958. Population ecology of some warblers of northeastern coniferous forests. Ecology 39:599–619.
Mills LS. 2013. Conservation of wildlife populations: demography, genetics, and management, 2nd edition. Wiley-Blackwell, Hoboken, NJ.
44 Murphy DD, Weiland PS, Cummins KW. 2011. A critical assessment of the use of surrogate
species in conservation planning in the Sacramento-San Joaquin Delta, California (U.S.A.). Conservation Biology 25:873–878.
Pollard E, Yates TJ. 1993. Monitoring butterflies for ecology and conservation. Chapman and Hall, London.
Roberge JM, Angelstam P. 2004. Usefulness of the umbrella species concept as a conservation tool. Conservation Biology 18:76–85.
Schultz C, Crone E. 1998. Burning prairie to restore butterfly habitat: a modeling approach to management tradeoffs for the Fender's blue. Restoration Ecology 6:244–252.
Schultz CB. 1998. Dispersal Behavior and Its Implications for Reserve Design in a Rare Oregon Butterfly. Conservation Biology 12:284–292.
Schultz CB, Franco AMA, Crone EE. 2012. Response of butterflies to structural and resource boundaries. Journal of Animal Ecology 81:724–734.
Seddon PJ, Leech T. 2008. Conservation short cut, or long and winding road? A critique of umbrella species criteria. Oryx 42:34–245.
Stark JD, Banks JE, Vargas R. 2004. How risky is risk assessment: The role that life history strategies play in susceptibility of species to stress. Proceedings of the National Academy of Sciences 101:732–736.
Stevens VM, Pavoine S, Baguette M. 2010. Variation within and between closely related species uncovers high intra-specific variability in dispersal. PloS one 5:e11123.
45 Turlure C, Radchuk V, Baguette M, Van Dyck H, Schtickzelle N. 2011. On the significance of
structural vegetation elements for caterpillar thermoregulation in two peat bog butterflies: Boloria eunomia and B. aquilonaris. Journal of Thermal Biology 36:173–180.
Wahlberg N, Moilanen A, Hanski I. 1996. Predicting the occurrence of endangered species in fragmented landscapes. Science 273:1536-1538.
46 TABLES
Table 2.1:
Trait St. Francis’ Satyr Appalachian brown
Caterpillar
Host plant C. atlantica/C. mitchelliana C. mitchelliana
Microhabitat Under cover Exposed
Height on plant 6cm 12cm
Survival Highest in tree removal Highest in control
Adult
Microhabitat Sun Shade
Movement Prefers open sedge Equally likely in sedge and shrub Population Size Highest in restoration Highest in control
Table 2.2. ANOVA results. SFS refers to St. Francis’ satyr; ABB refers to Appalachian brown. Bolded values are statistically significant at p<0.05
Response
variable Mean (SD) Species Treatment Sp X Treat
SFS ABB f-value p-value f-value p-value f-value p-value
Canopy 0.30(0.17) 0.49(0.15) 114.3 <0.0001 54.3 <0.0001 3.1 0.8
Sedge 0.36(0.31) 0.30(0.23) 3.43 0.065 0.21 0.651 2.44 0.12
Mitch 0.27(0.28) 0.23(0.27) 1.72 0.19 6.3 0.013 0.4 0.53
47 FIGURES
Figure 2.1. Means and standard error of St. Francis satyr (SFS) and Appalachian brown (ABB) caterpillar survival.
Figure 2.2. Initial habitat (a) and behavior of butterflies that were first observed in sedge (b) and those first observed in shrubs (c). X-axis labels indicate habitat in which butterflies were first observed (a) or habitat into which they moved (b and c). SFS=St. Francis’ satyrs,
ABB=Appalachian brown.
0.0 0.2 0.4
Control Cut and Dam
Sur
viv
al
Species SFS ABB 0.0 0.2 0.4 0.6 0.8 Sedge Shr ub F orest P er centa ge of T
48 Figure 2.3. Population indices measured for St. Francis’ satyr (SFS) and Appalachian browns (ABB).
0 10 20 30 40
Control Tree Removal
P
opulation Inde
x
Species
SFS