The Effect of Bio-Based Additives on Engine Performance and Emissions
of Petrol and Diesel Engine
MohamadIhsan Ahmad Zainuri
a, Zulkarnain Abdul Latiff
b,
MohdFaridMuhamadSaid
c, Azhar Abdul Aziz
d,MohdRoziMohdPerang
eAutomotive Development Centre (ADC) Faculty of Mechanical Engineering
UniversitiTeknologi Malaysia 81310 Johor Bahru, Malaysia Tel : (607) 5535447. Fax : (607) 5557097
a[email protected], b[email protected], c[email protected], d[email protected], e[email protected]
ABSTRACT
Fuel additives are additives that are added to fuel in small quantities to give improvement in terms of engine performance and emissions. Aftermarket fuel additives can be divided into two, chemical-based and bio-based. In this project, the effect of bio-based fuel additives on engine performance and exhaust emissions of a petrol and diesel engine is studied. The blending ratio is developed based on the instruction given on the bottle of the additives. The ratio of the fuel additives used for Vivo Racing (VR) is between 0.21% and 0.25%, Vivo Flawless (VF) is between 0.10% and 0.14% and Diesel Energy is between 0.14% and 0.18%. Constant throttle test had been done on both petrol and diesel engine. The results show that the fuel additives reduce brake power and brake specific fuel consumption while increasing brake thermal efficiency and reducing exhaust emissions. For brake power, VR0.24 is the best. For brake specific fuel consumption, the best are VR0.23 and VF0.11 for petrol and diesel engine respectively. For brake thermal efficiency, the best are VR0.24 and DE0.17. For HC composition, the lowest are VR0.25 and DE0.17. For CO composition, VR0.22 and DE0.14 are the lowest. As for NOx, the lowest are
VR0.25 and DE0.17.
Keywords
Fuel additives, engine performance, exhaust emissions
1. INTRODUCTION
Engine performance is one of the factors that differentiate engine capabilities from one to another. These capabilities are torque, power and fuel consumption. Nowadays, fuel consumption had been a major aspect in designing an engine because the earth’s fuel supply is currently limited and decreasing day by day. In order to improve that area of engine performance, two methods can be done which are by mechanical or chemical means.
The method by mechanical is to improve the engine mechanically. For example, modifying the bore and stroke an engine or add an aftermarket device to the engine like turbocharger and supercharger. This method can provide a huge amount of power and torque, but the cost is too expensive [1]. Meanwhile, by chemical means is to improve
chemically like changing to high quality of lubricants or use aftermarket fuel additives. Fuel additives can be bought a lower price and be use instantly. But the problem is does the amount of fuel additives added into the fuel tank suites the amount of fuel that is already in the tank.
Therefore, in this study, aftermarket fuel additives have been tested on petrol and diesel engine in order to examine the effect of the additives on engine performance and exhaust emissions.
2. AFTERMARKET FUEL ADDITIVES
Aftermarket fuel additives are substances that were added to fuel in small quantities into the fuel tank. It is added to provide an improved performance in terms of power and fuel consumption. It is also reduce exhaust emissions from engines. Generally, aftermarket fuel additives can be divided into two groups which are chemical-based and bio-based.
2.1 Chemical and Bio-Based Fuel Additives
Chemical-based fuel additives are additives that are made of chemicals and minerals. The drawback of using chemical-based products is that they main contain harmful chemicals that could affect human’s health.. Furthermore, the source of the chemical might be limited since it depends on the non-renewable resources.
Bio-based fuel additives are additives that are made of biomass such as plants or trees. Basically, bio-based products are advantageous in relation to depletion of resources. Bio-based could provide additional product functionalities, less resource intensive production and efficient use of all natural resources.
Vsafe’s products are an example of bio-based fuel additives. This is due to the products made of plant that is palm oil. Through the use of a new revolutionary method in refining and extracting palm oil, the company able to extract the special ingredients that create an extraordinary chemical effect when combined with any fuel.
Experimental study is done on the fuel additives in terms of fuel properties, also effect on engine performance and exhaust emissions. The blending ratio between fuel additives and base fuel is developed based on the standard formula given on the products. As the fuel is blend, the properties might change and need to be analyzed. Fuels properties that are been focus are density and calorific value. This is because these two properties are crucial elements that affect the engine performance [2]. For engine performance, the effect on brake power, brake specific fuel consumption and brake thermal efficiency is considered. As for emissions, the study focuses on hydrocarbon (HC), carbon monoxide (CO) and nitrogen oxide (NOx) composition.
Density test is done by measuring the weight of fuel in a piknometer. The weight is measured by using an electronic weighing machine. The volume of piknometer is constant which is 10.336 cm3.Calorific value is determined by igniting fuel samples in a bomb calorimeter. Bomb calorimeter is used to find the amount of heat energy produced by fuel during combustion. The unit for calorific value is kJ/kg.
Engine performance test is conducted on petrol and diesel engine. The test conducted is a constant throttle test where the engine speed is let constant at a high engine speed, then the speed is reduce by applying load [3,4]. The speed is reduced to the desired speed.
4. RESULTS AND DISCUSSIONS
4.1 Petrol Fuel Samples
Figure 1 shows the brake power against engine speed for Vivo Racing (VR) samples. Brake power decreases as the engine speed increases. Fuel sample with the highest brake power is VR0.24 with a maximum increase of 12.00% from base petrol. The lowest is VR0.23 with maximum decrease of 98.91%. Brake power is the net power produced by an engine. Higher brake power shows that the engine has a more power compared the lower ones.
Figure 1:Brake power against engine speed (petrol)
Figure 2 shows the graph of brake specific fuel consumption (bsfc) against engine speed. Bsfc increases as engine speed increases. Fuel sample with the highest bsfc is VR0.21 with a maximum increase of 20.35% based on base petrol bsfc. The lowest is VR0.23 with a maximum decrease of 38.59%. Lower bsfc means that engine is running with same power
but less fuel is consumed. Thus, lower bsfc leads to more fuel saved compared to a higher bsfc.
Figure 2: Brake specific fuel consumption against engine speed (petrol)
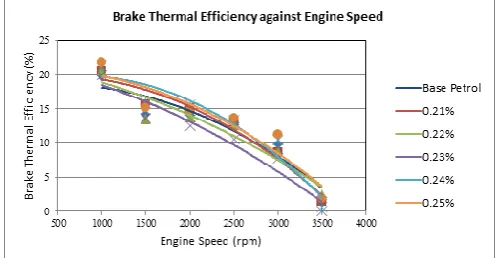
Figure 3 shows the brake thermal efficiency of each fuel samples against engine speed. As the engine speed increases, the brake thermal efficiency decreases. The results obtain show minor difference between all of the fuel samples. VR0.24 has the highest thermal efficiency with maximum increase of 12.34%. Meanwhile, the fuel sample with the lowest thermal efficiency is VR0.23 with a maximum decrease of 0.99%. Brake thermal efficiency indicates how much of heat energy converted to work. Generally, high brake thermal efficiency is beneficial since more heat energy is converted into work.
There are several reasons which affect the results. One of the reasons is calorific value. From previous study, it concluded that high calorific value gives high engine performance. This relates to the power produced by engine result from combustion of fuel. Based on the calorific value test results, the calorific value for VR0.24 and VR0.23 are 42693 J/g and 42238 J/g respectively. Hence, high calorific value results in high thermal efficiency.
Figure 3: Brake thermal efficiency against engine speed (petrol)
is V0.25 where it decreases maximum by 37.50% from base petrol.
HC composition indicates the amount of unburned hydrocarbon present in the exhaust system. These hydrocarbon produced because there is not enough of air to combust the fuel completely which leads to the formation of unburned hydrocarbon as product of the combustion. Less HC composition is better since it reduces power loss.
Figure 4: HC composition against engine speed (petrol)
Figure 5 shows the CO composition against engine speed. The trend of the graph shows that the lines fluctuate within the range of engine speed. Overall, all five samples added with Vivo Racing fuel additives have lower CO composition compared to base petrol. The lowest composition is from VR0.22 with maximum decrease of 24.20% from pure petrol. The least composition difference from pure petrol is VR0.24 where the minimum difference is 2.76%.
CO is produced due to the insufficient of air for carbon to react with. It usually occurs when the engine is operated with a fuel-rich air-fuel ratio. As fuel is burn, the elements of a fuel which is hydrogen (H) and carbon (C) will react with to form products of combustion. But, when air is not enough, the fuel cannot have a complete combustion. Hence, CO is produced.
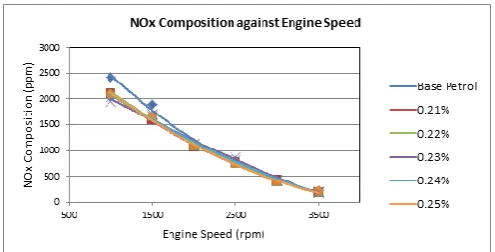
Figure 5: CO composition against engine speed (petrol) As illustrated in Figure 6, NOxcomposition decreases as the
engine speed increases. The difference between base petrol and other fuel samples can be seen at lower engine speed, but at higher engine speed, the composition is almost the same. Base petrol has the highest NOx composition compared to the
other fuels. The difference is 12.41% from the lowest point at 1500 rpm which is from VR0.23. The fuel sample with the
lowest NOxcomposition is VR0.25 which has a maximum
decrease of 13.99% from base petrol.
NOxproduced as a result of combustion. For combustion to
occur, a mixture of air and fuel is needed before a spark ignited the mixture. Basically, air that enters the combustion chamber consists of 80% nitrogen (N2). Atmospheric nitrogen
exists as a stable molecule at low temperature. However, at very high temperature inside the combustion chamber, the nitrogen become unstable and react with oxygen which produce nitrogen oxide (NOx).
Figure 6: NOxcomposition against engine speed (petrol)
4.2 Diesel Fuel Samples
Figure 7 shows brake power against engine speed for Vivo Flawless (VF) product. The lines show that brake power increases as engine speed increase. Base diesel has the highest brake power compared to other fuel samples. The lowest brake power is from VF0.14 with a maximum decrease of 6.65%.
Figure 7: Brake power against engine speed (Vivo Flawless)
Figure 8: Brake power against engine speed (Diesel Energy)
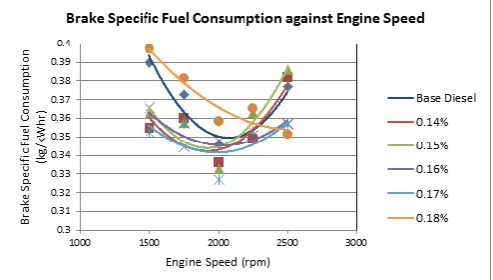
Figure 9 and 10 show brake specific fuel consumption for VF and DE product. The line of the graph is a quadratic line where bsfc decrease to a minimum point and increase afterwards. For VF product, the highest bsfc owns by base diesel while the lowest bsfc owns by VF0.11. Bsfc of VF0.11 decreases 12.12%. As for DE product, DE0.18 has the highest bsfc with maximum increase of 4.40% from base diesel. While the lowest bsfc owns by DE0.17 with maximum decrease of 9.47%.
Figure 9: Brake specific fuel consumption against engine speed (Vivo Flawless)
Figure 10: Brake specific fuel consumption against engine speed (Diesel Energy)
Figure 11 shows brake thermal efficiency against engine speed for Vivo Flawless product. . The line of graphs is a quadratic like where the efficiency increase and decrease as the engine speed increase. The brake thermal efficiency of all samples has minor difference between one to another where
the values are close to each other. The fuel sample with the highest brake thermal efficiency is VF0.10 with a maximum increase of 5.60% from base diesel. While the lowest brake thermal efficiency is from VF0.11 with a maximum decrease of 7.33%.
Figure 11: Brake thermal efficiency against engine speed (Vivo Flawless)
In Figure 12, the brake thermal efficiency against engine speed for Diesel Energy product is shown. The pattern of the graph is a quadratic line across the engine speed. Major difference is seen between DE0.17 and DE0.18 from other samples at engine speed of 2000 rpm. DE0.17 has the highest brake thermal efficiency among all samples. It increases 8.16% from base diesel. Meanwhile, DE0.18 has the lowest brake thermal efficiency which decrease 6.20% from base diesel.
Basically, the brake thermal efficiency of a diesel engine is higher compared to a petrol engine. This is due to the high compression ratio of a diesel engine. When comparing the thermal efficiency between diesel fuels, the most common factor is the calorific value of the fuel. Higher calorific value would give higher brake thermal efficiency under same condition of engine.
Figure 12: Brake thermal efficiency against engine speed (Diesel Energy)
Whereas, the lowest HC composition is VF0.13 which decreases 40.68% from base diesel.
Figure 13: HC composition against engine speed (Vivo Flawless)
As illustrated in Figure 14, the graph is quite similar as in Figure 13 in terms of their pattern. The lines increase at lower engine speed and decrease at higher engine speed. DE0.14 has the highest HC composition which is 102.27% from base diesel. While the fuel sample with the lowest HC composition is DE0.17 with a decrease of 57.89%.
HC composition is one of the undesired parameter in the exhaust gases. This is because it indicates the amount of the power loss by the engine since it is unburned fuel. Unburned fuel is produced due to the insufficient of air for the fuel to combust completely.
Figure 14: HC composition against engine speed (Diesel Energy)
In Figure 15, it shows the graph of CO composition against engine speed. The line of the graph is quadratic where the values of HC composition increase at lower engine speed till the middle and decrease afterwards. There are two samples that have higher CO composition compared to other samples which base diesel and VF0.13. VF0.13 has an increase of 8.07% from base diesel. While the fuel sample with the lowest CO composition is VF0.14 with a maximum decrease of 33.33%.
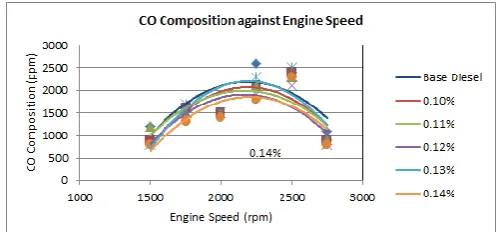
Meanwhile, Figure 16, shows the CO composition for Diesel Energy product. It has a similar pattern like in Figure 15. The highest CO composition recorded is from DE0.16 with a maximum increase of 21.74%. While the lowest CO composition is from DE0.14 with a maximum decrease of 33.33%.
Lower CO composition is better because it reduces the amount of poisonous carbon monoxide gases release from exhaust system of an engine. It also means that chemical energy can be minimize and fully utilize in the engine.
Figure 15: CO composition against engine speed (Vivo Flawless)
Figure 16: CO composition against engine speed (Diesel Energy)
Figure 17 shows the NOxcomposition against engine speed of
Vivo flawless product. The graph has quadratic lines where NOxcomposition increase and decrease. Base diesel has the
highest NOxcomposition with an increase of 28.47% from
VF0.12 which is situated in the middle between all the lines. While, VF0.14 has the lowest NOxcomposition with a
maximum decrease of 30.77% from base diesel.
Figure 17: NOx composition against engine speed (Vivo
Flawless)
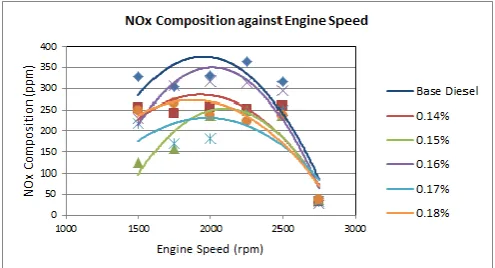
In Figure 18 the NOxcomposition for Diesel Energy product
is shown. The pattern of the graph is the same as in Figure 17 where the lines are quadratic lines. From the graph, base diesel has the highest NOxcomposition with a difference of
there are two samples with the lowest value which are at lower engine speed and higher engine speed. At lower engine speed, DE0.15 has the lowest NOxcomposition with a
maximum decrease of 61.89% from base diesel. Meanwhile, at higher engine speed, DE0.17 has the lowest NOx
composition with a maximum decrease of 45.32%.
NOxcomposition for five samples that were added with fuel
additives have decrease significantly from base diesel. NOx
are formed when the temperature inside the combustion chamber is high which means that the base diesel fuel has a high temperature during combustion compared to the other samples.
Figure 18: NOxcomposition against engine speed (Diesel
Energy)
5. CONCLUSION
Based on the experimental results for petrol and diesel engine, the effect of base fuel and blended fuel samples can be investigated in terms of engine performance and exhaust emissions. Generally, the blended fuel does not improve the brake power of the engines, however, it does reduce the brake specific fuel consumption and increase brake thermal efficiency. Furthermore, exhaust emissions such as HC, CO and NOx are reduced. Details on which blending ratios give
the best effect on engine performance and emissions are shown as follows:
1. For engine performance, fuel sample that gives the best result on brake power for petrol is VR0.24. 2. As for brake specific fuel consumption, the best are
VR0.23 and VF0.11 for petrol and diesel engine respectively.
3. For brake thermal efficiency, the best fuel samples are VR0.24 and DE0.17.
4. For exhaust emission, HC composition for both engines, the lowest is VR0.25 for petrol fuel samples. As for diesel fuel samples, the lowest is DE0.17.
5. For CO composition, the lowest are VR0.22 and DE0.14.
6. Lastly, for NOx composition, the lowest are VR0.25
for petrol, DE0.15 and DE0.17 for diesel.
ACKNOWLEDGMENT
The authors like to convey their thanks and gratitude to Vsafe Energy Sdn. Bhd for their support and assistance with this study and for their appreciation of the benefits to be gained from the research activities.
REFERENCES
[1] Hua Zhao and NicosLadommatos (2001).Engine Combustion Instrumentation and
Diagnostics.Warrendable, Pa: Society of Automotive Engineers, Inc.
[2] MichealPlint and Anthony Martyr (1998).Engine Testing Theory and Practice.Warrendable, Pa: Society of Automotive Engineers, Inc.
[3] Heywood, John B. (1988). Internal Combustion Engine Fundamentals.United States; McGraw Hill.
[4] Williard W. Pulkrabek (1999). Engineering Fundamental of the Internal Combustion Engine.