EFFECT OF THE ENVIRONMENT ON FATIGUE STRENGHT LIMIT OF SAE
8620 STEEL
Nelson do Nascimento Atanazio Filho, [email protected]
Msc, Centro de Desenvolvimento da Tecnologia Nuclear. Rua Professor Mário Werneck, SN, Cidade Universitária – Pampulha CEP 30123-970 BH/MG BRASIL.
Tanius Rodrigres Mansur, [email protected]
Dsc, Centro de Desenvolvimento da Tecnologia Nuclear. Rua Professor Mário Werneck, SN, Cidade Universitária – Pampulha CEP 30123-970 BH/MG BRASIL.
Emerson Giovani Rabello, [email protected]
Dsc, Centro de Desenvolvimento da Tecnologia Nuclear. Rua Professor Mário Werneck, SN, Cidade Universitária – Pampulha CEP 30123-970 BH/MG BRASIL.
Abstract. The effect of the environment on fatigue strength limit behavior was studied. This study comprised rotating-bending loading tests using specimens of SAE 8620 steel in air, distilled water and NaCl 3.5% solution. The resulting S-N-P
curves were similar for the tests conducted in air and distilled water at 60Hz (3600rpm). In NaCl 3.5% solution, the damage produced was similar the tests in air and distilled water at 60Hz, but the fatigue strength limit was lowered increasingly when the tests carried out in NaCl 3.5% solution at 11.7Hz (700rpm).
Keywords: Fatigue, Corrosion Fatigue, Fatigue Strength Limit, Pits, Crack Initiation
1. INTRODUCTION
Fatigue is the process of accumulative damage in a benign environment that is caused by repeated fluctuating loads and, in the presence of an aggressive environment, is know as corrosion fatigue. Fatigue damage of structural components subjected to normally elastic stress fluctuations occurs at regions of stress or strain raisers where the localized stress exceeds the yield stress of the material. After a certain number of the load fluctuations, the accumulated damage causes the initiation and subsequent propagation of cracks, in the plastically damaged regions. This process can and in many cases does cause the fracture of components. The more severe the stress concentration, the shorter the time to initiate a fatigue crack [1].
Corrosion fatigue behavior of a given material/environment system refers to the characteristics of the material under fluctuating loads in the presence of a particular environment. The corrosion fatigue behavior of a given system depends of the metallurgical, mechanical and electrochemical factors of the particular system [2]. Corrosion fatigue damage occurs more rapidly than would be expected from the individual effects of fatigue or corrosion. Generally, different environments have different effects on the cyclic behavior of a given material. Similarly, the corrosion fatigue behavior of different materials is usually different in the same environment. The behavior established for a given material/environment system or for a given set of test conditions should not be applied indiscriminately to other systems or conditions.
The stress-life approach to life prediction relies on characterizing the life of a material as a function of the applied cyclic stress. When the tests are terminated between 106 and 107 cycles and if failure does not occur in this period, the specimen is assumed to have infinite life at that stress level [3,4]. This relationship is plotted on a semi-log or log-log scale and is typically referred to as the material S-N curve. When considered the uncertainty in the prediction of fatigue life of metallic structure (i.e., failure probability (P)), these are designated as the material S-N-P curve [5,6].
In the present study the SAE 8620 carbon steel was used due to its use in industries such as automobilistics and energy generation [7, 8]. In this work was observed that the fatigue strength limit was similar in air and distilled water in the same frequency. The small difference in the results in air and distilled water was associated the presence of thermal stresses in tests carried out in air. The fatigue strength limit was lowered increasingly with decreasing of frequency in NaCl 3.5% solution. The decreasing of frequency increased the time of corrosion and the damage caused by fatigue corrosion.
2. EXPERIMENTAL PROCEDURE
2.1. Material and Specimens
In the present study the structural steel SAE 8620 was used. Its chemical composition is shown in Table 1. The main mechanical properties of this steel are listed in Table 2. The material was investigated in the received conditions.
Table 1 – Chemical composition of SAE 8620 steel (wt.%).
Ni Cr Mo Mn Cu Al Si P S C Fe 0.42 0.50 0.16 0.78 0.09 0.019 0.23 0.016 0.032 0.19 Bal.
Table 2 – Mechanical properties of SAE 8620 steel. Yield strength
(offset = 0.2%) (MPa) Tensile strength (MPa) Elongation (%) Reduction of area (%) Hardness (HV) Hardness (HB)
464 634 20 66 202 192
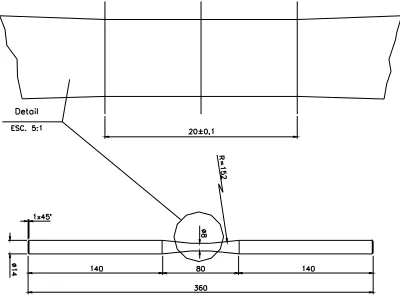
In microstructural analysis the specimens were etched with Nital 2% and were analyzed by software Quantikov [9]. After the chemical, microstructural and mechanical characterization, fatigue specimens were machined to the configuration shown in Figure 1. The roughness surface (Ra) of the gage sections of the all specimens were (0.09±0.02)µm.
2.2. Test Procedure
Rotating-bending machine of the constant bending moment type was used in the present research. All fatigue tests were conduced at constant strain amplitudes and a frequency of 11.7Hz (700rpm) and 60Hz (3600rpm) with a stress ratio (R) of -1. The corrosion fatigue tests were conducted at 11.7Hz and 60Hz in a 0.6M NaCl solution made by marine salt and distilled water with pH 6.2. The aerated solution was circulated from and to a reservoir via corrosion cell fitted on the specimen at room temperature. The corrosion cell developed to conduct the aggressive environment tests are shown in Figure 2. The electrolyte (10L) was pumped through the cell in a 0.3L/h flow rate. The tests were conduced until the specimens broken with
stress level between 10.8MPa and 297MPa at 11.7Hz and between 208MPa and 297MPa at 60Hz. The fatigue limit in long life regime above 106 cycles in SAE 8620 steel resulted in S-N-P (stress-number of cycles-probability) curves at 11.7Hz.
The fatigue tests in air and refrigerated with distilled water were carried out at 60Hz with a stress level between 208MPa and 297MPa [10]. The corrosion fatigue tests in a 0.6M NaCl solution were not carried out at 60Hz because the results were similar to those obtained in distilled water.
Figure 1. Fatigue test specimen configuration. Dimensions in mm.
Figure 2. Cell used in the corrosion fatigue tests in the aggressive environment.
After corrosion fatigue tests, lateral surfaces of the specimens were examined in detail using a JEOL JSM-5310 scanning electron microscope (SEM). The electrochemical potential was not measured during the tests.
3. RESULTS AND DISCUSSION
3.1. Microstructure
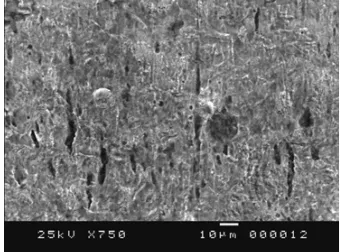
Figure 2 illustrates the microstructure of the SAE 8620 steel in cross section. Figure 2a shows a large amount of non-metallic inclusions dispersed in the non-metallic matrix. Figure 2b shows the ferritic-perlitic microstructure of the SAE 8620 steel with 55% of ferrite and medium size of grain of ferrite of 12µm. Figure 2c shows a non-metallic inclusion with medium size of 10µm. Fatigue crack initiation in inclusions on the material’s surface may occur through the debonding of the inclusion from the matrix interface, separation of internal boundaries or through fracturing of the inclusion itself. This inclusions can act as sites for particle-induced corrosion pitting in the structure and serves to eliminate the initiation portion of its fatigue life
[11,12]. The interfacial separation matrix-inclusion is induced during the tensile loading. The fatigue lifetime is decreased by the presence of inclusions. The chemical composition of the inclusions was not identified at this time.
a) 200X b) 500X c) 1000X
Figure 3. Micrograph of a cross section of SAE 8620 steel.
3.2. Fatigue Limit
The S-N-P curves were determined by regression with life date analysis using statistical software MINITAB for failure probability (P) of 0.01, 0.50 and 0.99. Figure 3 shows the S-N-P curves for SAE 8620 steel from fatigue tests in air and refrigerated with distilled water carried out at 60Hz. The fatigue strength limit in this conditions was 178MPa and 197MPa respectively.
100 150 200 250 300 350
1,0E+02 1,0E+03 1,0E+04 1,0E+05 1,0E+06 1,0E+07 1,0E+08 1,0E+09
Number of cycles
S
tress (M
P
a)
p = 0,01 (air) p = 0,50 (air) p = 0,99 (air) p = 0,01 (water) p = 0,50 (water) p = 0,99 (water)
Figure 3. S-N-P curves of SAE 8620 in air and distilled water; f = 60Hz and R = -1.
As can be observed, in the tests carried out in aqueous environmental the fatigue strength limit was slightly better than in air. This happened due to the elimination of the thermal effect caused by the fatigue in air. In the specimens when submitted in fatigue tests in air, it happens a significant increase of the temperature. This temperature increase generates a thermal gradient in the specimens generating its linear and volumetric dilatation. Due to the specimens them be arrested to fatigue machine during the tests, there is a restriction the this dilation and the thermal origin tensions show through an increase in the applied tension [10]. Those thermal tensions were not determined. The refrigeration with distilled water exerted a beneficent influence on the SAE 8620 steel fatigue strength limit.
Figure 4 shows the S-N-P curves for SAE 8620 steel from fatigue tests carried out in 0.6M NaCl aerated solution at 11.7Hz. The fatigue strength limit in this conditions was 1.8MPa.
0 50 100 150 200 250 300 350
1,0E+04 1,0E+05 1,0E+06 1,0E+07
Number of cycles
St
re
s
s
(
M
Pa
)
p = 0,01 p = 0,50 p = 0,99
Figure 4. S-N-P curves of SAE 8620 in 0.6M NaCl aerated solution; f = 11.7Hz and R = -1.
In the studies of the fatigue and corrosion fatigue, crack initiation mechanisms aimed to identify the preferential sites for crack initiation and microstructural particularities and/or peculiarities associated to these sites. These sites are possibly responsable for premature fatigue or corrosion fatigue crack initiation and contribute to reducing the fatigue life of the alloys.
The results in literature [13, 14] report that the main stages of damage leading to environment-assisted fatigue failure from defect-free surfaces include: breakdown of the surface passive film, pit development and growth, transition from pitting to cracking, crack growth and crack coalescence. The environment acts on the material through the surface, producing uniform or localized chemical attack by diffusive mass transfer [15].
Localized corrosion (pits) on the surface of materials occur largely in passive metals or alloys in contact with neutral aqueous solutions containing aggressive anions such as chloride [16]. The pits formations are a major consideration for engineering components with high integrity surface finish. If a residual or applied mechanical stresses occur together with an aggressive environment, the early development of pits and subsequent cracks can play a major role in the total lifetime of a component [17]. Corrosion pits are typically smaller than a millimeter in depth and serve as micronotches with locally elevate the stress level.
Various factors are important to corrosion fatigue behavior. The effect of decreasing frequency on pit nucleation and growth can be observed in Figure 5. Figure 5 shows lateral surfaces of specimens after corrosion fatigue tests conducted using SAE 8620 carbon steel in 0.6M NaCl aerated solution. The tests were carried out under constants conditions but at different cycle test frequencies until the specimens are broken. Figure 5(a) shows the test carried out at 11.7Hz and Figure 5(b) shows the test at 60Hz.
(a) Nf = 135419 cycles; time of exposure: 194 minutes. (b) Nf = 175893 cycles; time of exposure: 94 minutes.
Figure 5. Effect of frequency (time of exposure) on the fatigue corrosion behaviour of SAE 8620 steel in 0.6M NaCl aerated solution. The applied stress was 198MPa and R = -1.
The decreasing of frequency increases the exposure time of material to the environment. The corrosive environment favors the formation of geometric discontinuities on the surface of specimens, thereby favoring crack nucleation. As this process is time dependent, the influence of the aggressive environment on the material’s fatigue life increases as the metallic
The aggressive environment evidently exerts a strong influence on the fatigue crack initiation. The geometric discontinuities (pits) cause stress and strain concentrations, favoring fatigue crack initiation in these regions [18]. The initiation of a crack from a pit can be observed in Figure 6.
Figure 6. Fatigue crack initiation at corrosion pits observed in corrosion fatigue test on SAE 8620 in 0.6M NaCl solution. The stress applied was 198MPa, R = -1 and f = 11.7Hz.
The important effect of crack initiation an crack growth on fatigue life prediction has received more and more attention in recent years. The transition from a pit to a fatigue crack is considered to be an extremely important stage on fatigue lifetime and might be regarded as a damage mechanism transition point [19].
4. CONCLUSIONS
The fatigue strength limit was similar in air and distilled water in the same frequency. The small difference in the results in air and distilled water was associated the presence of thermal stresses in tests carried out in air.
The fatigue strength limit was lowered increasingly with decreasing of frequency in NaCl 3.5% solution. The decreasing of frequency increased the time of corrosion and the damage caused by fatigue corrosion.
5. REFERENCES
[1] Barson, J. M., Rolfe, S. T., Fracture and Fatigue Control in Structures: applications of fracture mechanics, ASTM, Philadelphia, PA, 1999.
[2] Zhang, R., Mahadevan, S., “Reliability-based reassessment of corrosion fatigue life,” Structural Safety, Vo. 23, 2001, pp. 77-91.
[3] Sing, A., “The nature of initiation and propagation S-N curves at and below the fatigue limit,” Fatigue & Fracture of
Engineering Materials & structures, Vol. 25, 2002, pp. 79-89.
[4] Itoga, H., et al., ‘Effect of surface roughness on step-wise S-N characteristics in high strength steel,” International
Journal of Fatigue, Vol. 25, 2003, pp. 379-385.
[5] Ang, A. H. S., et al., “Reliability-based fatigue analysis and design of floating structures,” Marine Structures, Vol. 14, 2001, pp 25-36.
[6] Akid, R., Dmytrakh, I. M., Gonzalez-Sanchez, J., “Fatigue damage accumulation: aspects of environmental interaction,”
Materials Science, Vol. 42, 2006, pp. 42-53.
[7] Bayrakceken, H., “Failure analysis of an automobile differential pinion shat,” Engineering Failure Analysis, Vol. 13, 2006, pp. 1422-1428.
[8] Gomes, P. T. V., Cruz, J. R. B., Rabello, E. G., Mattar Neto, M., “Normalizing treatment influence on the forged steel SAE 8620 fracture properties,” Materials Research, Vol. 8, 2005, pp. 57-63.
[9] Pinto, L. C. M., 1996, “Quantikov: um analisador microestrutural para o ambiente Windows,” Dsc Thesis, Instituto de Pesquisas em Engenharia Nuclear, São Paulo, Brazil, 1996.
[10]
Mansur, T. R., “Evaluation and development of models of determination of accumulation of damages for fatigue in a structural steel,” Dsc thesis, Centro de Desenvolvimento da Tecnologia Nuclear. Belo Horizonte, Brazil, 2003.[11] Dolley, E. J., Lee, B., Wei, R. P., “The effect of pitting corrosion on fatigue life,” Fatigue & Fracture Engineering
Materials & Structures, Vol. 23, 2000, pp. 555-560.
[12] Murtaza, G., Akid, R., “Empirical corrosion fatigue life prediction models of a high strength steel,” Engineering
Fracture Mechanics, Vol. 67, 2000, pp. 461-474.
[13] Gironès, A., et al., “Influence of artificial seawater on the cyclic response of superduplex stainless steels,” International
journal of Fatigue, Vol. 27, 2005, pp. 197-202.
[14] Turnbull, A., McCartney, L. N., Zhou, S., “A model to predict the evolution of pitting corrosion and the pit-to-crack transition incorporating statistically distributed input parameters,” Corrosion Science, Vol. 48, 2006, pp. 2084-2105.
[15] Scheiner, S., Hellmich, C., “Stable pitting corrosion of stainless steel as diffusion-controlled dissolution process with a sharp moving electrode boundary,” Corrosion Science, Vol. 49, 2007, pp. 319-346.
[16] Pan, H. L., Tang, S. H., Hao, J. W., “Failure analysis of a rotating cantilever shaft in chloride corrosive environment,”
Engineering Failure Analysis, Vol. 13, 2006, pp. 646-655.
[17] Giordani, E. J., et al., “Effect of precipitates on the corrosion-fatigue crack initiation of ISO 5832-9 stainless steel biomaterial,” International Journal of Fatigue, Vol. 26, 2004, pp. 1129-1136.
[18] Rajasankar, J., Iyer, N. R., “A probability based model for growth of corrosion pits in aluminium alloys,” Engineering
Fracture Mechanics, Vol. 73, 2006, pp. 553-570.
[19] Shi, P., Mahadevan, S., “Probabilistic corrosion fatigue life prediction,” Proceedings of ASCE SPECIALTY CONFERENCE PROBABILISTIC MECHANICS AND STRUCTURAL RELIABILITY, 8, Indiana, University of Notre Dame, 2000. 14 January 2006 <http://eng/johnsone/pmc>.